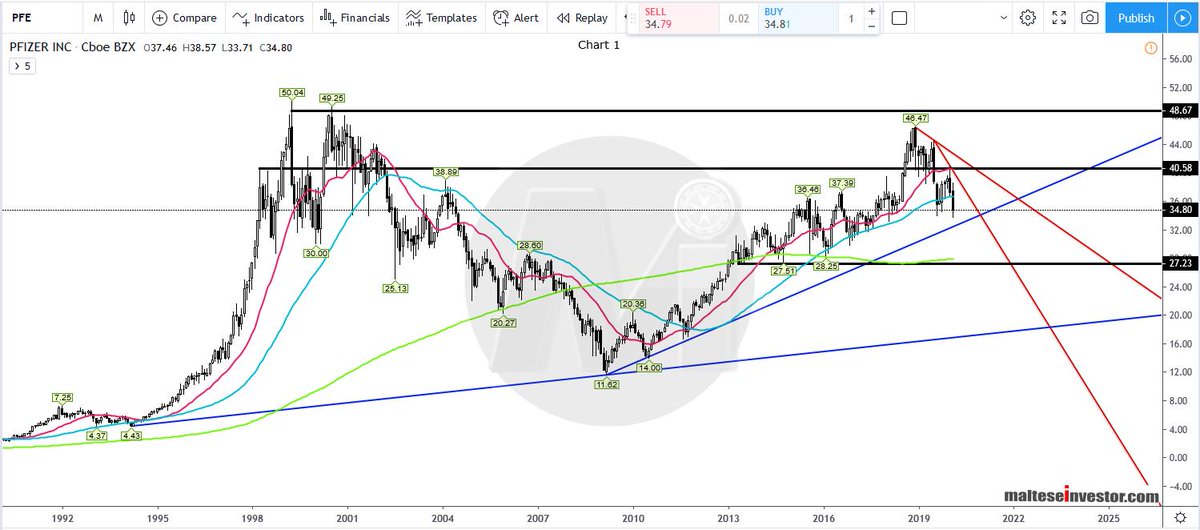
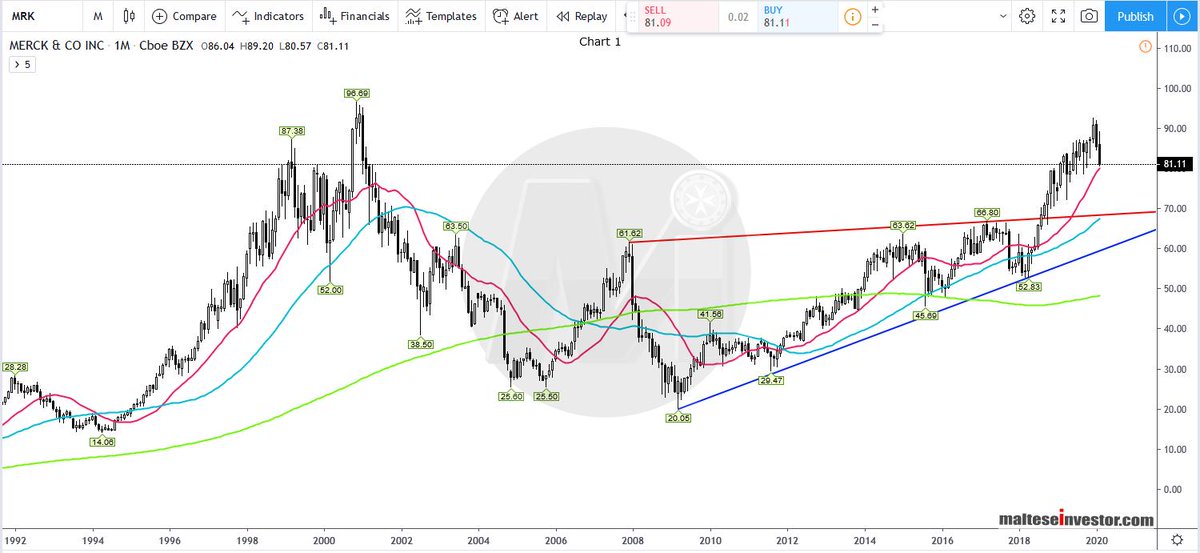
Monthly Chart: Merck is still long term #bullish but finding #resistance at channel top and breaking down - a close below 79.20 targets 74.60 - 72.90. Good #support at 68.30 - 66.50 (broken #trendline resistance and SMA 50) and further down #SMA 200 at 48.29.
MRK 2/3
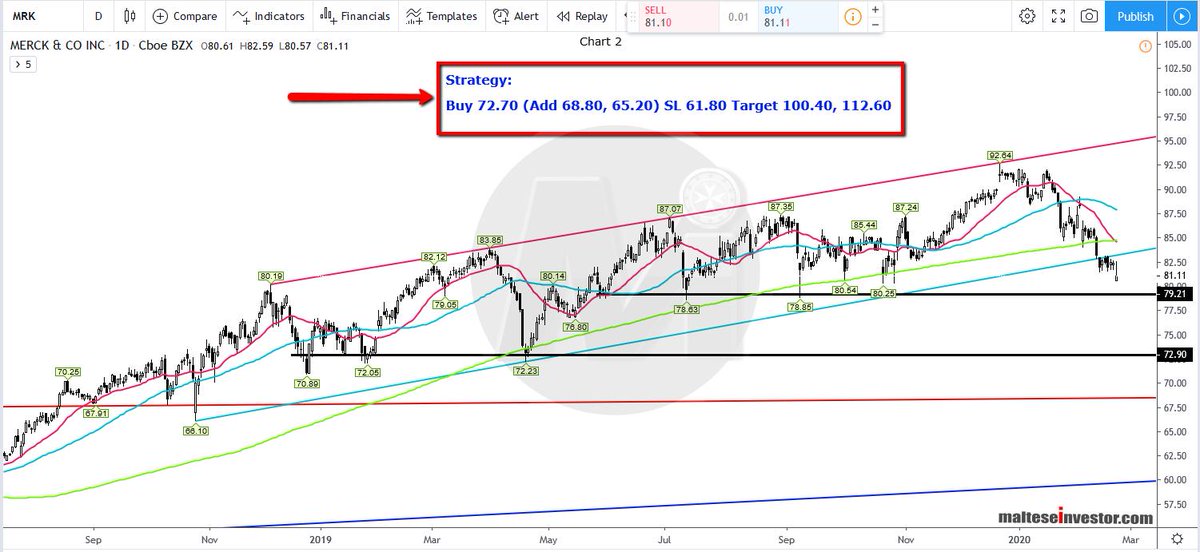
Daily Chart: The main SMAs are all negative pointing to further declines - however, the long term objective is 112.60.
The #Strategy is printed on the image.
$MRK 3/3
