THREAD: A picture is worth a thousand words. Let's look at a few of the globe's largest #ETF's & their graphs & see if we can make some sense of the current market environment.
What a year it's been for #Oil & #Energy! Only positive YTD #MSCI #Sector.
$IXC
What a year it's been for #Oil & #Energy! Only positive YTD #MSCI #Sector.
$IXC

2/19
#Global #CleanEnergy #ETF relative to Global #Energy shows an interesting picture.
$ICLN vs $IXC
#Global #CleanEnergy #ETF relative to Global #Energy shows an interesting picture.
$ICLN vs $IXC


3/19
#EmergingMarkets #ETF seriously lagging #DevelopedMarkets ETF, mostly due to disinvestment from #China.
#SouthAfrica might be down over 1YR, but $EZA performance in USD (-15.9%) is still way ahead of both $URTH (DM -22.2%) & $EEM (EM -28.9%) over the same period.
#EmergingMarkets #ETF seriously lagging #DevelopedMarkets ETF, mostly due to disinvestment from #China.
#SouthAfrica might be down over 1YR, but $EZA performance in USD (-15.9%) is still way ahead of both $URTH (DM -22.2%) & $EEM (EM -28.9%) over the same period.


4/19
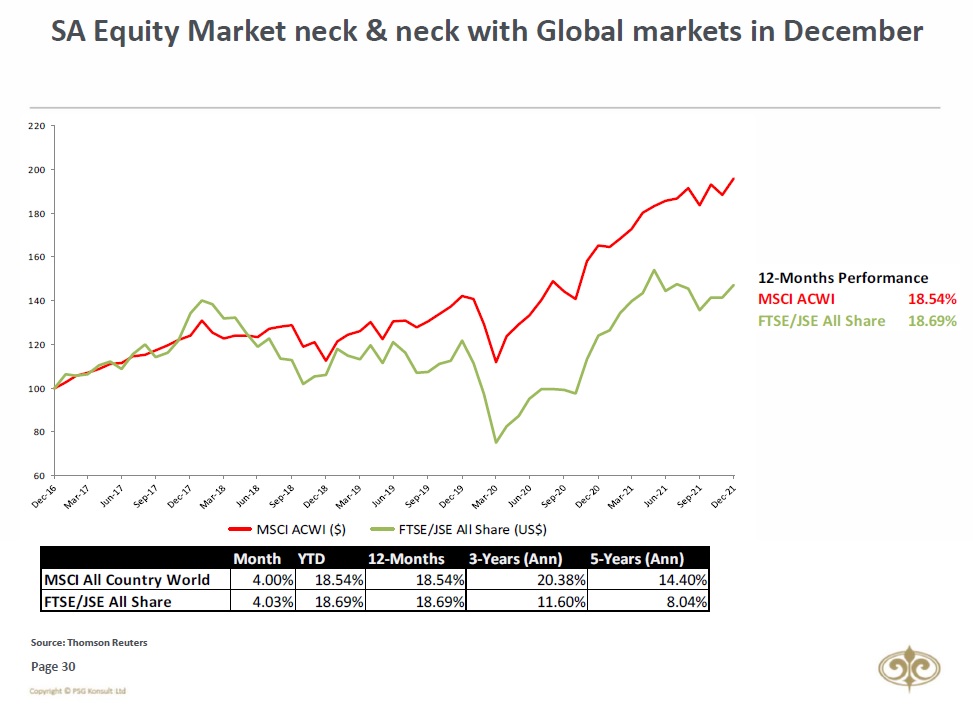
#MSCI #World with & without US included. US has definitely been the safe haven over the past 10 years, but it created quite a "premium".
$IXUS vs $ACWI
#MSCI #World with & without US included. US has definitely been the safe haven over the past 10 years, but it created quite a "premium".
$IXUS vs $ACWI


5/19
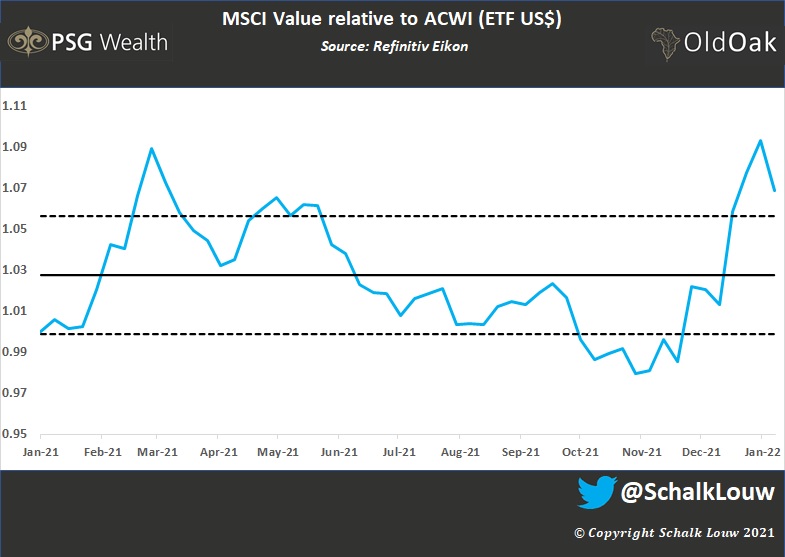
From a #Factor #Investing point of view, did #Global #LowVolatility & #Value #stocks (#ETF) do exactly what's expected from them in current market conditions but still got some serious catch-up to do over the longer term. Watch this space.
$ACWV $IWVL
From a #Factor #Investing point of view, did #Global #LowVolatility & #Value #stocks (#ETF) do exactly what's expected from them in current market conditions but still got some serious catch-up to do over the longer term. Watch this space.
$ACWV $IWVL


6/19
When I see something in the media about #Global #Tech #stocks & hear so many comments to "buy the dip". Tech is down 30.5% over 12 months relative to the #MSCI AC World Index's -23.1%. The relative graph, however, doesn't show a massive "dip" yet.
$IXN vs $ACWI
When I see something in the media about #Global #Tech #stocks & hear so many comments to "buy the dip". Tech is down 30.5% over 12 months relative to the #MSCI AC World Index's -23.1%. The relative graph, however, doesn't show a massive "dip" yet.
$IXN vs $ACWI


7/19
#VideoGaming seriously lagged #Global #Tech. ETF has quite a bit of exposure to #China (11%) & #Taiwan (2%) combined, which might've contributed. Interesting nevertheless. If you liked this market or #ETF a little bit more than a year ago, you'll love them now.
$HERO $IXN
#VideoGaming seriously lagged #Global #Tech. ETF has quite a bit of exposure to #China (11%) & #Taiwan (2%) combined, which might've contributed. Interesting nevertheless. If you liked this market or #ETF a little bit more than a year ago, you'll love them now.
$HERO $IXN


8/19
#Internet companies, in general, lost a bit of "internet-speed" recently, with US Internet Co's $FDN #ETF losing more than half its value over the past 12 mths (-53%)
#Chinese Internet Co's $KWEB lost 51% over the same period.
KWEB still lag over 3yrs.
#Internet companies, in general, lost a bit of "internet-speed" recently, with US Internet Co's $FDN #ETF losing more than half its value over the past 12 mths (-53%)
#Chinese Internet Co's $KWEB lost 51% over the same period.
KWEB still lag over 3yrs.


9/19
Speaking of #Chinese co's. China Large-Cap $FXI #ETF massively underperformed #MSCI #EmergingMarkets $EEM ETF, as well as MSCI #SouthAfrica $EZA.
South Africa recently caught up to MSCI EM in USD over a 3-year period & now leads.
Speaking of #Chinese co's. China Large-Cap $FXI #ETF massively underperformed #MSCI #EmergingMarkets $EEM ETF, as well as MSCI #SouthAfrica $EZA.
South Africa recently caught up to MSCI EM in USD over a 3-year period & now leads.


10/19
If you feel sorry for Equity investors this year, spare a thought for the "safer" Bonds investment.
#US #Bonds lagged #Equities. $TLT #ETF relative to $SPY really looks interesting currently.
If you feel sorry for Equity investors this year, spare a thought for the "safer" Bonds investment.
#US #Bonds lagged #Equities. $TLT #ETF relative to $SPY really looks interesting currently.


11/19
And with #Inflation still very much the main topic in current markets, one would think that #US #TIPS #ETF would've rocked the 2022 "party". Think again. The relative graph shows it was a better place to be.
$TIP vs $TLT
And with #Inflation still very much the main topic in current markets, one would think that #US #TIPS #ETF would've rocked the 2022 "party". Think again. The relative graph shows it was a better place to be.
$TIP vs $TLT


12/19
And just like #EmergingMarkets equities lagged #DevelopedMarkets equities, #Bonds were no different. Global Government Bond #ETF $IGLO down 23.3% over 12 months versus -27.4% for the EM Bonds ETF $EMB.
And just like #EmergingMarkets equities lagged #DevelopedMarkets equities, #Bonds were no different. Global Government Bond #ETF $IGLO down 23.3% over 12 months versus -27.4% for the EM Bonds ETF $EMB.


13/19
#BlockchainTechnology going from absolute hero to zero! After rocket moves early 2021, $BLOK #ETF gave back all outperformance against #Global #Tech & now lags $IXN over 3 years.
#BlockchainTechnology going from absolute hero to zero! After rocket moves early 2021, $BLOK #ETF gave back all outperformance against #Global #Tech & now lags $IXN over 3 years.


15/19
What's your view on the US #Dollar?
$GLD relative to $UUP or, for that matter, the $DXY, is definitely something to monitor, IMHO.
#Gold #ETF
What's your view on the US #Dollar?
$GLD relative to $UUP or, for that matter, the $DXY, is definitely something to monitor, IMHO.
#Gold #ETF


16/19
#Gold lagged #MSCI #Global #Equities (#ETF's) over the longer-term but remained stable relative to this year, with 15% outperformance over the past 12 months.
$GLD versus $ACWI
#Gold lagged #MSCI #Global #Equities (#ETF's) over the longer-term but remained stable relative to this year, with 15% outperformance over the past 12 months.
$GLD versus $ACWI


17/19
If you like #Gold, you might find the #GoldMiners interesting at current levels. Despite Gold lagging #Equities over the past 3 years, the actual miners' #ETF lagged even more.
$GDX $GLD
If you like #Gold, you might find the #GoldMiners interesting at current levels. Despite Gold lagging #Equities over the past 3 years, the actual miners' #ETF lagged even more.
$GDX $GLD


18/19
#Gold wasn't the only metal that lagged #Equities up to recently. #PreciousMetals #ETF is looking very interesting over the longer term. Especially if you look at current #inflation worries & global political unrest (#fear) & USD question marks.
$GLTR vs $ACWI
#Gold wasn't the only metal that lagged #Equities up to recently. #PreciousMetals #ETF is looking very interesting over the longer term. Especially if you look at current #inflation worries & global political unrest (#fear) & USD question marks.
$GLTR vs $ACWI


19/19 & Final
And then finally, what would market feedback be without #smallcaps? Beginning of last year, there was a lot of FOMO going around, after a massive run in #Russell2000. By Feb this year, all outperformance against S&P500 was returned & more.
$IWM vs $SPY
And then finally, what would market feedback be without #smallcaps? Beginning of last year, there was a lot of FOMO going around, after a massive run in #Russell2000. By Feb this year, all outperformance against S&P500 was returned & more.
$IWM vs $SPY


• • •
Missing some Tweet in this thread? You can try to
force a refresh