To start, here is the distribution of EBITDA yields (higher = cheaper) through time (shaded=overall average, red=each year)
Here's just those two periods, side by side
in 2000, you see tech an telecom are super expensive (low yields), but others more reasonable.
in 2017 (today), valuations are far more homogeneous
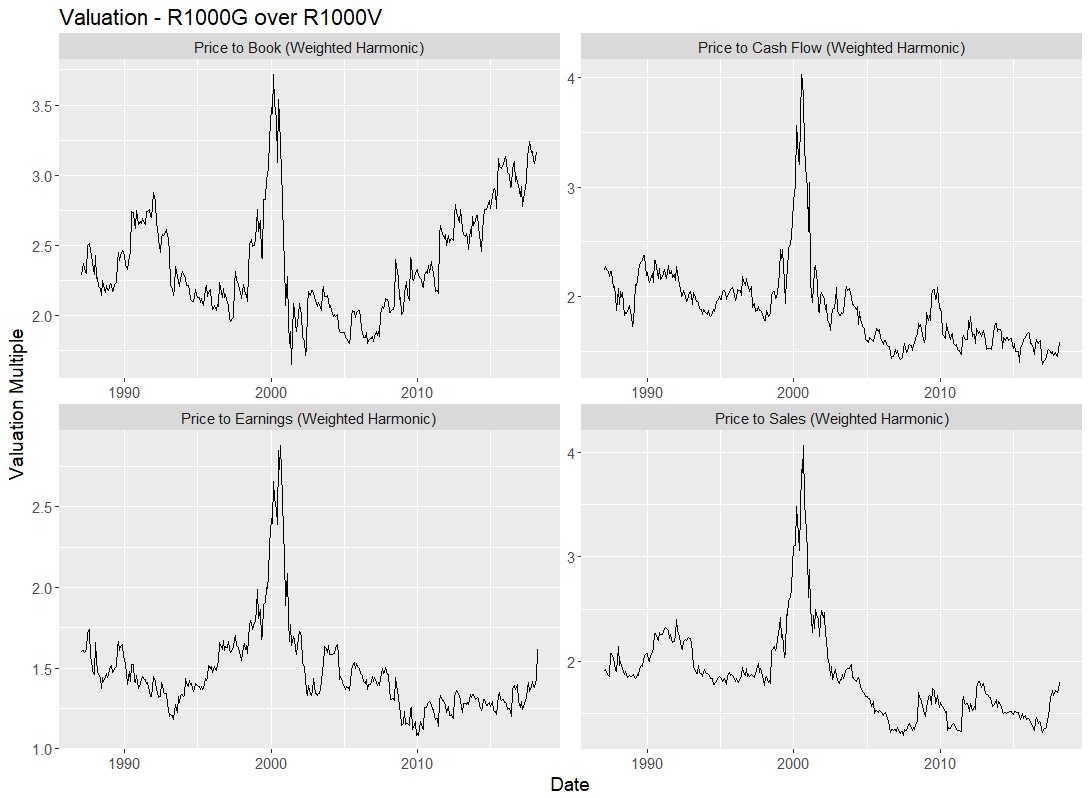
The degree to which these things predict future factor performance is questionable.
Stay tuned for more in a few weeks.

