A graphical thread on the UK population & how it's changing over time.
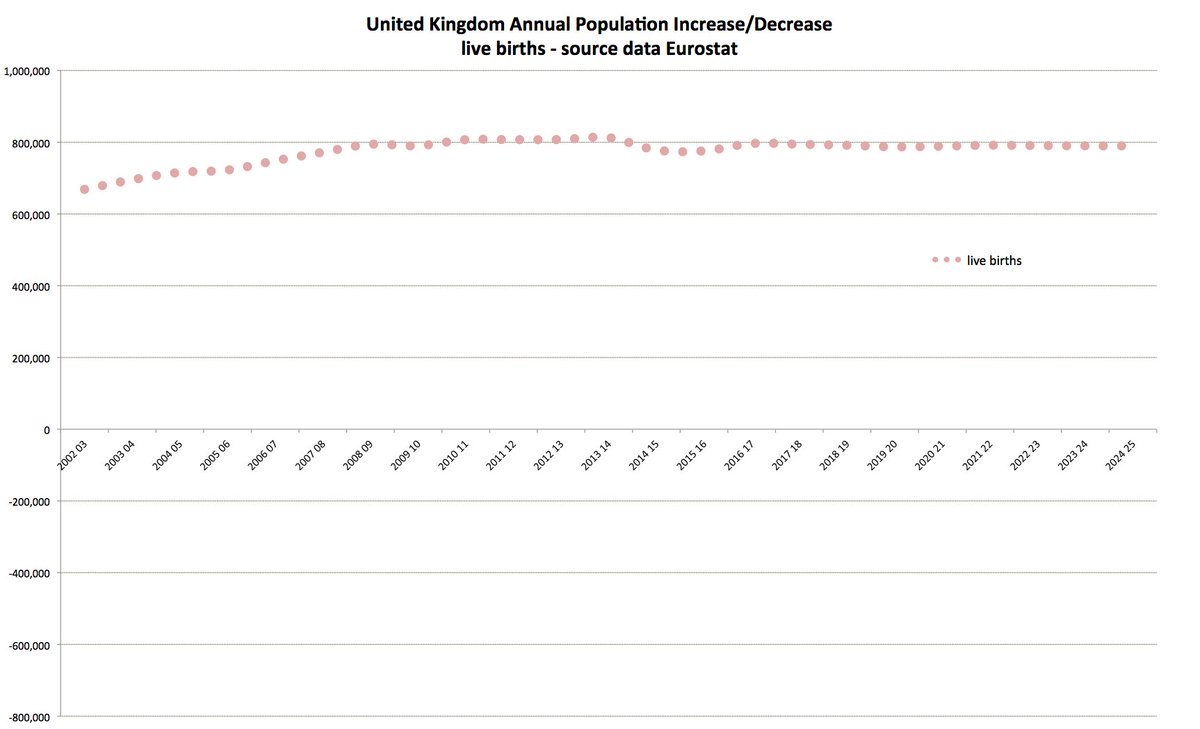
1. A good place to start is to think about births - a pretty good indicator of whether a country represents a hospitable environment.
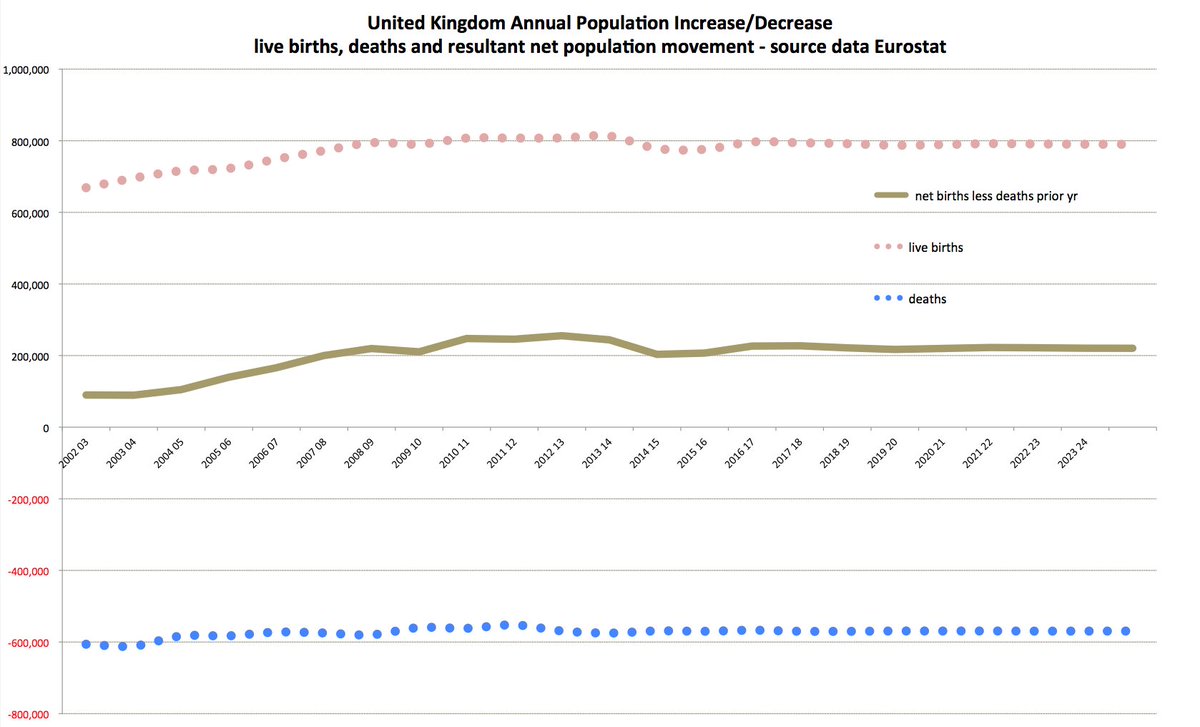
The UK population increases by around 800,000 births each year.
1. A good place to start is to think about births - a pretty good indicator of whether a country represents a hospitable environment.
The UK population increases by around 800,000 births each year.
2. Those arriving are balanced to a large extent by those departing and the UK has around 600,000 deaths each year ATM.
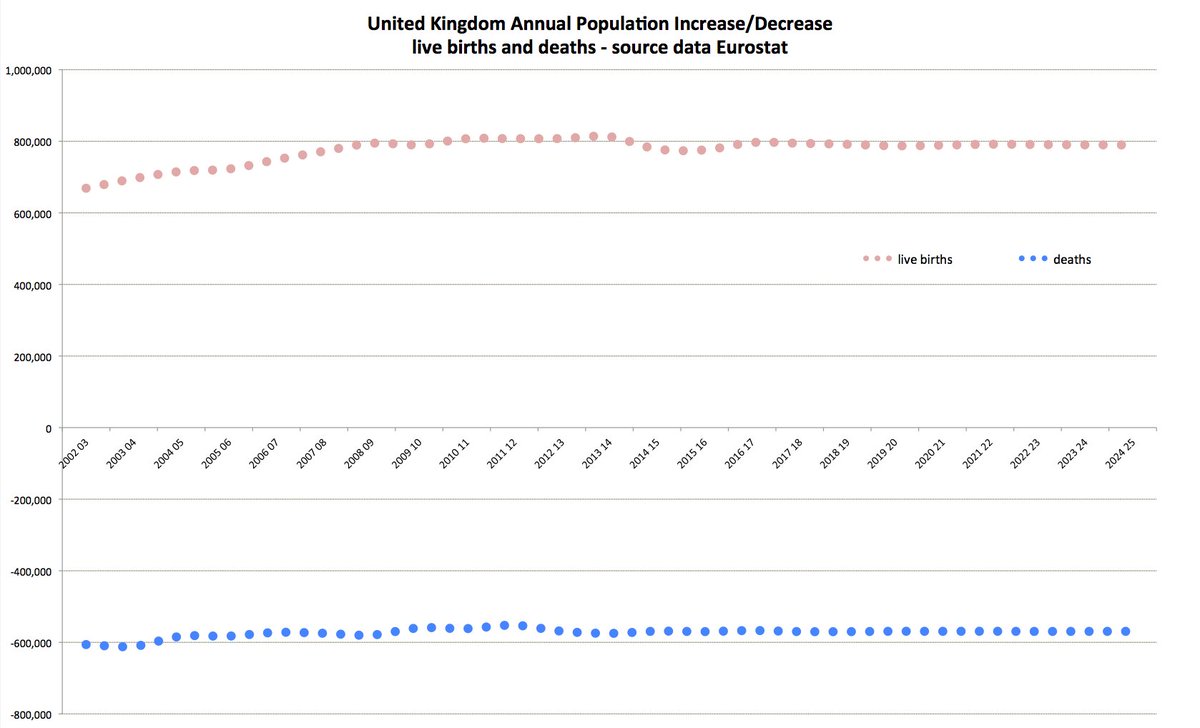
3. Which means that the UK has an internal population growth rate of about 200,000 per annum (births less deaths). This rate of growth increased from around 100,000 to 200,000 between 2002 - 2007 & it's remained pretty constant since.
That's +1 million every 5 years.
That's +1 million every 5 years.
4. The components of this internal growth can be seen to be the increase in the birth rate from 700,000 to 800,000 between 2002 - 2007 & an increase in longevity - people are dying later than they used to & that relationship is evident when we overlay the increase in over 65's.
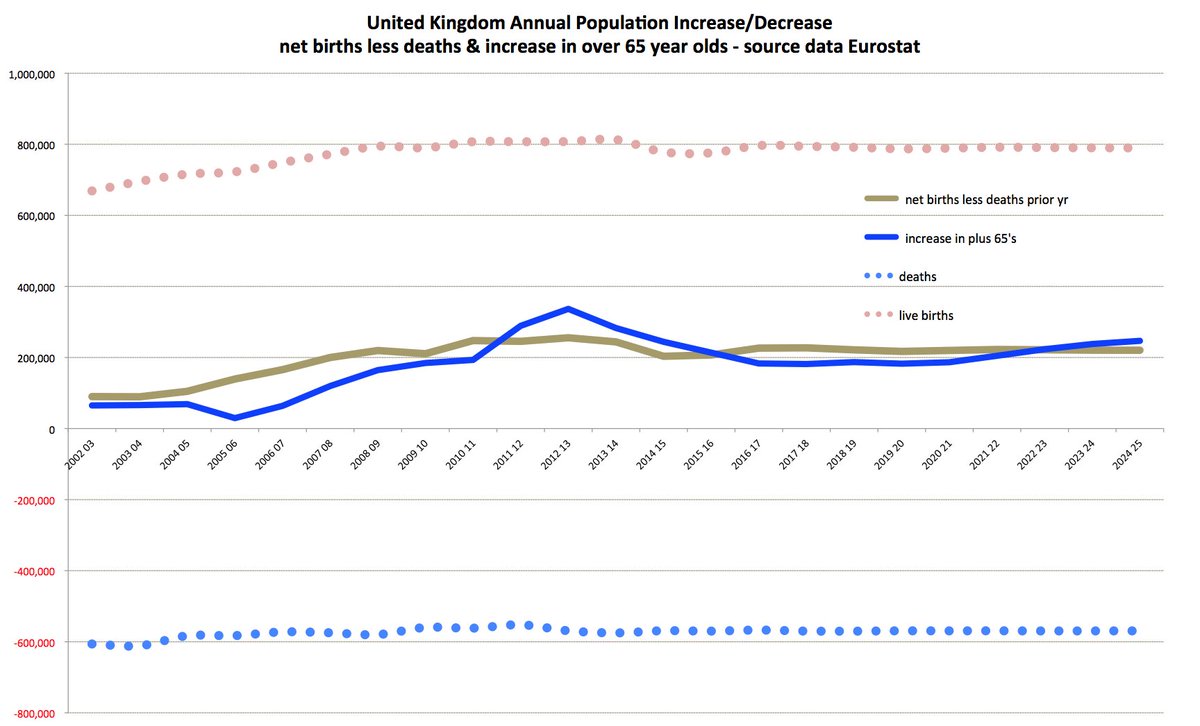
5. The good news is that we're living longer but that brings with it an increase in the elderly population of 1 million every 5 years & this component of the population is both heavily dependent and non-productive economically. It creates a demand which someone must meet.
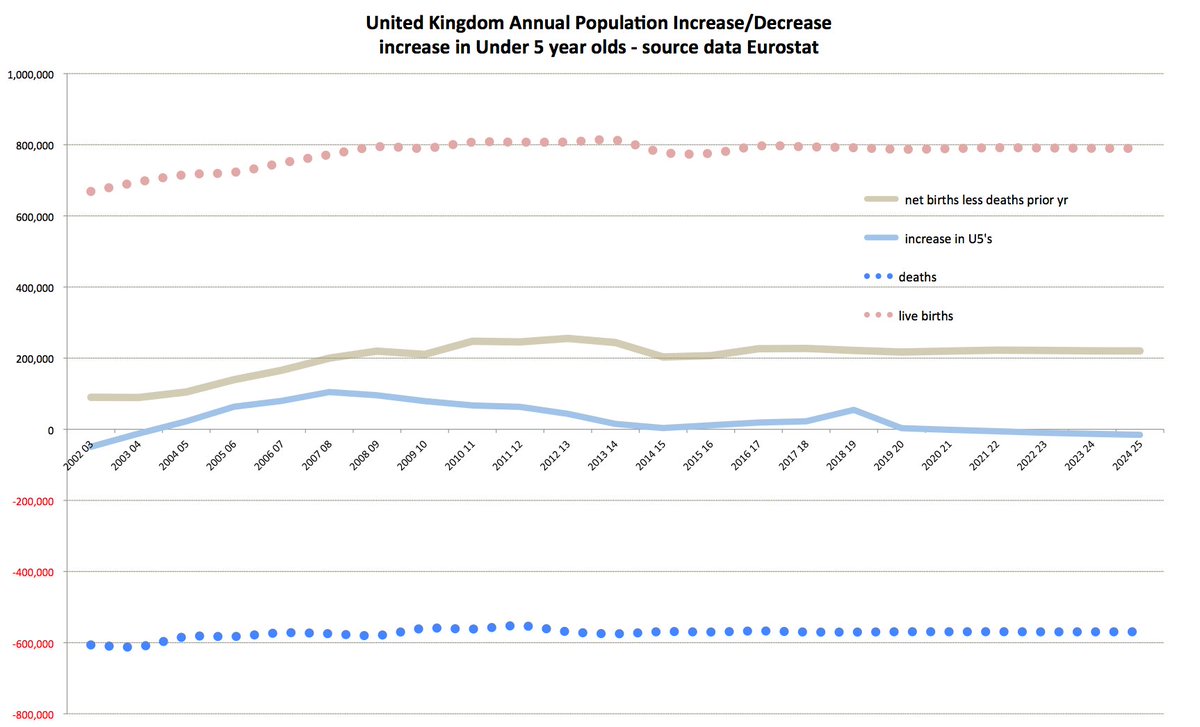
6. Are there any stresses elsewhere in the population profile, maybe under 5's? The profile follows the birth rate between 2002 - 2007 and then flattens out. It's 500,000 extra nursery school places over a 7 year period, so 25,000 nursery classrooms and 60,000 teachers/carers.
7. If we look at the U15 cohort as a whole we can see that the millennial baby boom added in around 1.5 million U15's (including the U5's) so a further 40,000 classrooms and 60-80,000 extra teachers.
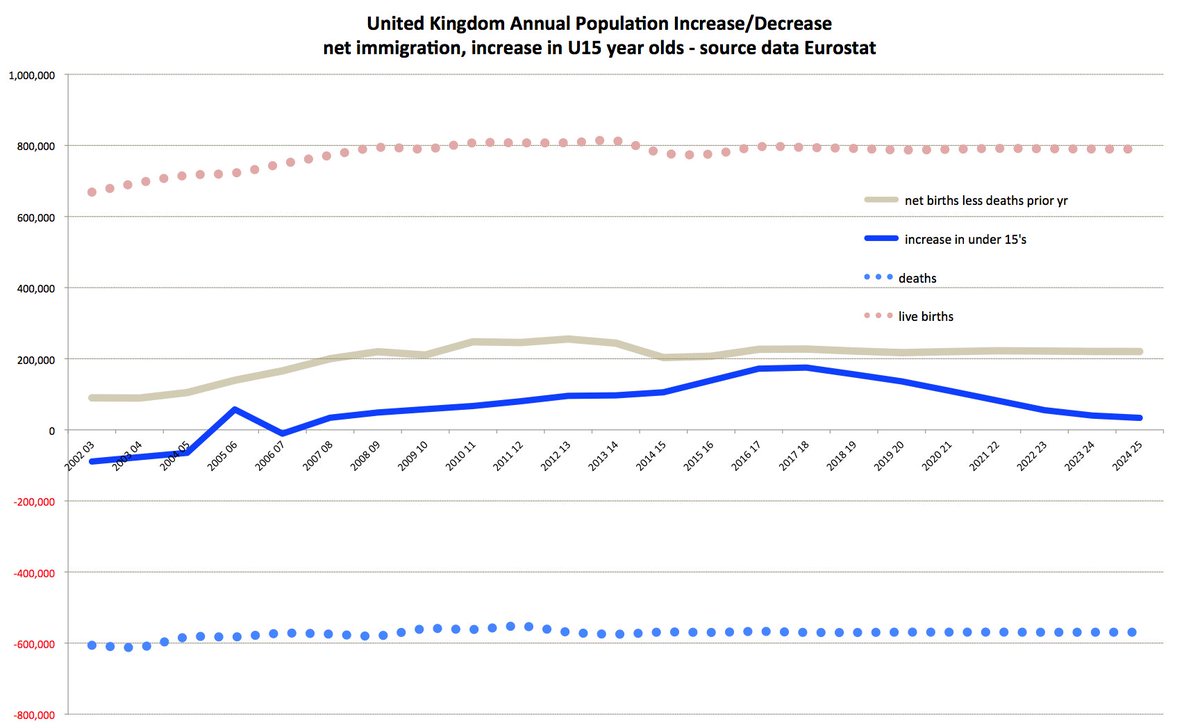
8. So we have an internal UK population demand for aged carers, pre-natal carers, infant carers, teachers & construction workers to build classrooms, healthcare facilities, hospitals and care homes.
So how was that demand met?
So how was that demand met?
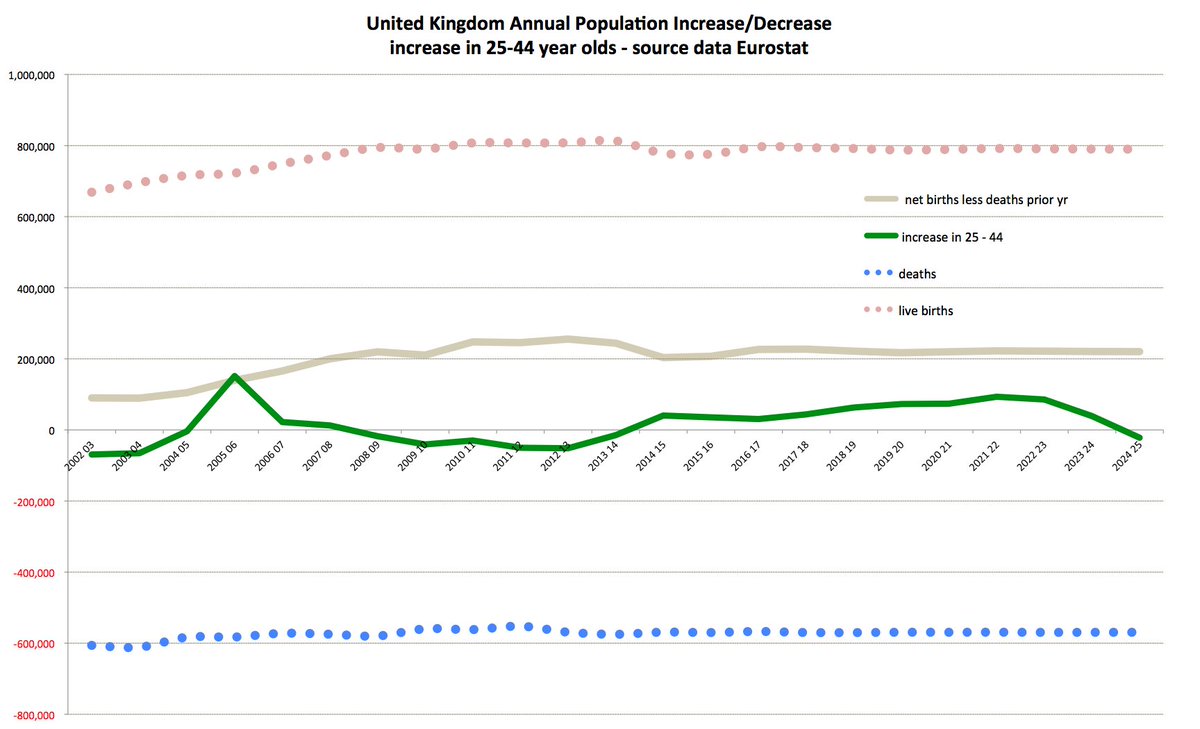
9. In the 25-44 year old cohort we see a spike in 2005 following the 2003 Treaty of Accession which allowed many Eastern Europeans to come & build our schools & hospitals for us. The spike is short-lived but will have also contributed to an increase in the U15 numbers.
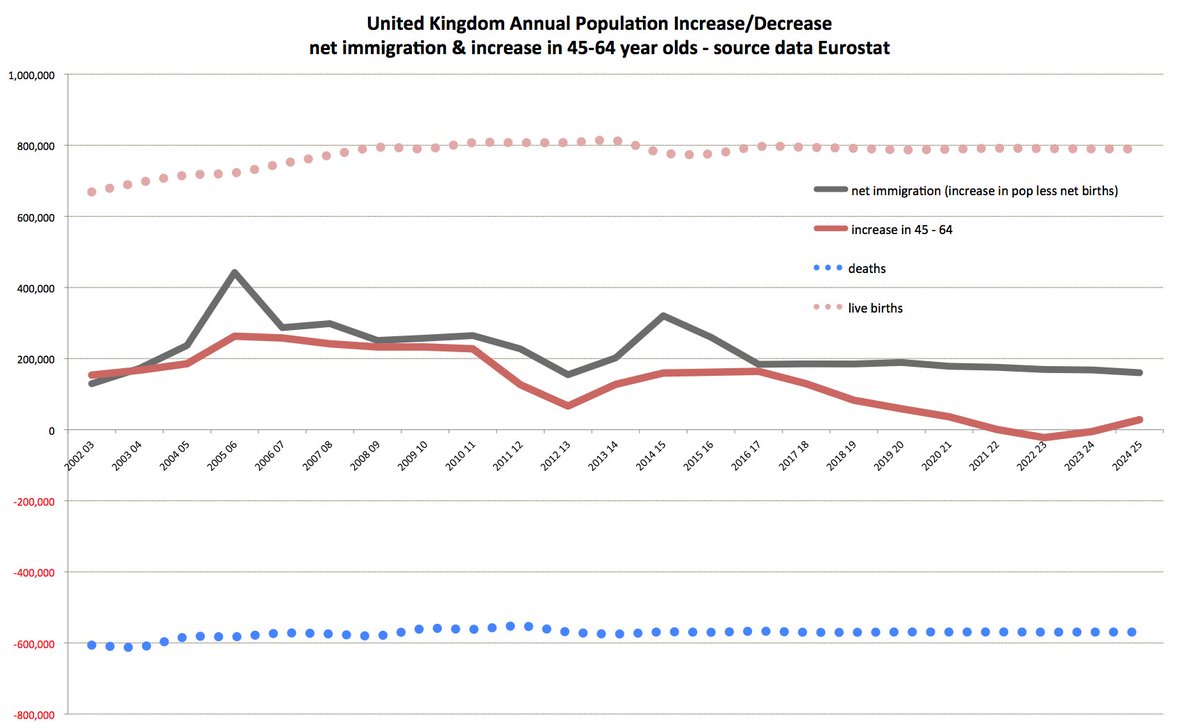
10. The major contribution to meeting the demand created by the millennial boom & the ageing population is to be found within the 45-64 year olds. It's on their broad shoulders that the UK economy is borne.
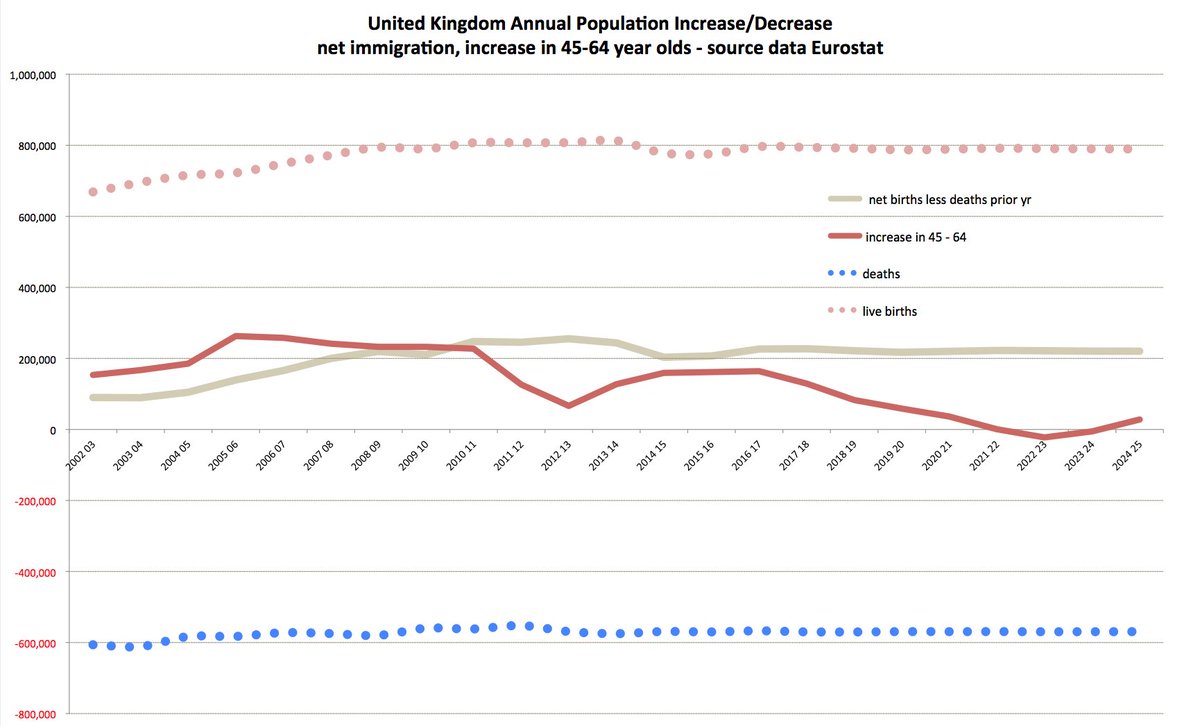
11. When we compare the profile of the 45-64 year olds with the net immigration profile it tells the story of how we owe a deep debt of gratitude to our immigrating friends who came to help meet the demand we created, helping to look after our elderly & our children. /Ends