,
10 tweets,
5 min read
Read on Twitter
Will Chinese CO₂ emissions peak before the pledged 2030?
Quite possibly, according to a new study, but "other estimation techniques could give different results. You need to look at many such analyses & triangulate.” says @jikorsbakken
THREAD 1/
carbonbrief.org/chinas-emissio…
Quite possibly, according to a new study, but "other estimation techniques could give different results. You need to look at many such analyses & triangulate.” says @jikorsbakken
THREAD 1/
carbonbrief.org/chinas-emissio…
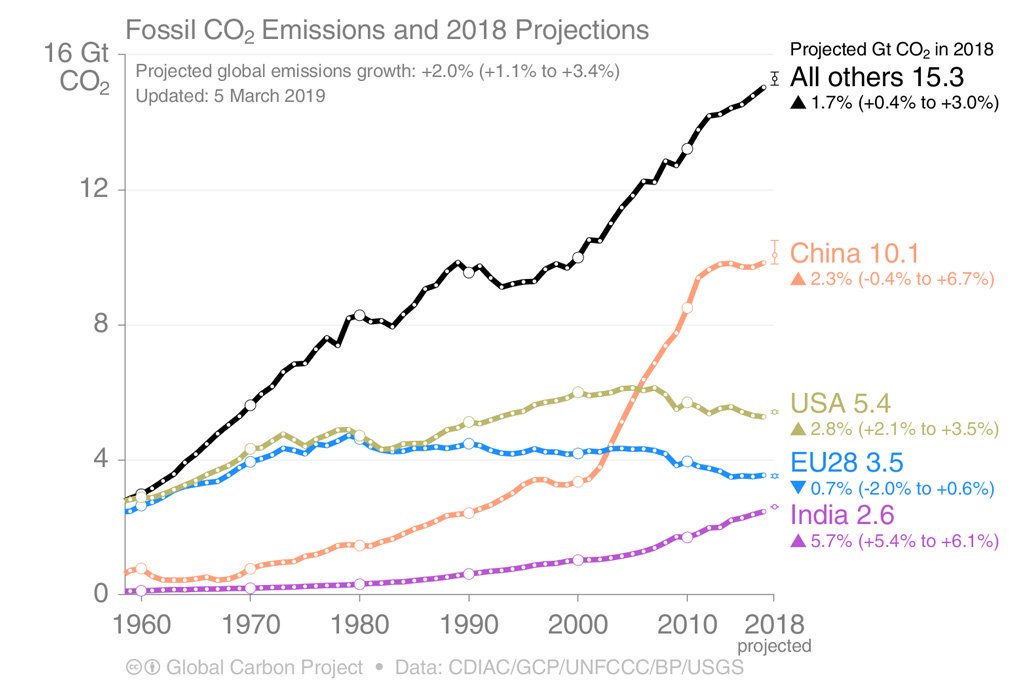
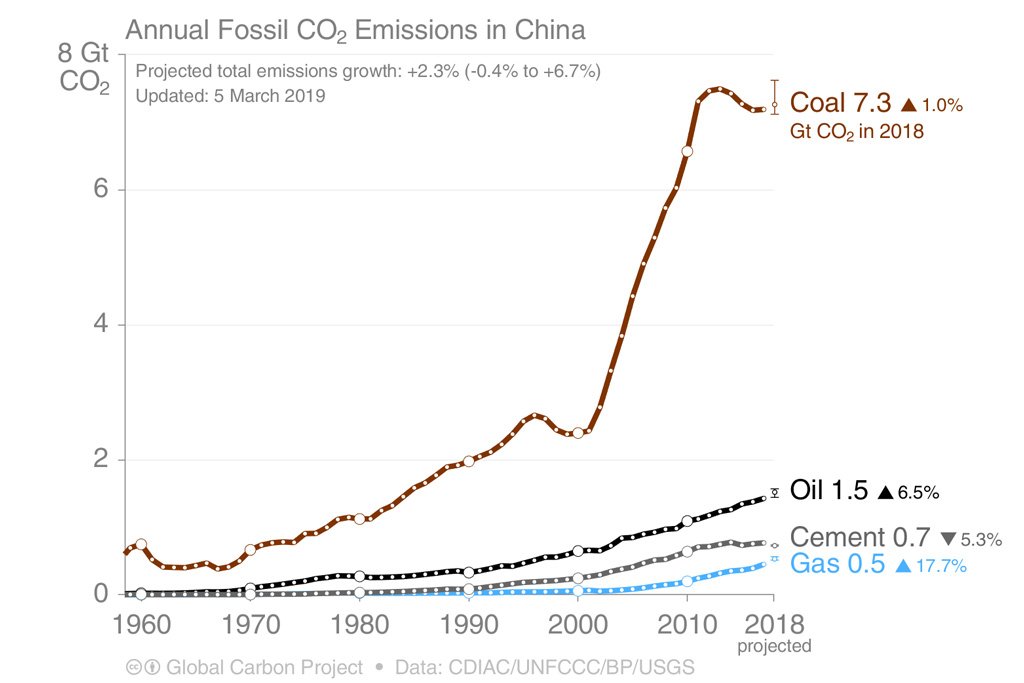
Chinese emissions looked to have peaked in 2013, but that looks highly unlikely with growth now returning at 1-2%/yr.
The ups & downs are driven by coal, often related to credit availability (infrastructure), with oil & gas growing handsomely...
2/
carbonbrief.org/guest-post-chi…
The ups & downs are driven by coal, often related to credit availability (infrastructure), with oil & gas growing handsomely...
2/
carbonbrief.org/guest-post-chi…
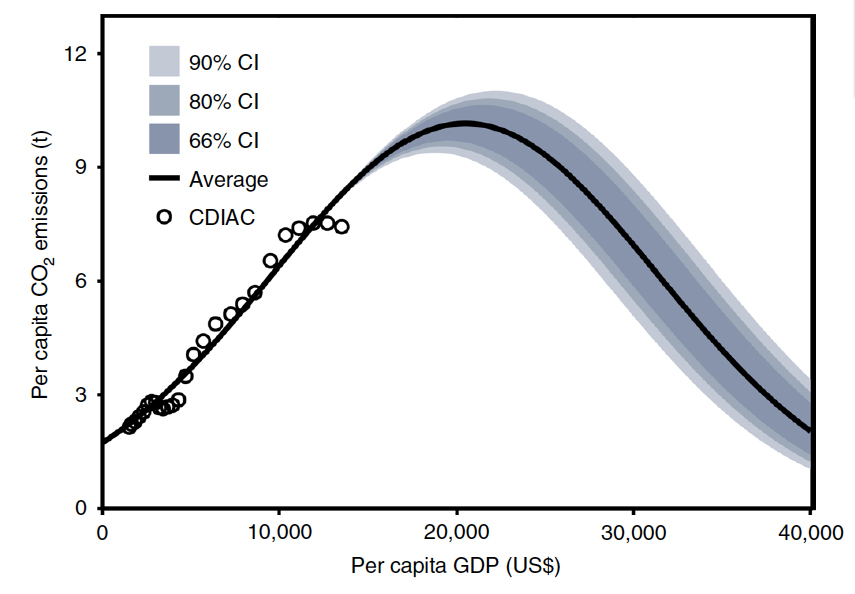
A new study looks at the characteristics & growth of 50 Chinese cities, arguing they exhibit an Environmental Kuznet's Curve (peak in CO₂/capita vs GDP/capita), & project CO₂ emissions for all of China assuming an EKC & find a peak in 2021-2025.
3/
rdcu.be/bMGo4
3/
rdcu.be/bMGo4
Sounds plausible & many argue for a peak 2020-2025.
But "At some point, you run out of places to move heavy industry & power plants" @jikorsbakken, implying not all of China can follow the same EKC structure as some cities.
4/
carbonbrief.org/chinas-emissio…
But "At some point, you run out of places to move heavy industry & power plants" @jikorsbakken, implying not all of China can follow the same EKC structure as some cities.
4/
carbonbrief.org/chinas-emissio…
As an aside, there is a significant literature on EKCs.
Summary: Many studies show an EKC for local pollutants (SO₂), but for energy & global pollutants (CO₂) the case is more complex.
Having said that, if we keep <2°C, all countries will exhibit an EKC for CO₂...
5/
Summary: Many studies show an EKC for local pollutants (SO₂), but for energy & global pollutants (CO₂) the case is more complex.
Having said that, if we keep <2°C, all countries will exhibit an EKC for CO₂...
5/
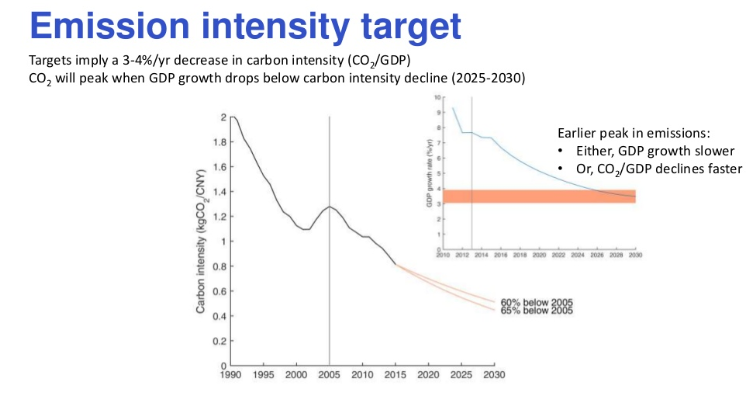
China has pledged to reduce CO₂ intensity 60-65% by 2030 (relative to 2005). CO₂ emissions will peak when GDP drops below the reductions in CO₂ intensity, that is expected as Chinese GDP growth slows.
Is a peak before 2030 business as usual?
6/
cicero.oslo.no/no/posts/klima…
Is a peak before 2030 business as usual?
6/
cicero.oslo.no/no/posts/klima…
Which comes back to GDP as a key factor for a CO₂ emissions peak
"[t]he Chinese economy is driven by credit & credit availability, ... determined by the central government ... the Chinese economy was going to slow down with or without a trade war".
7/
bbc.com/news/business-…
"[t]he Chinese economy is driven by credit & credit availability, ... determined by the central government ... the Chinese economy was going to slow down with or without a trade war".
7/
bbc.com/news/business-…
That is, Chinese CO₂ emissions might have peaked anyway.
In any case, while a peak is important, far more important is reducing emissions after the peak, which is far, far harder... 2°C pathways follow the grey area...
cicero.oslo.no/no/posts/klima…
8/
In any case, while a peak is important, far more important is reducing emissions after the peak, which is far, far harder... 2°C pathways follow the grey area...
cicero.oslo.no/no/posts/klima…
8/
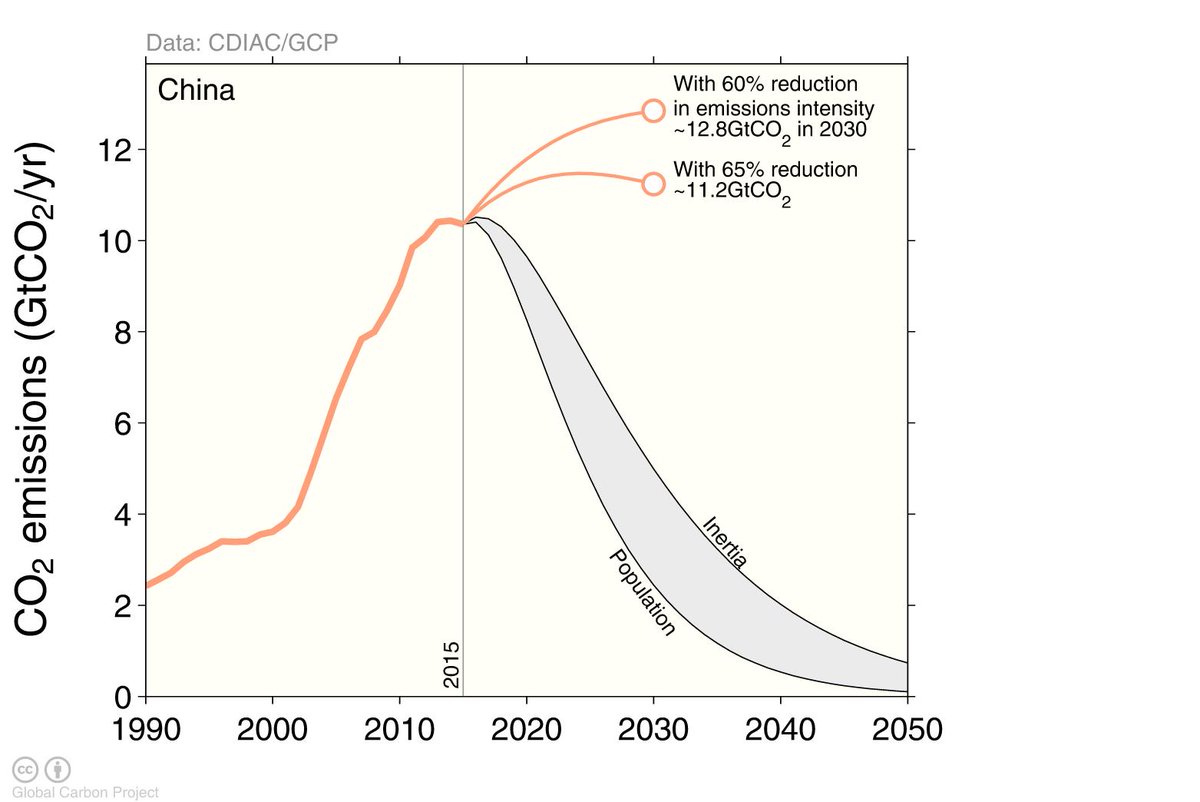
It is worth noting, the study suggests a peak of "13–16 GtCO₂/yr between 2021 & 2025". That is over ~20% over today's level, which in itself is quite extreme growth... I would expect very low growth leading to a plateau & decline (like the US or EU).
9/
9/

Disclosure.
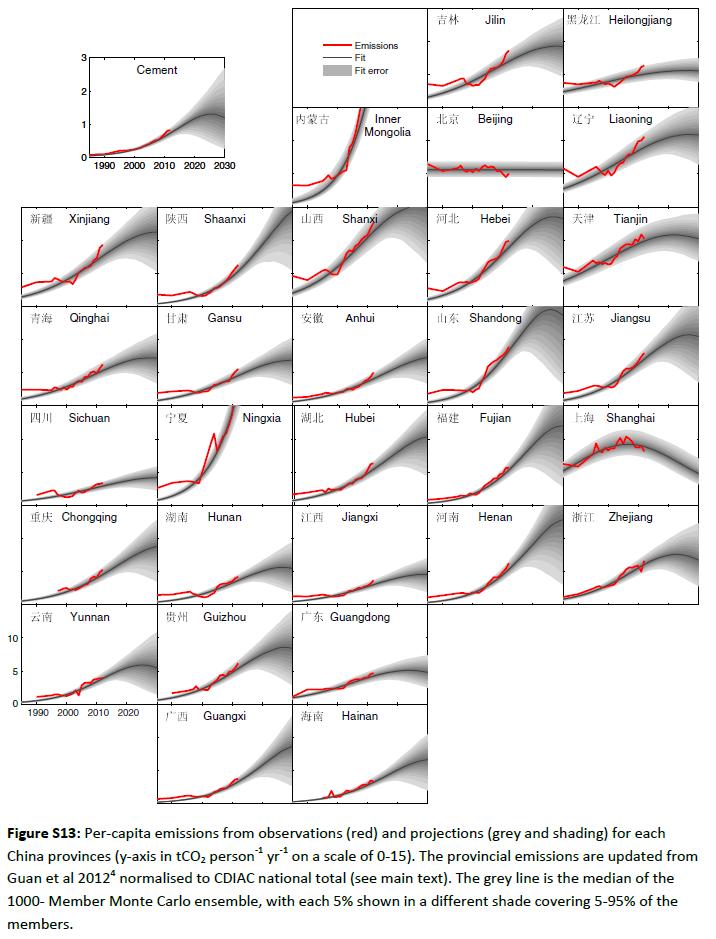
We (@gcarbonproject) tried to publish a study using a similar approach a few years back, but constantly rejected... Reviewers were not convinced of the statistics!
Figure shows CO₂ emissions per capita as a function of time (by province).
10/10
We (@gcarbonproject) tried to publish a study using a similar approach a few years back, but constantly rejected... Reviewers were not convinced of the statistics!
Figure shows CO₂ emissions per capita as a function of time (by province).
10/10