,
10 tweets,
4 min read
Read on Twitter
Good morning ☁️🌧️ - it is cloudy outside like the gloomy global manufacturing outlook. In case u missed it, US ISM went into contraction at 49.1 - so US exceptionalism no more. We are all synchronizing downward for manufacturing.
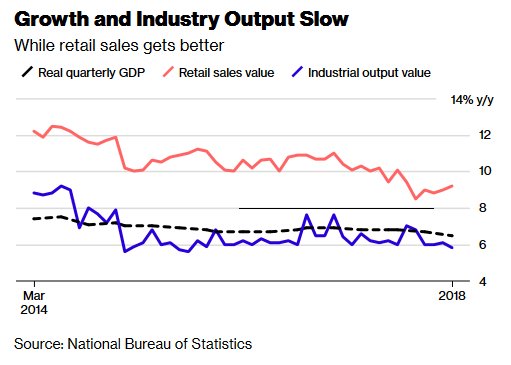
Where are we? WE ARE HERE 👇🏻👇🏻 - GLOBAL SLOWDOWN
Where are we? WE ARE HERE 👇🏻👇🏻 - GLOBAL SLOWDOWN

Who is contracting (below 50 is contracting from previous month):
🇺🇸US ISM manu 49.1
🇨🇳China at 49.5 for state (somehow Caixin is positive but likely down soon so don't get excited)
🇪🇺EU 47
🇹🇼Taiwan 47.9
🇯🇵Japan 49.2
🇮🇳India 49
🇰🇷South Korea 49
🇲🇾Malaysia 47.4
🇻🇳Vietnam 51.4
🥶
🇺🇸US ISM manu 49.1
🇨🇳China at 49.5 for state (somehow Caixin is positive but likely down soon so don't get excited)
🇪🇺EU 47
🇹🇼Taiwan 47.9
🇯🇵Japan 49.2
🇮🇳India 49
🇰🇷South Korea 49
🇲🇾Malaysia 47.4
🇻🇳Vietnam 51.4
🥶
On for 3 segments today on Bloomberg & will start w/ postmortem of US ISM manu. Let's look at details (all ugly & showing contraction of manufacturing).
New orders, production, employment, imports & exports, prices all down 👇🏻👇🏻👇🏻
New orders, production, employment, imports & exports, prices all down 👇🏻👇🏻👇🏻

9 sectors still growing: Textile Mills; Furniture; Food & Bev; Wood Products; Petroleum & Coal Products; Nonmetallic Mineral Products; Machinery; Miscellaneous Manufacturing; & Chemical Products.
People cite tariffs, Brexit, & supply chain key challenges esp for ELECTRONICS 👇🏻👇🏻
People cite tariffs, Brexit, & supply chain key challenges esp for ELECTRONICS 👇🏻👇🏻

Sectors w/ DECLINING ORDERS👉🏻: Apparel, Leather & Allied Products; Paper; Wood; Transportation Equipment; Textile Mills; Fabricated Metal Products; Petroleum & Coal Products; Plastics & Rubber Products; Primary Metals; Miscellaneous Manufacturing; & Computer & Electronic Products
If u want to understand what is going on, then it has to do w/ China massive role in the US manufacturing production in terms of intermediates (tariffs so far on intermediate goods or inputs for manu production & latest 1 Sept are consumer goods). Producers ABSORB a lot of costs.

That chart tells u that the impact for the US of trade-war is heavily burdening PRODUCERS (pay for the inputs & also tariffs) - both on the Chinese & US side. Likely that Chinese exporters reduce costs to keep orders & also US producers absorbing costs.
US consumers OK so far👈🏻.
US consumers OK so far👈🏻.
Second thing chart shows u is that for China, unless the gov steps up to absorb costs of tariffs, the COSTS ARE DIRECTLY TO CONSUMERS as the biggest tariffed portions are essentials: FOOD & LIVE ANIMALS.
So food CPI in China rises on shortage of pork & also higher TARIFFS 👈🏻.
So food CPI in China rises on shortage of pork & also higher TARIFFS 👈🏻.

This chart also tells u that this is a massive amount of imports affected by tariffs (A LOT OF CAPITAL GOODS) & so it will create a lot of friction to manufacturing activities esp in sectors like machinery & electronics.
Firms'll reshuffle & diversify but hard in the short-term.
Firms'll reshuffle & diversify but hard in the short-term.

Implication is that what you are seeing now will not look like this in the future as this is a STATIC chart using data from 2018 trade & so in 2019, 2020, 2021 etc that will change.
That is key to the regional supply chain etc. Sorry I gotta run. See you on air 👋🏻🤗
That is key to the regional supply chain etc. Sorry I gotta run. See you on air 👋🏻🤗