,
19 tweets,
6 min read
Read on Twitter
Did u know that while China GDP was 13.1trn & the US is 20.4trn, China imported almost as much as the US & more than the Euro zone in 2018? This is why the decline of Chinese demand is consequential. Imports in 2018:
🇺🇸 2.6
🇨🇳 2.1
🇪🇺 2
Look at China's 2015 dip. 2019'll dip too!
🇺🇸 2.6
🇨🇳 2.1
🇪🇺 2
Look at China's 2015 dip. 2019'll dip too!

Why did I put this up? We know that 2019 imports by China have DECLINED ytd. Data out on 8 September for August & likely to be DOWN. This is why Chinese consumers pack a punch -> they buy a lot more than the US & Euro zone as a share of GDP (export a lot too).
What do they buy?
What do they buy?
So based on what we know so far the dip of Chinese demand will look this this for 2019 👇🏻👇🏻👇🏻. OK, so what are they going to reduce in buying?
We know in 2018 58% was manufactured goods & 42% commodities (think oil, soybeans, food etc). What do u think is reduced this yr & next?
We know in 2018 58% was manufactured goods & 42% commodities (think oil, soybeans, food etc). What do u think is reduced this yr & next?

Don't have to guess -> we know the answer to this question. Ready? I'll tell u, China imported LESS:
a) FOOD (yes, trade-war retaliation hurts food supply)-> this explains higher food prices in China as can't offset Swine disease w/ imports
b) AlCOHOL (mostly 🍷)
c) MOST MANU 😱
a) FOOD (yes, trade-war retaliation hurts food supply)-> this explains higher food prices in China as can't offset Swine disease w/ imports
b) AlCOHOL (mostly 🍷)
c) MOST MANU 😱
WHAT IS UP?
a) Fruits & vegies (yay! healthy!) & seafood (not so good for cholesterol & sea animals)
b) Vegie oil (yay for Malaysia 🇲🇾)
c) Iron ore (yay for Australia 🇦🇺) & copper (yay Mongolia 🇲🇳)
d) Oil & natural gas
a) Fruits & vegies (yay! healthy!) & seafood (not so good for cholesterol & sea animals)
b) Vegie oil (yay for Malaysia 🇲🇾)
c) Iron ore (yay for Australia 🇦🇺) & copper (yay Mongolia 🇲🇳)
d) Oil & natural gas
Just so u know, MOST MANU IS ABYSMALLY SAD. Now you know why South Korea is languishing as Chinese demand for its goods is down a lot!!!
A couple things for electronics are up though, like electric watches, medical products & things to purify air/water etc.
Health conscious👈🏻
A couple things for electronics are up though, like electric watches, medical products & things to purify air/water etc.
Health conscious👈🏻
Anyway, thread ends. That -4% contraction of imports masks HOW BIG THE DECLINE IS FOR MANUFACTURING IMPORTS. We know it is big because big manufacturers in the region are LANGUISHING (Germany doing badly too).
Btw, food prices up in China so at some pt it needs to import more👈🏻
Btw, food prices up in China so at some pt it needs to import more👈🏻
Omgosh, I just figured out how to download a lot of data on Bloomberg. The new CEIC figuration really sucks so I'm moving to using Bloomie full time. Thank u IT help desk!!!
Okay, want to know the biggest contributor to growth of imports (ytd is -4.4%YoY)? LIQUIDFIED NATURAL GAS
A yay for Russia? 🇷🇺 That is a +1.08 percent contribution to growth of total imports. BASICALLY EVERYTHING ELSE IS EPIC BAD ESP AUTOS & SEMICONDUCTOR (Korea)
A yay for Russia? 🇷🇺 That is a +1.08 percent contribution to growth of total imports. BASICALLY EVERYTHING ELSE IS EPIC BAD ESP AUTOS & SEMICONDUCTOR (Korea)

So basically without liquefied gas import, then Chinese imports would be A LOT WORSE!!! Look at the good contribution to import growth? Basically nothing ex LNG!!!

K, closing @Trinhnomics shop. I published a note btw. If you have Bloomie, type N Natixis Research Trinh Nguyen GO
Guys, let me share this with u so u can see it clearer what is happening. Chart below is China GLOBAL MARKET SHARE for its EXPORTS & IMPORTS.
We know that China dominates global manufacturing (19% of total world exports); Also know China dominates GLOBAL IMPORTS OF COMMODITIES👇🏻
We know that China dominates global manufacturing (19% of total world exports); Also know China dominates GLOBAL IMPORTS OF COMMODITIES👇🏻

If u're a commodity person, u're a China expert. Why? Because u want to know if it is still buying ~900bn of commodities per year. That is a lot b/c I just showed u its GLOBAL MARKET SHARE OF IMPORTS.
This is what economists call a PRICE MAKER. It dictates global market prices.
This is what economists call a PRICE MAKER. It dictates global market prices.

For Chinese factories to churn out manufactured goods, it needs to import commodities. A lot of commodities. In order to feed everyone in China, it needs to import food. To make a pig, it needs soybeans etc. This is why China went to Latin America, Australia, Africa-> Commodities

So to understand the US/ China trade-war, Asian supply chain, impact of it on Asia, we need to just know this fundamental fact: what China imports is ABSOLUTELY ESSENTIAL for its production. It already turned inward for manufacturing as it vertically integrates the supply chain.
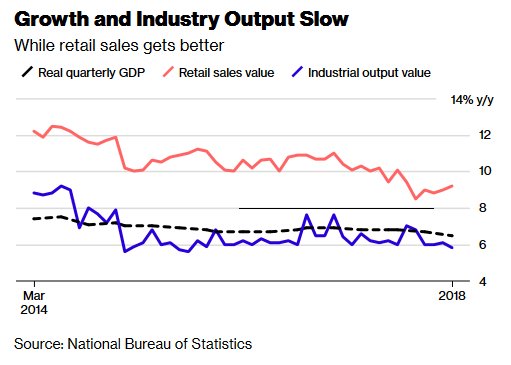
So when u see CPI in China going up higher than in the US (China is 2.8% so 1% higher than the US despite PPI deflated & oil prices LOW) despite the fact that China EXPORTS MORE TO THE US than its IMPORTS from the US. Look at the chart below 👇🏻. China imports mostly ESSENTIALS👇🏻

Chart of divergence of CPI👇🏻. If u understand the structure of China's imports from the world, u'd also know that in the future, who won't do well. Let me give u a hint, the rest of Asia that competes w/ China for manufactured goods, such as South Korea.
Study the CPI chart👇🏻
Study the CPI chart👇🏻

Here is an explanation of that CPI divergence b/n the US & China despite the tariffs that @realDonaldTrump puts on China is MUCH MORE than what China has retaliated.
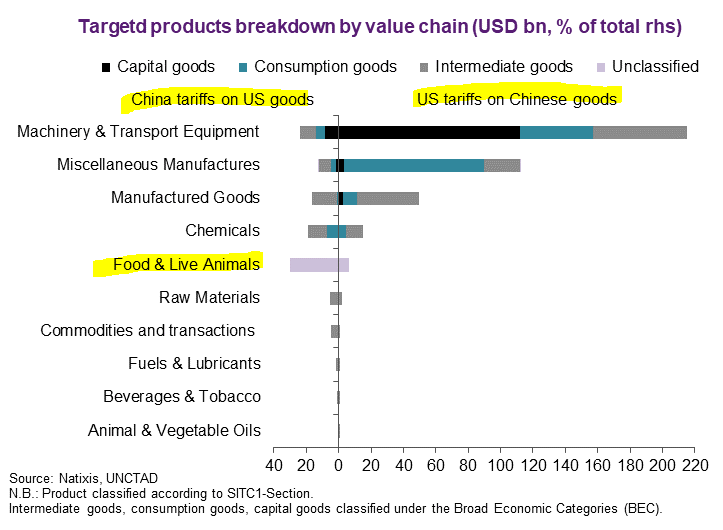
Why? ESSENTIALS VS DISCRETIONARY.
Look at China tariffs on US: What's the BIGGEST? FOOD & LIVE ANIMALS. Yep,🐷👈🏻
Why? ESSENTIALS VS DISCRETIONARY.
Look at China tariffs on US: What's the BIGGEST? FOOD & LIVE ANIMALS. Yep,🐷👈🏻
@realDonaldTrump Key pts:
*Trade data is awesome 😍
* China imports matter b/c MASSIVE (yes, almost as big as the US & bigger than the Euro zone)
* Specifically China imports of high-tech + commodities
* Bad news - China imports DOWN & esp for manufacturing
* Not good for Asian exporters 😱👈🏻👈🏻
*Trade data is awesome 😍
* China imports matter b/c MASSIVE (yes, almost as big as the US & bigger than the Euro zone)
* Specifically China imports of high-tech + commodities
* Bad news - China imports DOWN & esp for manufacturing
* Not good for Asian exporters 😱👈🏻👈🏻