🇬🇧🗳️ Résultats presque définitifs des élections au #RoyaumeUni :
Conservateurs 43,6% (+1,2) / 363 élus (+47)
Travaillistes 32,2% (-7,8) / 203 élus (-59)
LibDems 11,5% (+4,2) / 11 élus (-1)
SNP 3,9% (+0,8) / 48 élus (+13)
Conservateurs 43,6% (+1,2) / 363 élus (+47)
Travaillistes 32,2% (-7,8) / 203 élus (-59)
LibDems 11,5% (+4,2) / 11 élus (-1)
SNP 3,9% (+0,8) / 48 élus (+13)
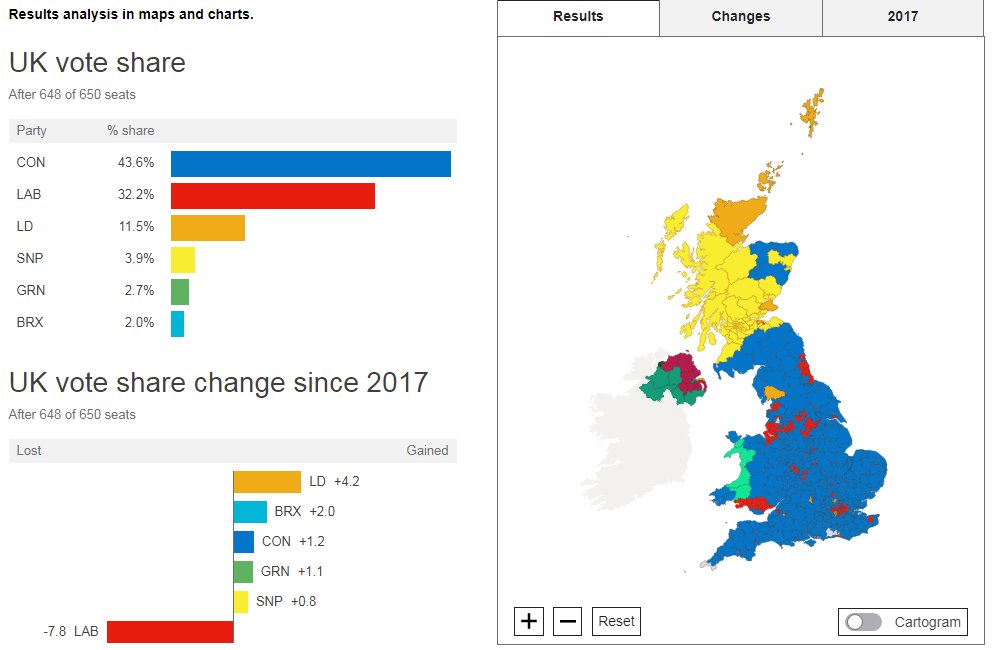
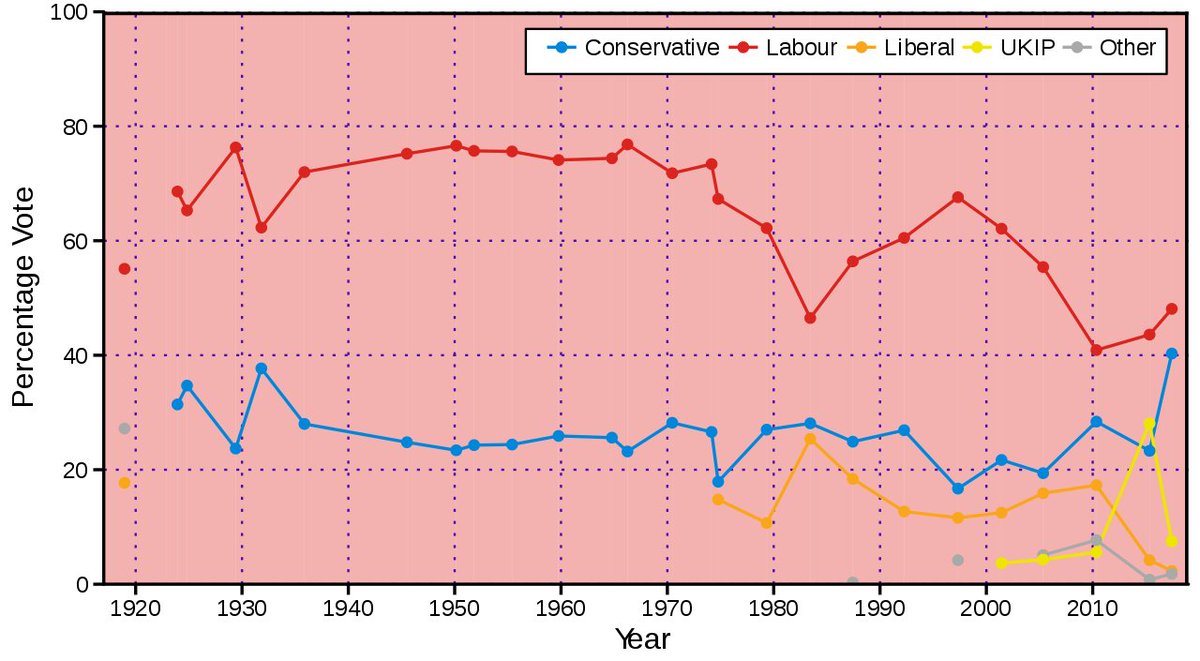
🇬🇧🗳️ En termes de voix, c'est la meilleure performance des conservateurs depuis 1979.


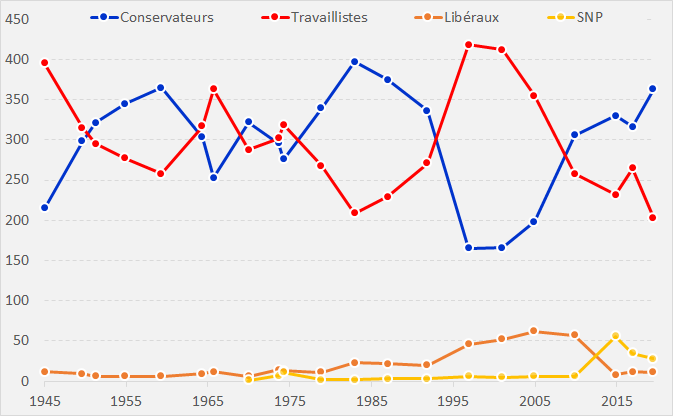
🇬🇧🗳️ En termes d'élus, les conservateurs obtiennent leur groupe aux Communes le plus important depuis 1987, et les travaillistes ont au contraire le plus faible nombre d'élus depuis... 1935. La remontée en voix des LibDems ne se traduit pas par des gains en députés.
🇬🇧🗳️ Sur cette cartes des circonscriptions ayant basculé hier, on voit immédiatement :
➡️ l'ampleur des gains conservateurs dans le nord de l'#Angleterre, bastion traditionnel du travaillisme ouvrier
➡️ l'ampleur des gains du SNP en #Ecosse
➡️ l'ampleur des gains conservateurs dans le nord de l'#Angleterre, bastion traditionnel du travaillisme ouvrier
➡️ l'ampleur des gains du SNP en #Ecosse
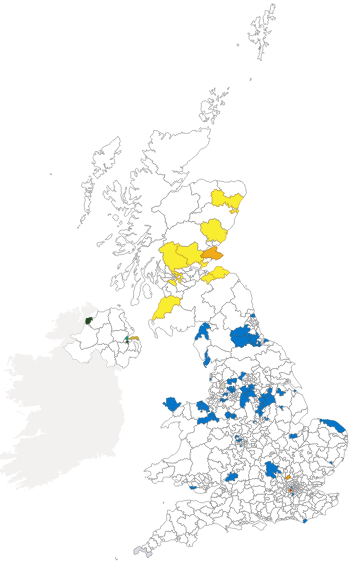

🇬🇧🗳️ Du coup, les travaillistes perdent dans le nord de l'#Angleterre des circonscriptions qu'ils contrôlaient sans discontinuité depuis 1945 voire 1918, et elles votent parfois pour la première fois conservateur depuis la mi-XIX siècle...
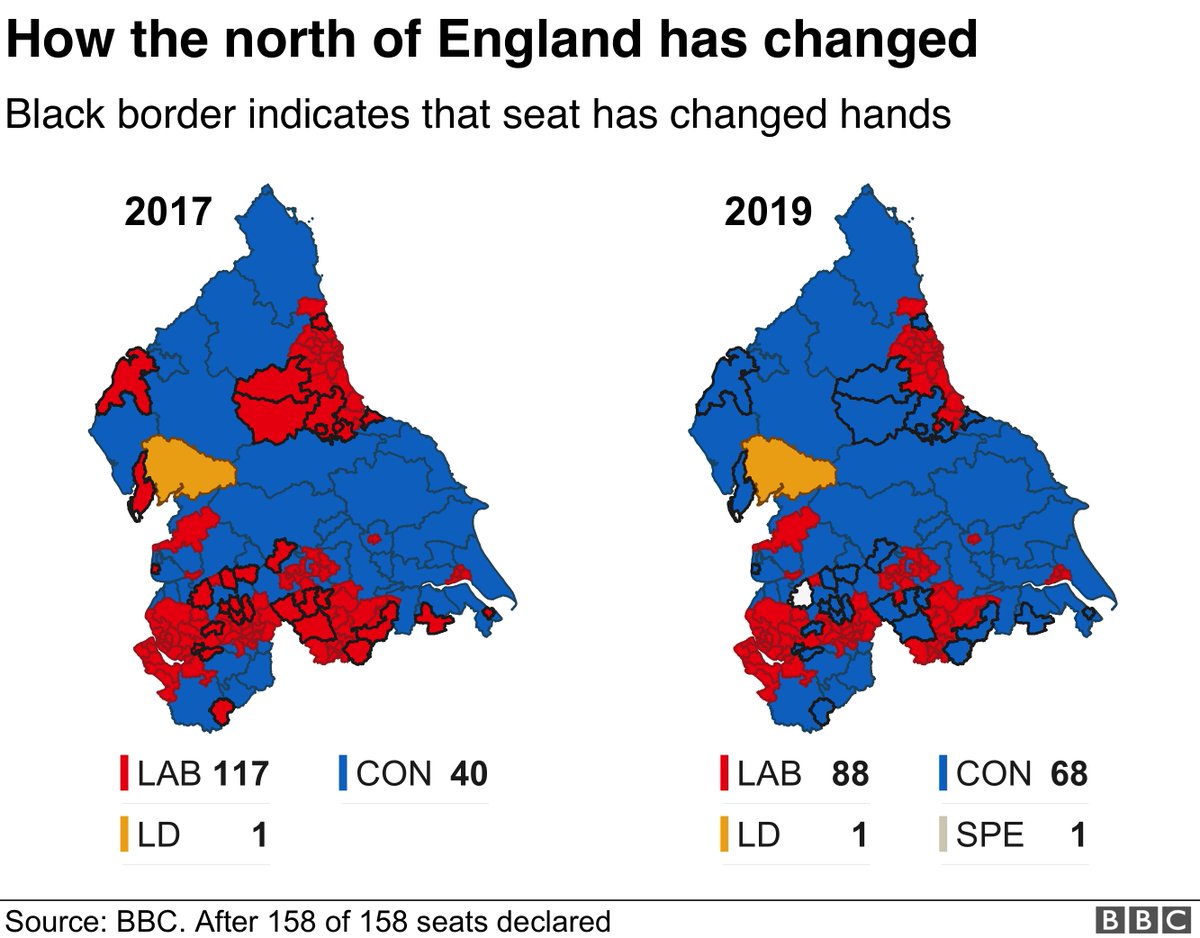
🇬🇧🗳️ Un exemple, la circonscription de #RotherValley, qui vote travailliste sans discontinuer depuis 1918 (et qui votait libéral précédemment) : le candidat conservateur y obtient 45% des voix (+5), soit 13 pts d'avance sur le candidat travailliste (32%, -16).
🇬🇧🗳️ Un exemple qui montre qu'il ne faut pas lire ces résultats électoraux qu'à travers le prisme du #Brexit : dans la circonscription très pro-#Remain de #Cheltenham (56% en 2016), le sortant conservateur se maintient au pouvoir. Et c'est loin d'être la seule circo dans ce cas.
🇬🇧🗳️ Plus les circonscriptions étaient populaires, plus les gains conservateurs ont été importants.
🇬🇧🗳️ Après, la tendance générale à l'affaiblissement de la gauche dans l'électorat populaire se retrouve dans quasiment tous les pays, même dans ceux où on ne parle pas de sortir de l'UE et où on a des leaders sociaux-démocrates centristes.
🇬🇧🗳️ Il faut relire cet article de @PippaN15 où elle se demandait si les élections britanniques allaient être l'occasion d'un réalignement de grande ampleur. blogs.lse.ac.uk/politicsandpol…

@PippaN15 🇬🇧🗳️ A ceux qui - comme à chaque scrutin - ressortent le mantra de l'échec catastrophique des sondages.
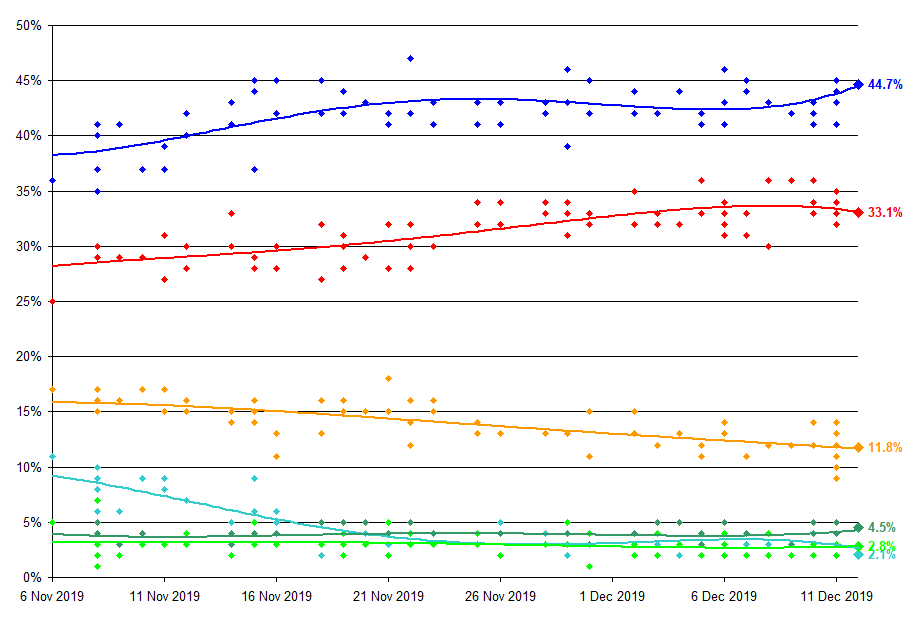
@PippaN15 🇬🇧🗳️ C'est donc la sixième élection d'affilée que le score en voix des conservateurs progresse. Il ne doit pas y avoir beaucoup d'exemples de la sorte.
1997 - 31.5%
2001 - 32.7%
2005 - 33.2%
2010 - 37.0%
2015 - 37.8%
2017 - 43.5%
2019 - 44.7%
1997 - 31.5%
2001 - 32.7%
2005 - 33.2%
2010 - 37.0%
2015 - 37.8%
2017 - 43.5%
2019 - 44.7%
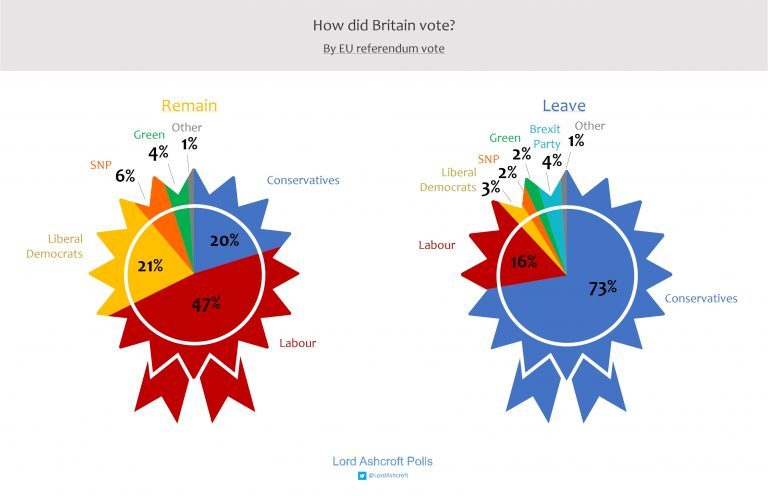
@PippaN15 🇬🇧🗳️ Selon l'enquête de @LordAshcroft menée hier auprès de 13 000 Britanniques, ce n'est pas tant les défections d'électeurs travaillistes pro-#Leave qui ont coûté tant de sièges au Labour qu'un maintien finalement assez moyen dans sa base pro-#Remain (84%).
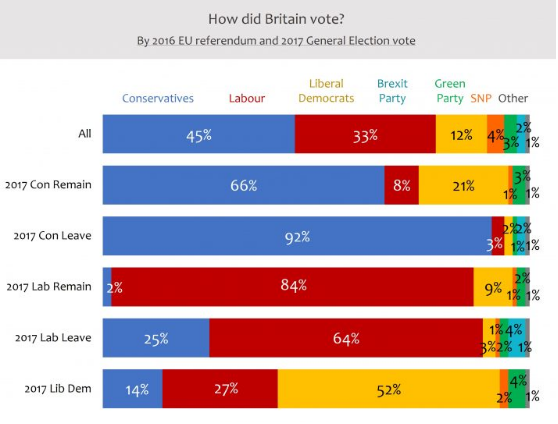
@PippaN15 @LordAshcroft 🇬🇧🗳️ Au total, 73% des électeurs #Leave de 2016 ont voté conservateur, alors que moins de la moitié des électeurs #Remain ont voté travailliste. Une histoire de consolidation électorale unilatérale, donc. v/@LordAshcroft

Pourquoi le Labour a-t-il perdu alors que son programme économique était largement populaire ? Parce que ce programme n'était pas jugé crédible, parce que l'image de Corbyn était mauvaise, parce que les électeurs ne votent pas qte sur l'économie.
yougov.co.uk/topics/politic…
yougov.co.uk/topics/politic…
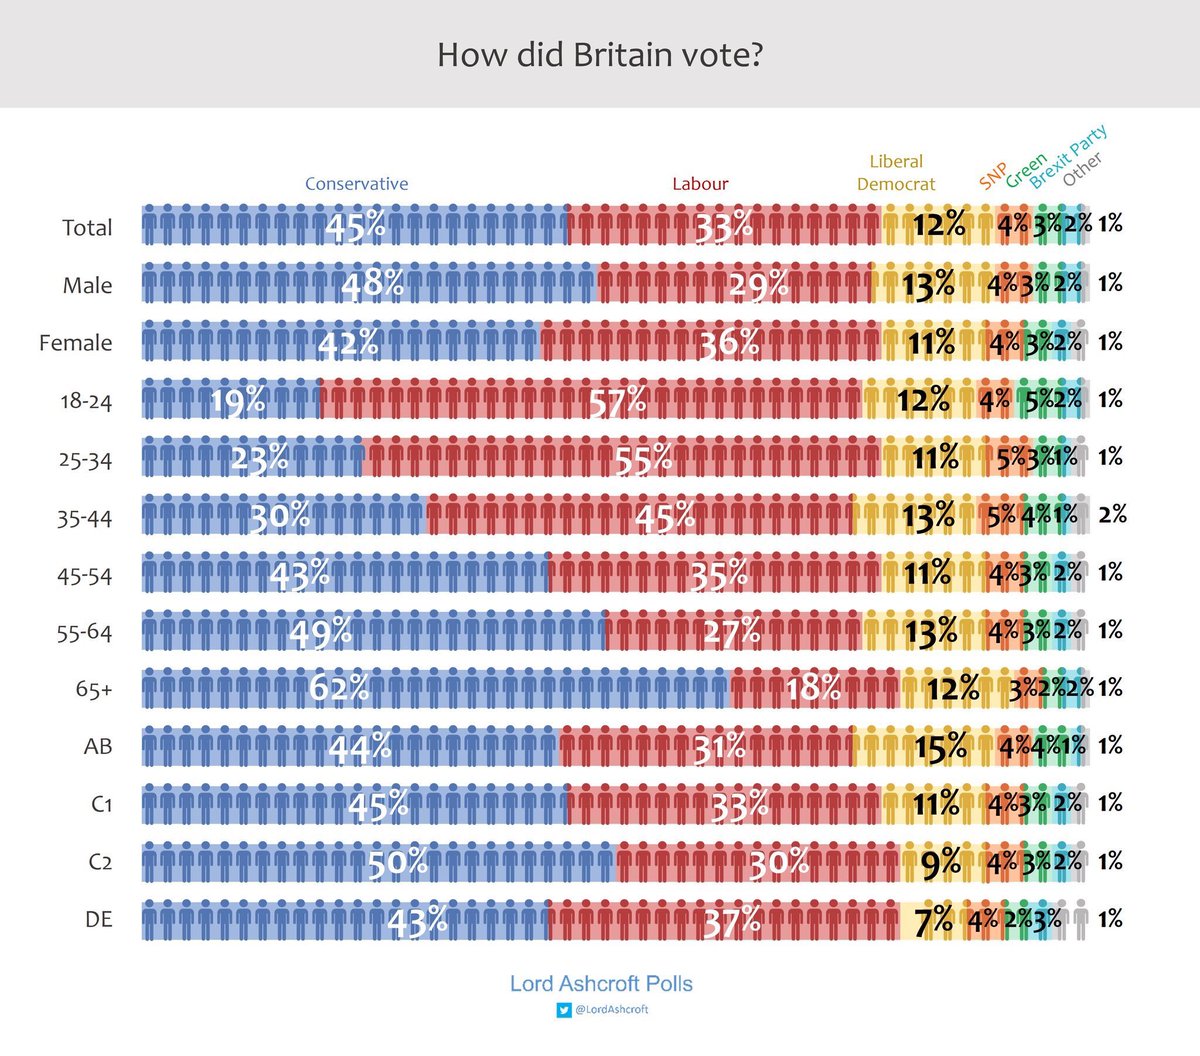
🇬🇧🗳️ Le vote selon les caractéristiques socio-démographiques (v/@LordAshcroft) :
➡️ Comme en 2017, un clivage générationnel massif
➡️ Les conservateurs obtiennent leur meilleur score chez les C2 (travailleurs qualifiés), une de leur base traditionnelle
➡️ Comme en 2017, un clivage générationnel massif
➡️ Les conservateurs obtiennent leur meilleur score chez les C2 (travailleurs qualifiés), une de leur base traditionnelle