I'm about to launch at ten part thread on making #maps of #Coronavirus. Hang on to your #COVID19 facemasks 0/10 
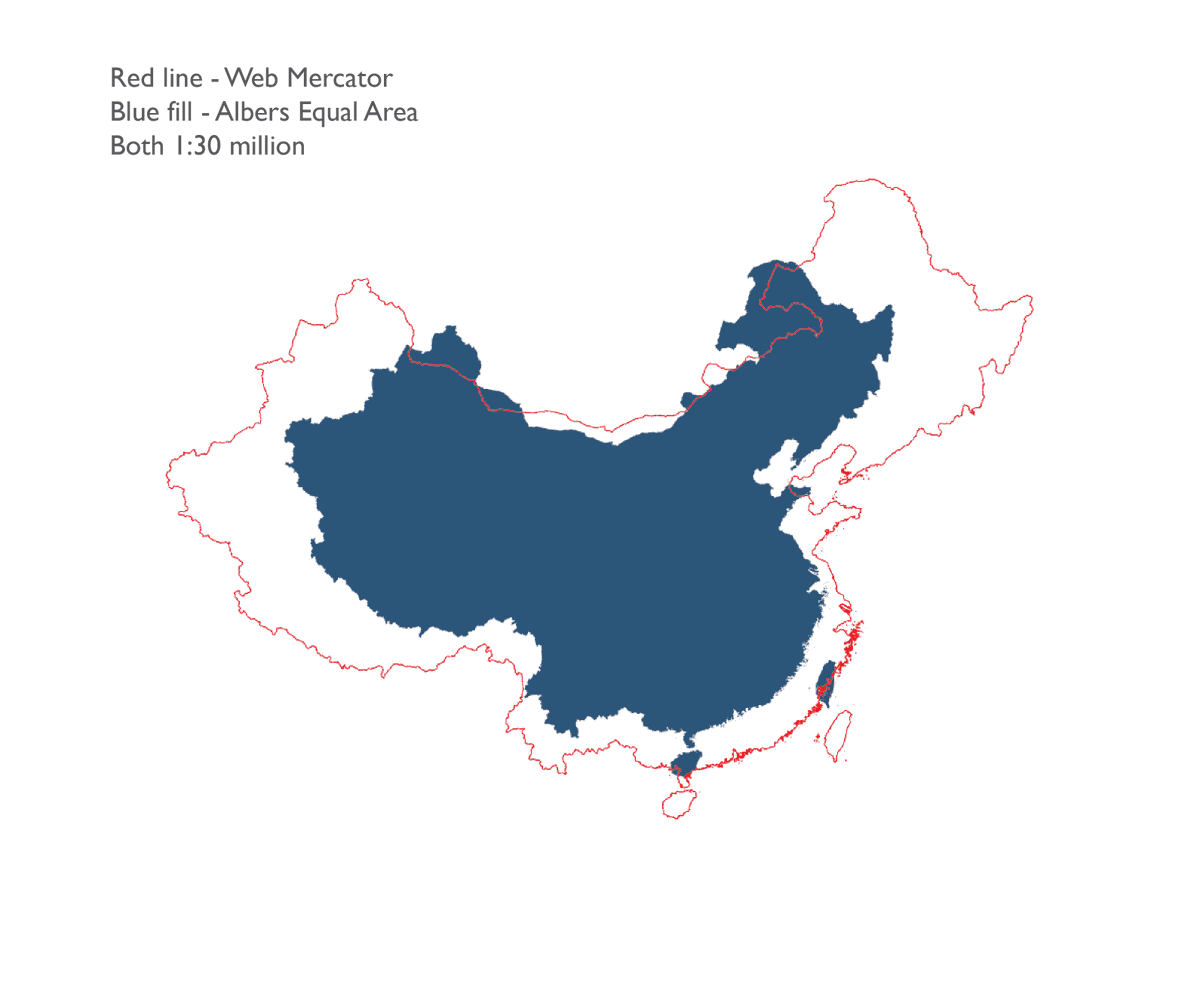
Coronavirus map tips 1/10 use an appropriate #projection. It's for #thematic data so needs to be equal area. Web Mercator does not support the map's purpose. Distortions lead to people over- or under-estimating size of areas relative to one another.
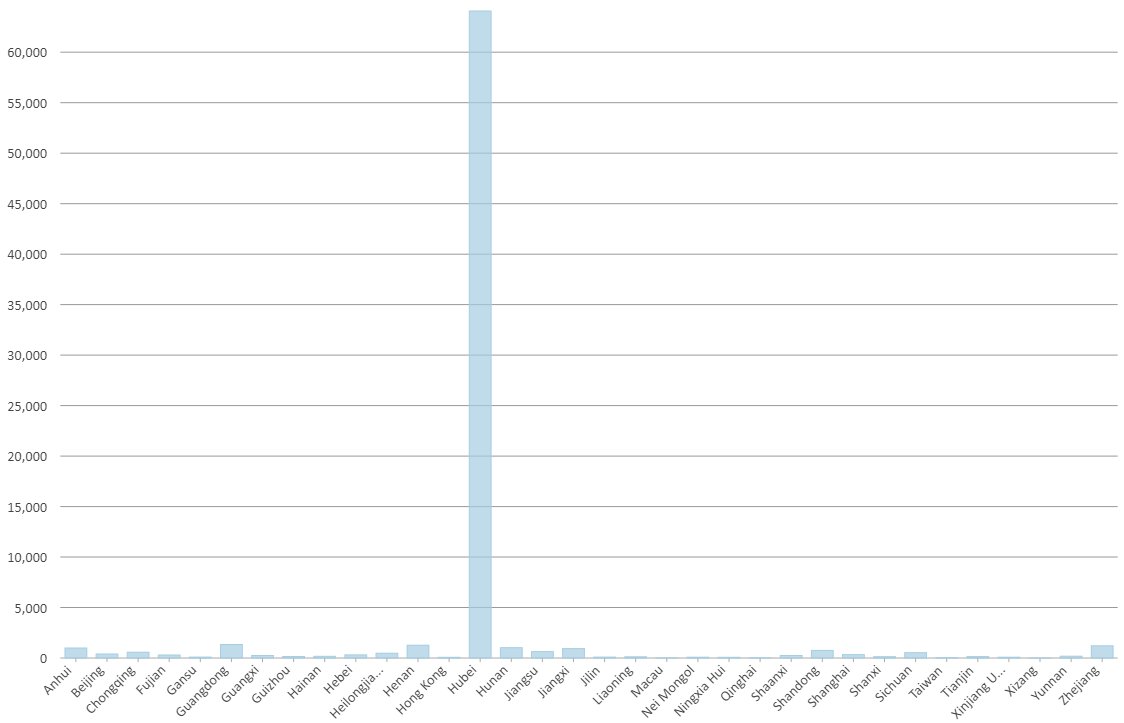
Coronavirus map tips 2/10 don't map totals on a #choropleth. Impact of differently sized regions & population densities makes comparison between areas meaningless. Totals can heighten fear. 65,000 seems an awful lot. Do 5 provinces really belong in the same upper data class?

Coronavirus map tips 3/10 explore the data distribution before classifying the data. #Hubei Province is a massive outlier. All other regions are below 1,000 cases. Maybe consider a bar chart rather than a map, but eitherway, take this knowledge to the map.
Coronavirus map tips 4/10 use appropriate colours. Red is never a good colour for health-related data. Connotates danger/death which is extremely rare for #coronavirus. Single hue colour scheme highlights outlier, don't conflate it with other distant data values. No rainbows.
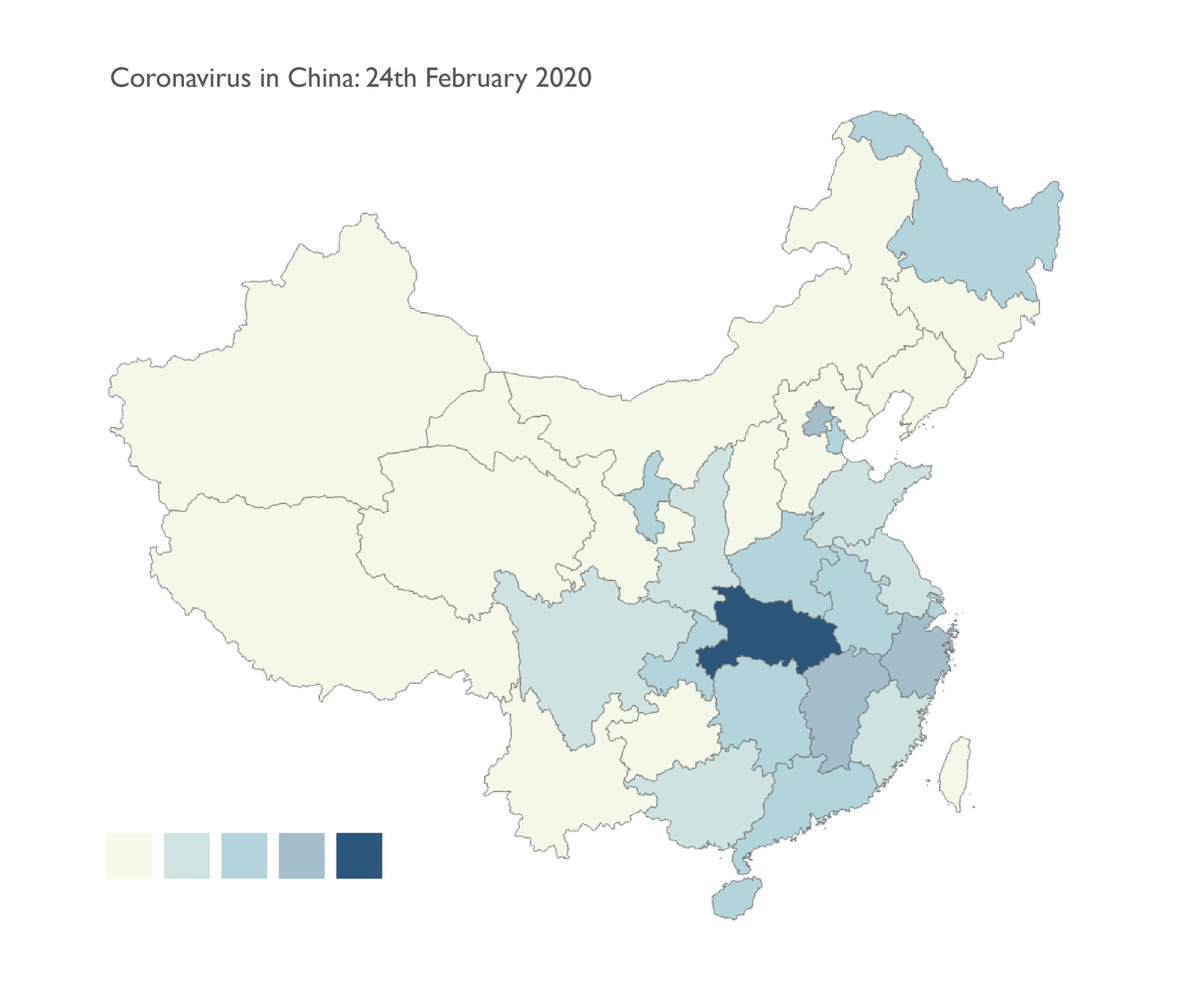
Coronavirus map tips 5/10 use per capita. Normalize the map to support comparison, 10 cases in a city of 100,000 way different to 10 in a town of 100. Hubei has 111 cases per 100,000. Every other region has less than 3 cases per 100,000. The map should reflect that disparity.

Coronavirus map tips 6/10 consider dot density as an alternative. Mapping totals is automatically converted to a visual density that aids comparison. Downside is some might infer a dot = an individual case, and Hubei seems to be completely overwhelmed. A note clarifies.

Coronavirus map tips 7/10 proportional symbols work well. They allow you to see Hong Kong, and Macau which are otherwise hidden on a choropleth or dot density map. Except if linearly scaled all regions bar Hubei are the same small symbol size.

Coronavirus map tips 8/10 consider a logarithmic scale for defining proportional symbol size. You gain far more variation in symbol sizes across the map, though visually you run the risk of over-emphasizing small values. Avoid overlaps.

Coronavirus map tips 9/10 please don't make an ectoplasmic 'heat map'. Makes absolutely no sense to interpolate data from points, and worse if you don't control the bandwidth properly. Doesn't identify Hubei as the epicentre. Rainbow colours top off this excruciatingly poor map.

Coronavirus map tips 10/10 please don't make a 3D prism map on a spinny globe. Gratuitous viz. Just because you can doesn't mean you should. Adds nothing. Hard to interpret relative data values. Occlusion etc etc.

Coronavirus map tips 11/10 no viz. Words & numbers.
Hubei has 111 cases per 100,000 people (0.1% of population).
Everywhere else in China is less than 2 cases per 100,000 people.
For other countries reporting cases, the rate is even lower.
*caveat: based on reported numbers
Hubei has 111 cases per 100,000 people (0.1% of population).
Everywhere else in China is less than 2 cases per 100,000 people.
For other countries reporting cases, the rate is even lower.
*caveat: based on reported numbers