(1/) The @imperialcollege study by @MRC_Outbreak on #COVID19 is incredibly important. You should read it. How do their approaches and conclusions for the US compare to mine? tl;dr: they are very similar. More detail in the thread.
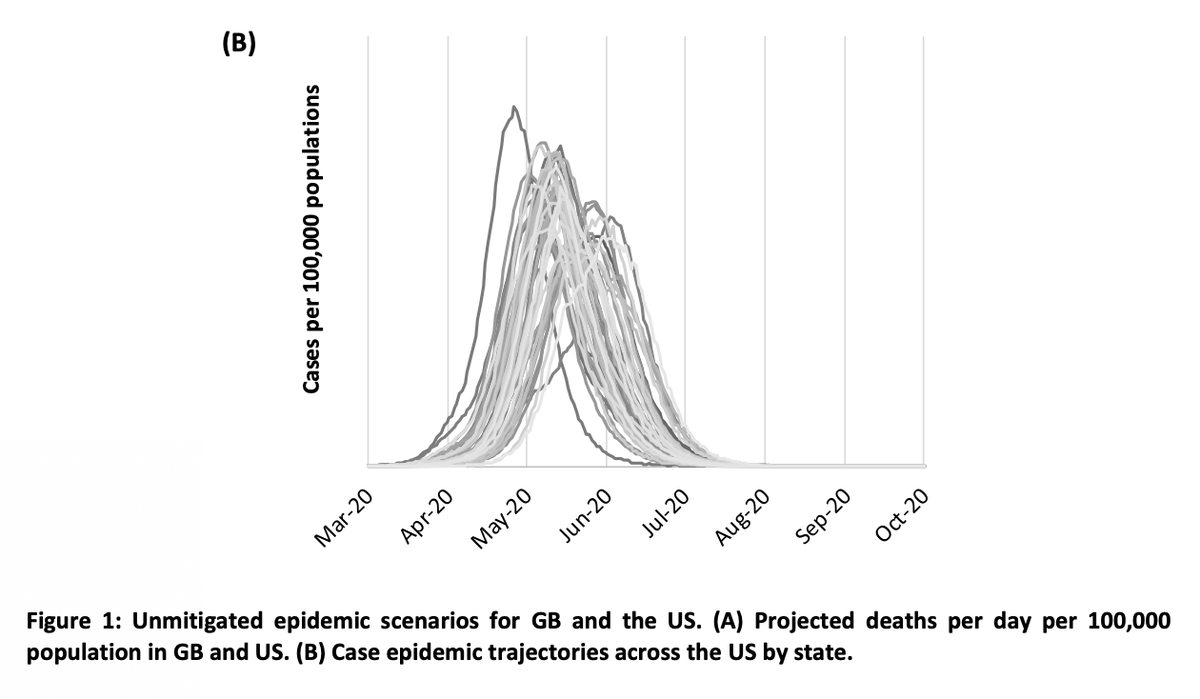
(2/) Comparing charts for overall deaths from their model and mine, you'll see that the Imperial College model finds that we stop adding significant numbers to the death count by mid July. My model puts that around June. Total Deaths - IC: 2.2M, My forecast: 1.2M 


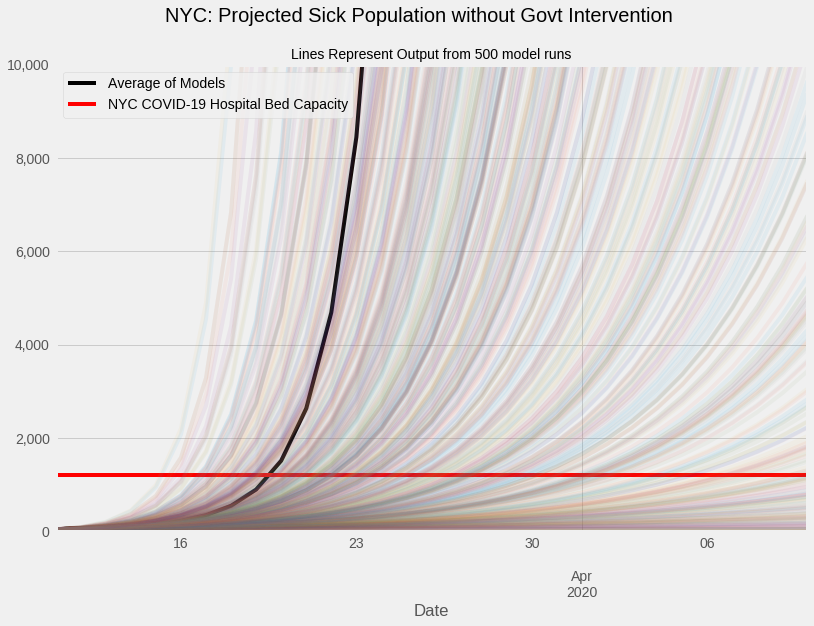
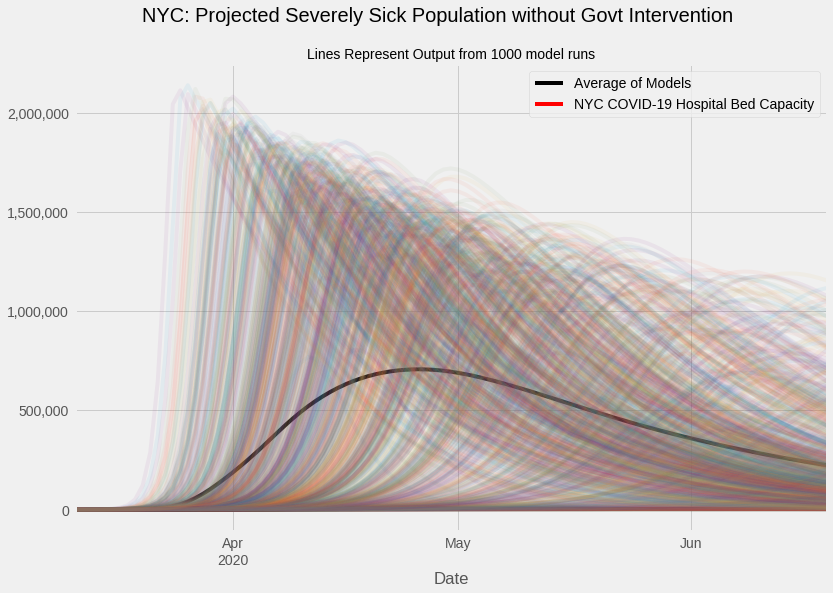
(3/) Without govt intervention: The IC study finds US cases peak in mid-May. My model peaks in late April.

(4/) Without govt intervention: The IC study expects 80% of the US to become infected. My model forecasts >95%.
(5/) The parameters of the models are very similar as well: The IC study uses a hospitalization rate of 4.4%. My model uses ~9%. For R0 and the serial interval, IC uses 2.4 and 5 days. I use 2.3 and 4.7 days, respectively.

(6/) Both models make similar adjustments for asymptomatic case rates, but the IC model takes a more sophisticated approach by reducing the asymptomatic transmission rate by 1/3.
(7/) These are two VERY different models and policymakers should be paying attention to the fact that they come to the same conclusions. In #forecasting, when very different models prepared by independent teams come to the same conclusion, our confidence in those conclusions rise
(8/) The IC #COVID19 study uses an agent-based modeling system that is very similar (but far more complex) to the one represented in this Washington Post viz. washingtonpost.com/graphics/2020/…
(9/) My model uses a classic SIR model described in further detail in my original medium post. As opposed to model the behavior of each person in the country, the classic model uses three populations: Susceptible, Infected, and Recovered (+deaths) medium.com/@donnellymjd/n…
(11/) What does this mean for the IC study's findings? As far as I'm concerned, I'm both impressed and convinced. They go about 10 steps beyond my approach and estimate the effects of policy responses. Policymakers should listen to their conclusions.
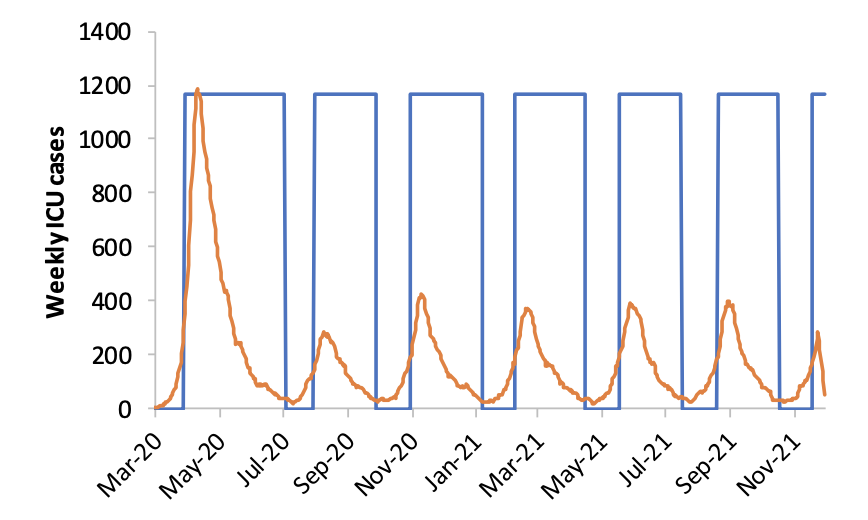
(12/) We will need overall population-wide social distancing in the short term to get #COVID19 under control in our countries. Then we need periodic releases and reimpositions of controls based on careful monitoring of ICU load/capacity. Continuing for 18 months or more.