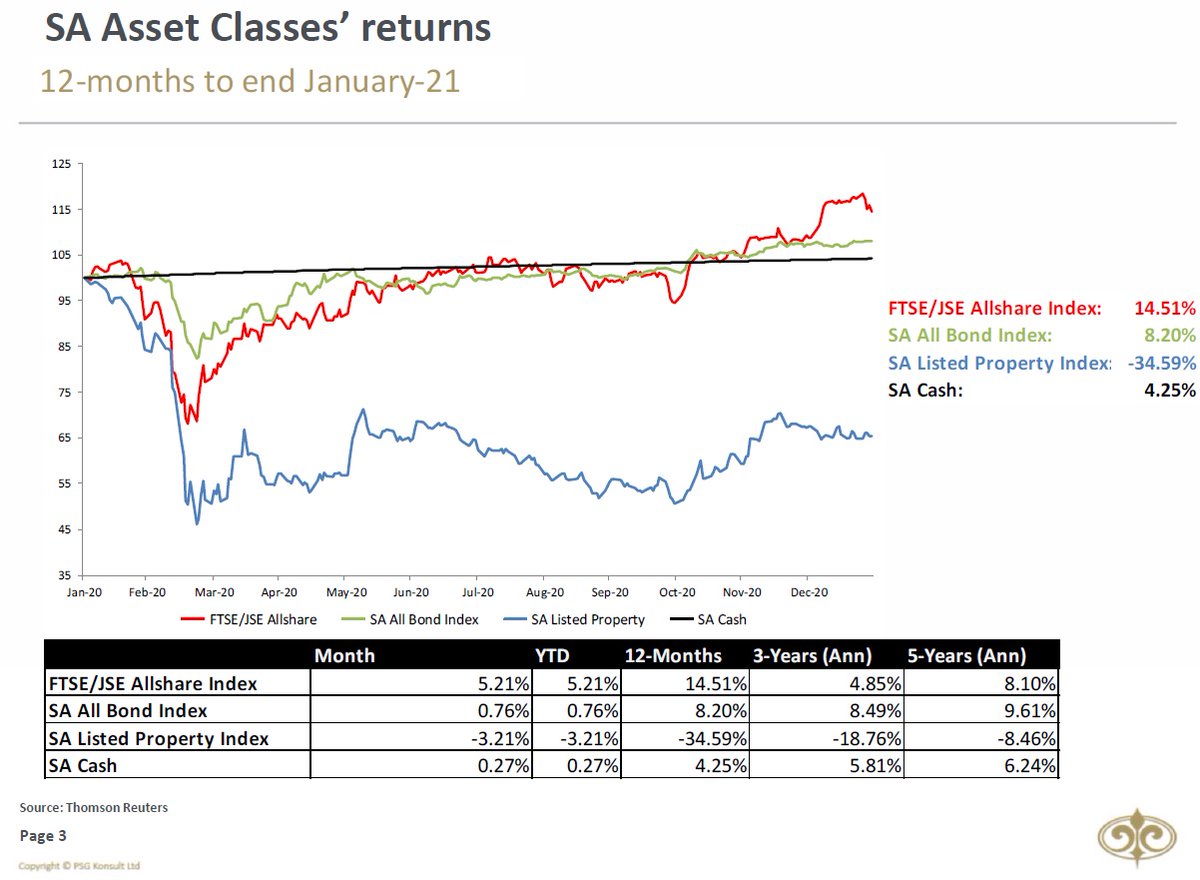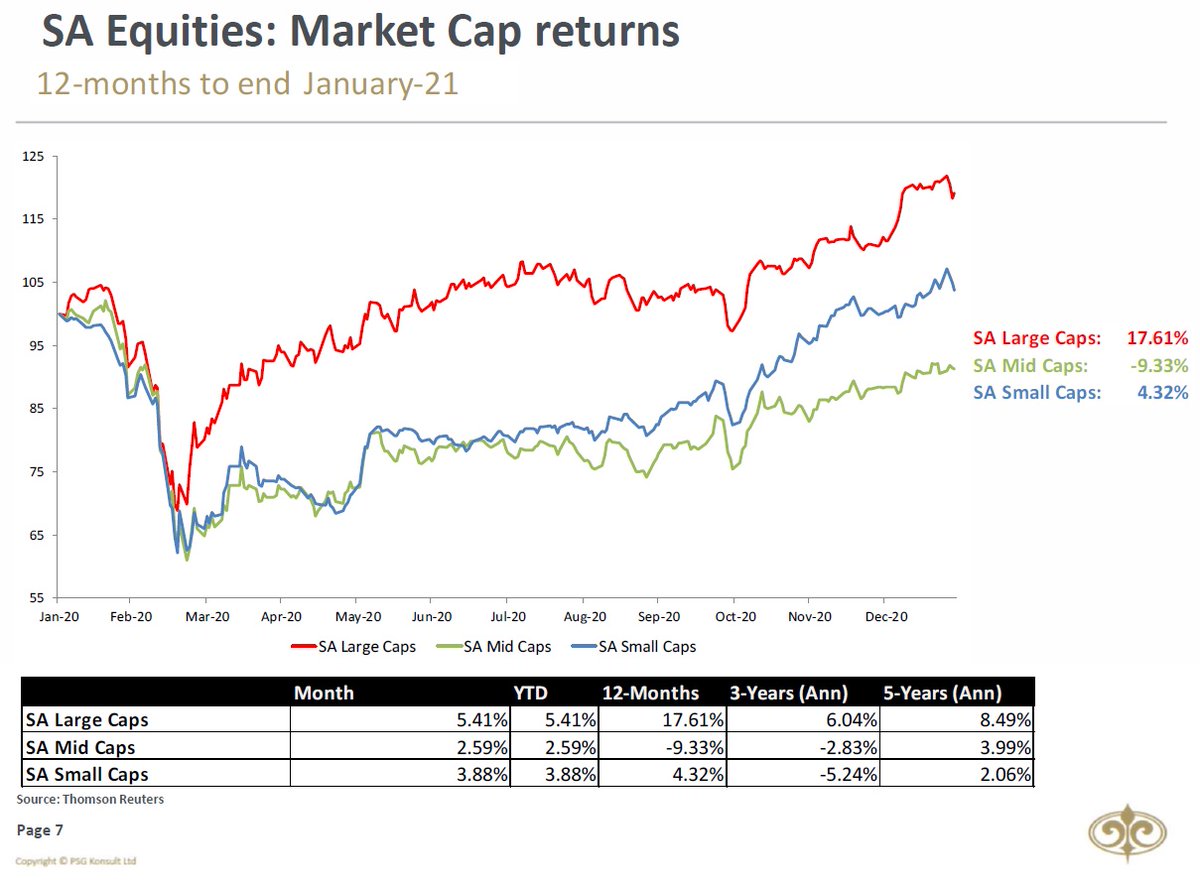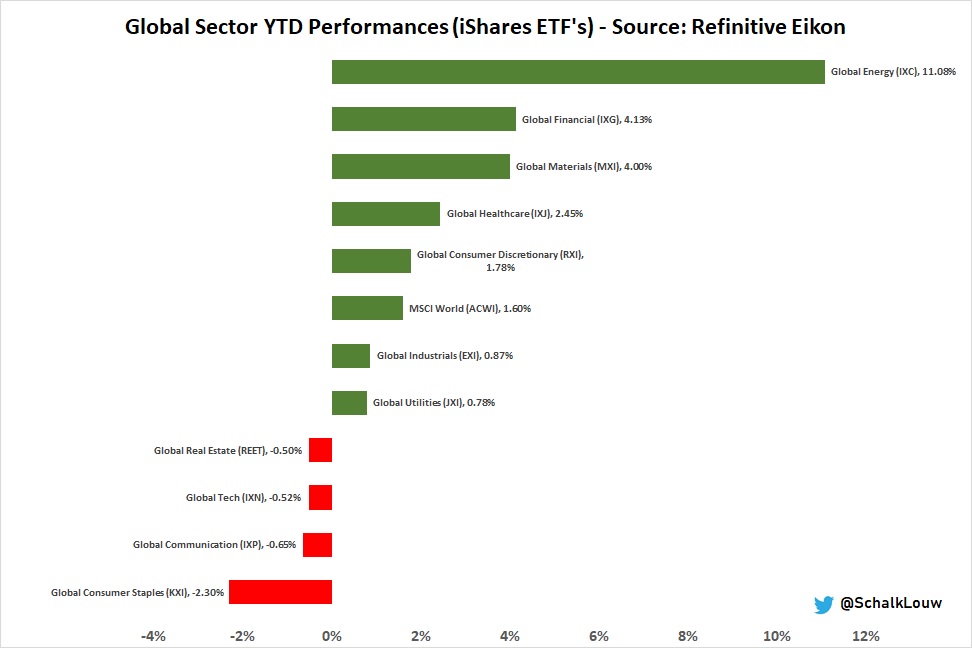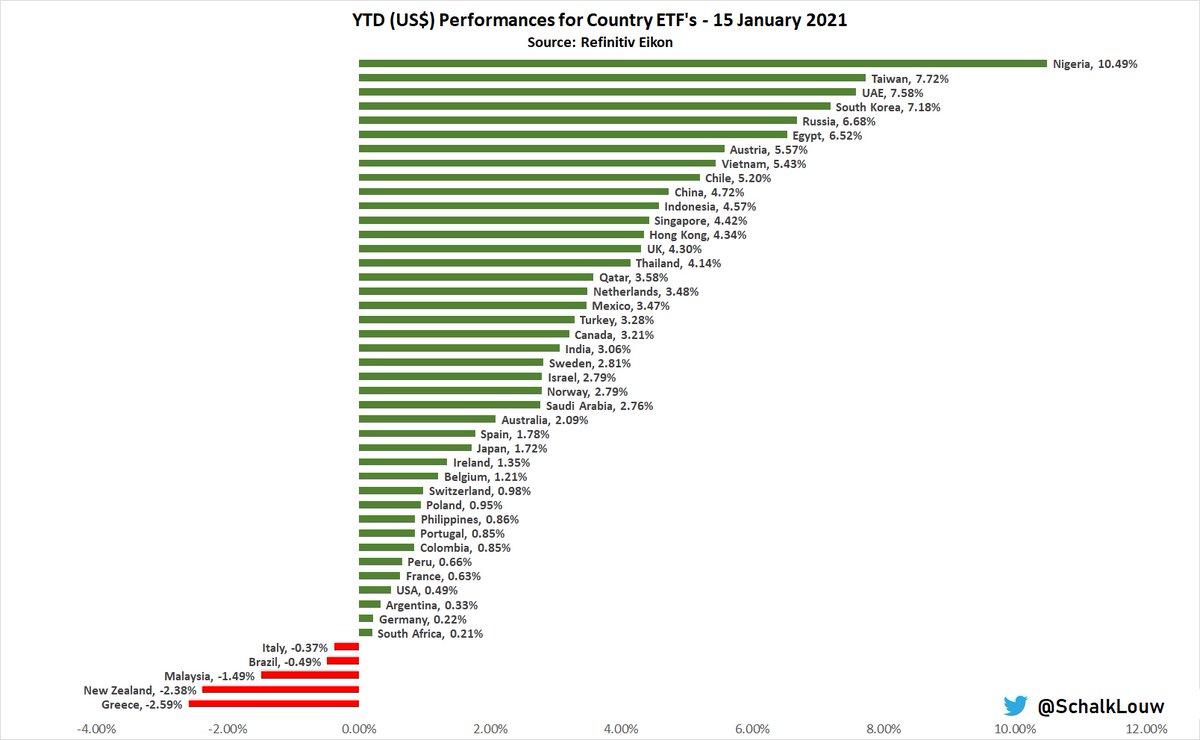
Anybody feels like looking at a few #Global #ETF graphs? Or are you all sitting in front of a big fire, ready for that Sunday braai or potjie?
If there's interest, I'll be happy to show 1 graph for every like or retweet?
#MonthEnd #Markets
If there's interest, I'll be happy to show 1 graph for every like or retweet?
#MonthEnd #Markets
That's nr1 (5 likes & retweets). Nice one @RocknDad 😂- saw you sneak in both a like & retweet, but rules are rules.
#SouthAfrica dropping down to 10th in the #Country #ETF YTD rankings. #China losing the lead to #Taiwan. #Brazil new current holder of the wooden spoon.
#SouthAfrica dropping down to 10th in the #Country #ETF YTD rankings. #China losing the lead to #Taiwan. #Brazil new current holder of the wooden spoon.

That makes it 2.
#DevelopedMarkets (+2.5% in US$) making a bit of a comeback against #EmergingMarkets (+0.8% in US$) in February. #MSCI #SouthAfrica however outperformed both with 5.3% (in US$) over same period.
$URTH $EEM $EZA

#DevelopedMarkets (+2.5% in US$) making a bit of a comeback against #EmergingMarkets (+0.8% in US$) in February. #MSCI #SouthAfrica however outperformed both with 5.3% (in US$) over same period.
$URTH $EEM $EZA


That's 15, which brings up the 3rd
I call this graph the Mr Miyagi or "Risk on...risk off". Big selloff during Feb in #USBonds. #Nasdaq however followed suite in latter part of month. Could we see further weakness in risky assets $ possible interim recovery in Bonds?
$TLT $QQQ

I call this graph the Mr Miyagi or "Risk on...risk off". Big selloff during Feb in #USBonds. #Nasdaq however followed suite in latter part of month. Could we see further weakness in risky assets $ possible interim recovery in Bonds?
$TLT $QQQ


Man! You're making me work! That's 20...
The worst performing #MSCI #Sector of 2020 is not only making a comeback in 2021, but hurting any portfolio without #Energy stocks. Interesting to note that #Tech is suddenly fighting to stay positive YTD.
$IXC $IXN
The worst performing #MSCI #Sector of 2020 is not only making a comeback in 2021, but hurting any portfolio without #Energy stocks. Interesting to note that #Tech is suddenly fighting to stay positive YTD.
$IXC $IXN

Honey! Can you please turn the meat? Here graph for 25
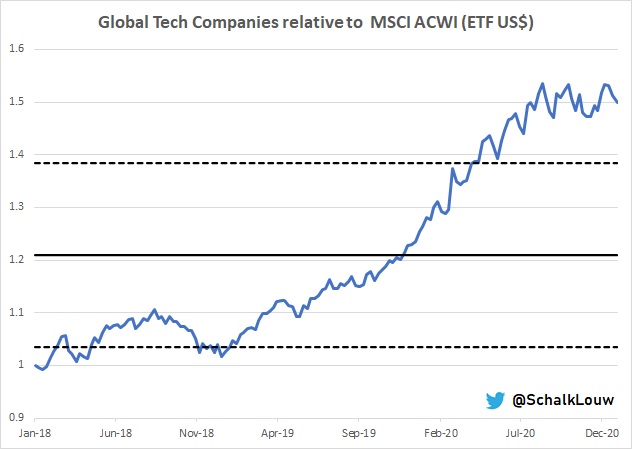
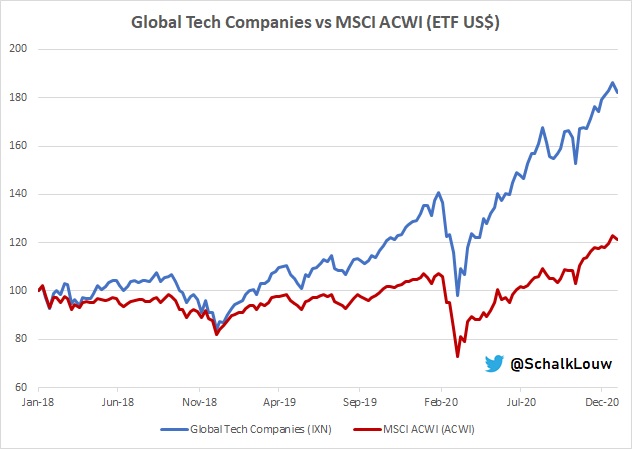
Speaking about #Tech. When you look at recent pullback, you can clearly see why investors who've been invested in this sector, can't be too unhappy. However, be very careful - relative it still seems overcooked
$IXN $ACWI

Speaking about #Tech. When you look at recent pullback, you can clearly see why investors who've been invested in this sector, can't be too unhappy. However, be very careful - relative it still seems overcooked
$IXN $ACWI


Here goes nr6
Staying on tech-related data. After the recent recovery/outperformance by Chinese #internet companies again their US counterparts, we clearly saw some profit-taking in latter part of Feb. They are however still lagging over 3yrs.
$KWEB $FDN
Staying on tech-related data. After the recent recovery/outperformance by Chinese #internet companies again their US counterparts, we clearly saw some profit-taking in latter part of Feb. They are however still lagging over 3yrs.
$KWEB $FDN

Take your time, but make it quick! Nr 7
If you think that #USBonds were the only #bonds being sold-off in February, you should think again. Clearly #inflation is becoming a bit of a worry globally, with #EmergingMarkets Bonds actually having a worse time in February.
$EMB $IGLO
If you think that #USBonds were the only #bonds being sold-off in February, you should think again. Clearly #inflation is becoming a bit of a worry globally, with #EmergingMarkets Bonds actually having a worse time in February.
$EMB $IGLO

I can bank on the Twitterati to make me work on #SunnyBraaiDay. Nr 8
Speakings about the bank.
Mmm, what do we have here? Are #Banks liking the outlook of possible rate hikes or is this just #value mean reversion? #Global Banks really having a fun time in February
$BNKS $ACWI

Speakings about the bank.
Mmm, what do we have here? Are #Banks liking the outlook of possible rate hikes or is this just #value mean reversion? #Global Banks really having a fun time in February
$BNKS $ACWI


Ok fine...nr 9
Naturally with the positivity around #Banks during Feb & the fact that it makes 48% of S&P #Global 1200 #Financials, it helped Financials in general to have an outperformance month. We can also see that it has some further relative upside potential.
$IXG $ACWI

Naturally with the positivity around #Banks during Feb & the fact that it makes 48% of S&P #Global 1200 #Financials, it helped Financials in general to have an outperformance month. We can also see that it has some further relative upside potential.
$IXG $ACWI


Happy to see we're slowing down to 50 (km/h). Numero 10
Now we're getting to the fun stuff. Despite massive money printing & further stimulus, #Gold lagging #Global #Equities (for now). We are however getting closer to similar relative oversold levels seen in H2 2018
$GLD $ACWI

Now we're getting to the fun stuff. Despite massive money printing & further stimulus, #Gold lagging #Global #Equities (for now). We are however getting closer to similar relative oversold levels seen in H2 2018
$GLD $ACWI


Eish! or without eish I must rather say. Nr11
So if you feel, looking at above☝️, that #Gold is ready to pop, then see what #GoldMiners did last year when it did. Yes, some will argue an overreaction, but Gold miners now getting close to underlying Gold again relative
$GDX $GLD

So if you feel, looking at above☝️, that #Gold is ready to pop, then see what #GoldMiners did last year when it did. Yes, some will argue an overreaction, but Gold miners now getting close to underlying Gold again relative
$GDX $GLD


Shouldn't you all be braai'ing or taking a nap? You going to keep me busy till (nr)12
With hype around #silver I often get question between #gold/#silver miners. Relatively spoken, gap closed with silver joining industrial metal run. Could be good for gold (soon)
$GDX $SIL

With hype around #silver I often get question between #gold/#silver miners. Relatively spoken, gap closed with silver joining industrial metal run. Could be good for gold (soon)
$GDX $SIL


Lucky nr13
Final one on metals. Looking at a broader #PreciousMetals #ETF (consisting of 54% Gold, 29% Silver, 13% Palladium & 4 Platinum) relative to equities, one can understand why some still see this as an opportunity.
#GLTR $ACWI

Final one on metals. Looking at a broader #PreciousMetals #ETF (consisting of 54% Gold, 29% Silver, 13% Palladium & 4 Platinum) relative to equities, one can understand why some still see this as an opportunity.
#GLTR $ACWI


That's 70 & well deserved nr 14
Anybody wondered why the recent change in trend in #OrbisvsSP500 #ETF unofficial challenge?
Hint - one of the answers might be found in recent outperformance by #Global #Value.


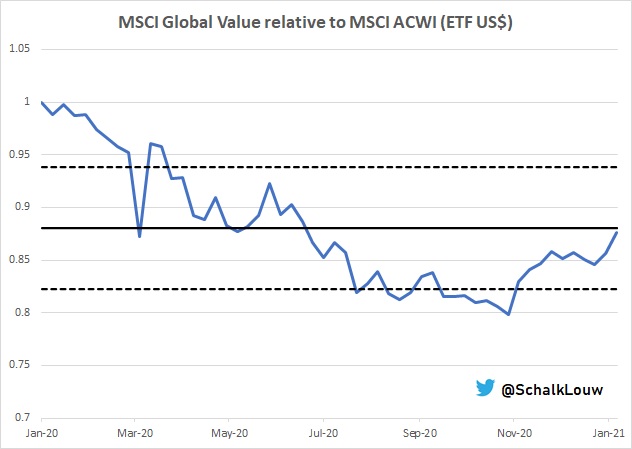
Anybody wondered why the recent change in trend in #OrbisvsSP500 #ETF unofficial challenge?
Hint - one of the answers might be found in recent outperformance by #Global #Value.


That's 75 going onto 2000. Nr15
Speaking about 2000 - #Russell2000 having a great 6 months, but now getting close to short-term relative "overbought" territory.
YTD performance by US Small Caps +11.3% in US$, while $SPY is up 1.7%
$IWM

Speaking about 2000 - #Russell2000 having a great 6 months, but now getting close to short-term relative "overbought" territory.
YTD performance by US Small Caps +11.3% in US$, while $SPY is up 1.7%
$IWM


If you're still keen, let's do nr16
Now you've earned some Local...Lekkerrr #ETF data. FTSE/JSE Top40 ETF recovering & already catching 1st developed market over 3yr period. Still behind, but watch this space...
#Coreshares #Satrix #Sygnia

Now you've earned some Local...Lekkerrr #ETF data. FTSE/JSE Top40 ETF recovering & already catching 1st developed market over 3yr period. Still behind, but watch this space...
#Coreshares #Satrix #Sygnia


You know what rhymes with "seventy-five"? Time to light my fire! Ok, it doesn't, but it's true. Nr 17
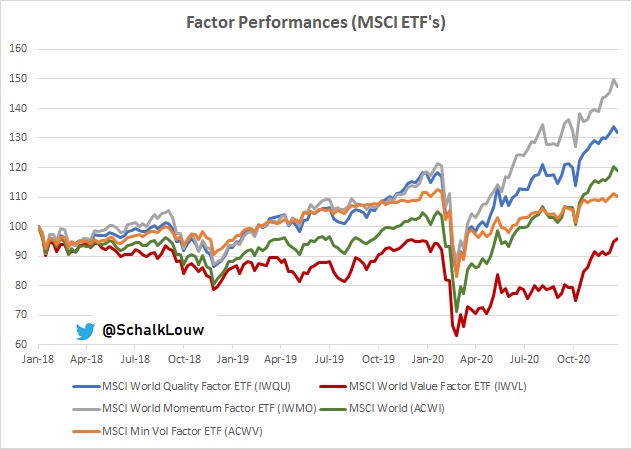
Similar to #Global #Factor #ETF data, we saw South African #Value also making a bit of a comeback. Over 6 month period, #STX40 delivered total return of 19.5%. #NFEVAL did 27.5%
Similar to #Global #Factor #ETF data, we saw South African #Value also making a bit of a comeback. Over 6 month period, #STX40 delivered total return of 19.5%. #NFEVAL did 27.5%

Unroll @threadreaderapp
• • •
Missing some Tweet in this thread? You can try to
force a refresh

