on issuu: issuu.com/home/published…
and
on Scribd: scribd.com/document/39252…
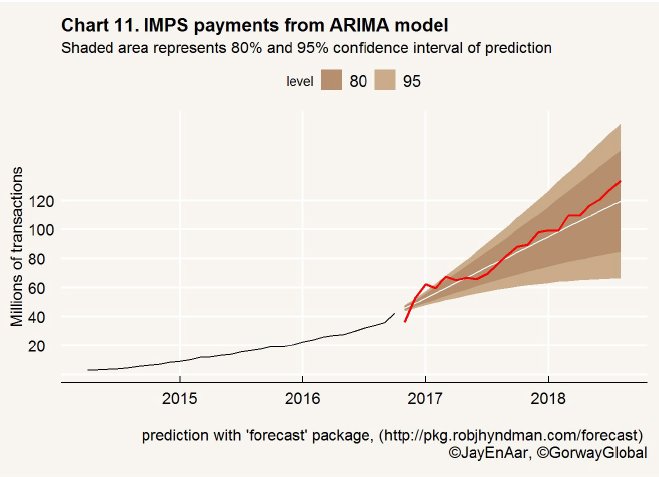
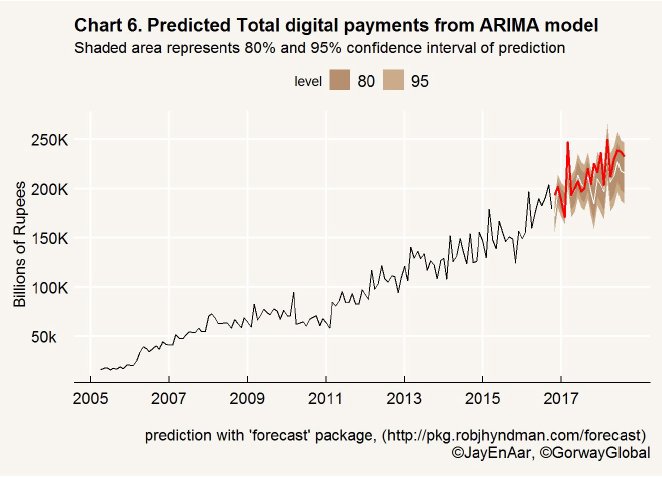
But here in this thread I present the main results. Previous analysts used a simplistic approach of doing a before-after comparison. But this is a spurious method
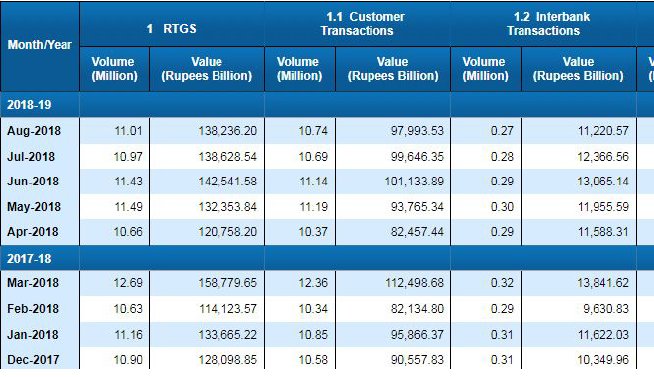
My analytical approach was simple. I used the figures from RBI and took the monthly data upto Oct 2016 on each idicator and treated it as a regular time series data. (see robjhyndman.com/hyndsight/fpp/)
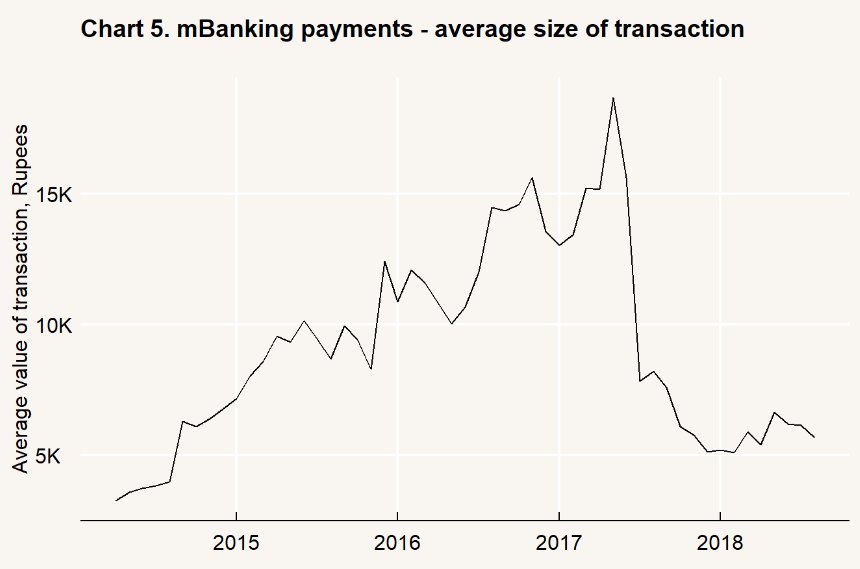
You can download it here: go to dbie.rbi.org.in/DBIE/dbie.rbi?… and click on 'Payment Systems Indicators'
The R program code for the full analysis is on my git hub repository here: github.com/JammiNRao/DeMo…
Comments welcome
Analysis in R : cran.r-project.org
Charts in ggplot2: ggplot2.org by @hadleywickham
ARIMA from package 'forecast': cran.r-project.org/web/packages/f… by
Rob.Hyndman@monash.edu


