,
43 tweets,
30 min read
Read on Twitter
Following my recent analyses of where Premier League and Championship clubs source their money and what they spend it on, I received many questions on how a cash flow statement works, so I will explain the mechanics (using Premier League season 2016/17) in the following thread.
Traditionally, supporters have focused on a club’s profit and loss account, which is not surprising, because: (a) that is what the media tend to report; (b) it is intuitively easy to understand, being basically revenue less expenses (mainly player wages).
Nevertheless, the reported figure is an accounting profit, which is not necessarily a “real” cash profit, as it is based on the accountant’s accruals concept and this can be very different from actual cash movements.
This is important, as the main reason that football clubs fail is cash flow problems. It does not matter how large your revenue is (or your profits are), if you do not have the cash to pay your players, suppliers or the taxman, then you will find yourself in trouble.
This analysis will start with the familiar profit and loss account and then reconcile this to the cash flow statement to highlight the differences. It’s fairly technical, but will reveal the different business models that are employed and explain why certain clubs act as they do.
Premier League total revenue 2016/17 was £4.6 bln (TV £2.8 bln, commercial £1.2 bln, match day £0.6 bln), but this only produced £119m operating profit, mainly due to £2.5 bln wages (wages to turnover 55%) plus £896m other expenses and £1.0 bln player amortisation & depreciation. 


Operating profit of £119m is reconciled to £1.3 bln cash flow from operating activities by making two adjustments: (a) adding back non-cash items such as player amortisation, depreciation and impairment £1.0 bln; (b) movements in working capital £97m.

At this stage we need to understand how football clubs account for player trading, both for purchases and sales, as the accounting treatment in the profit and loss account is very different to the actual cash movements.
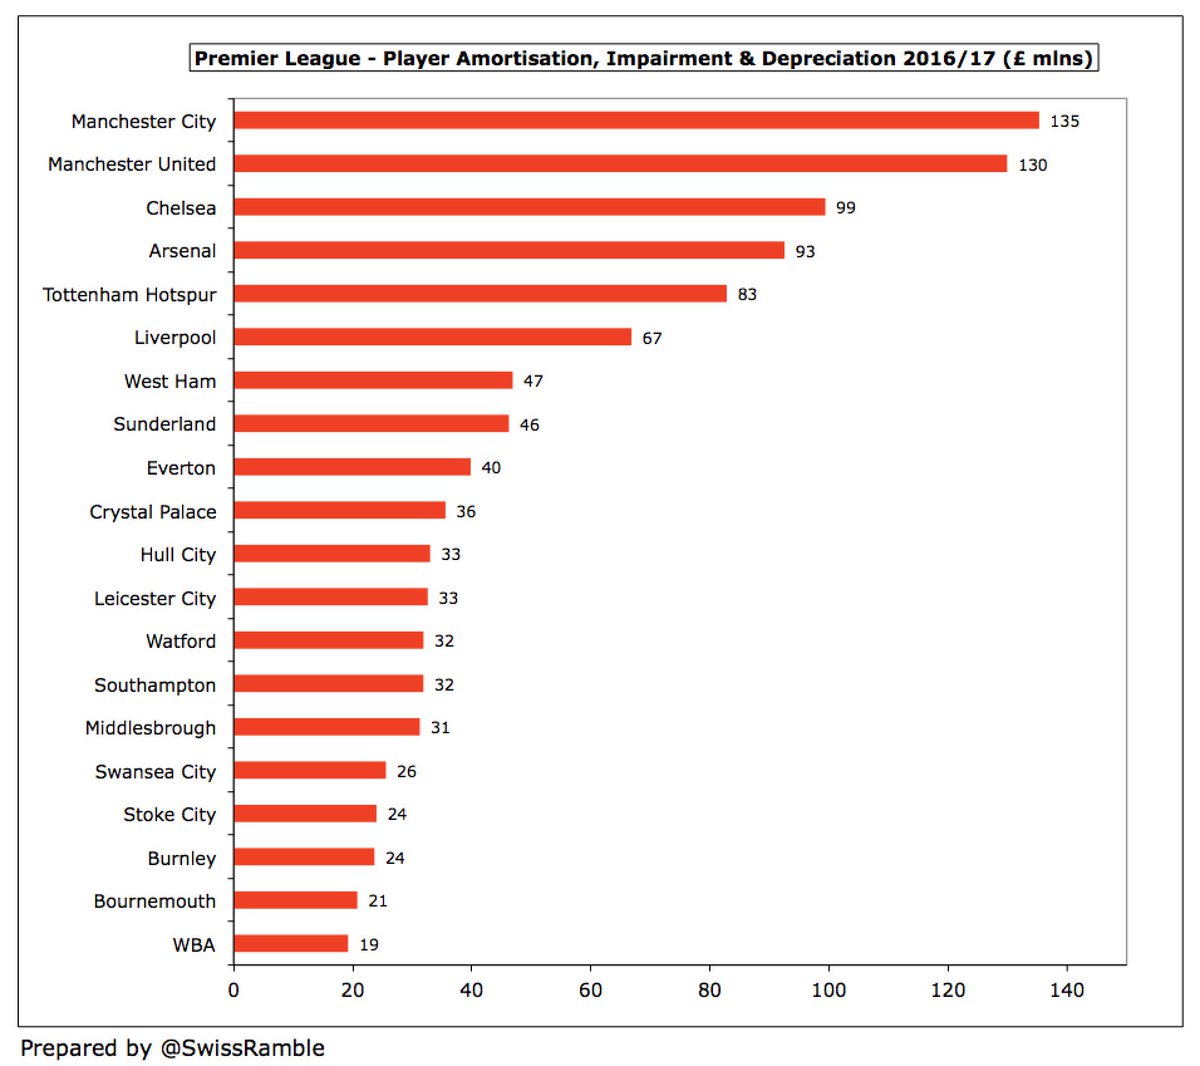
Football clubs do not fully expense transfer fees in the year a player is purchased, but instead write-off the cost evenly over the length of the player’s contract via player amortisation, while any profit made from selling players is immediately booked to the accounts.
So if a player is purchased for £30m on a 5-year contract, the annual amortisation in the accounts is £6m, i.e. £30m divided by 5 years. This means that the player’s book value reduces by £6m a year, so after 3 years his value in the accounts would be £12m, i.e. £30m less £18m.

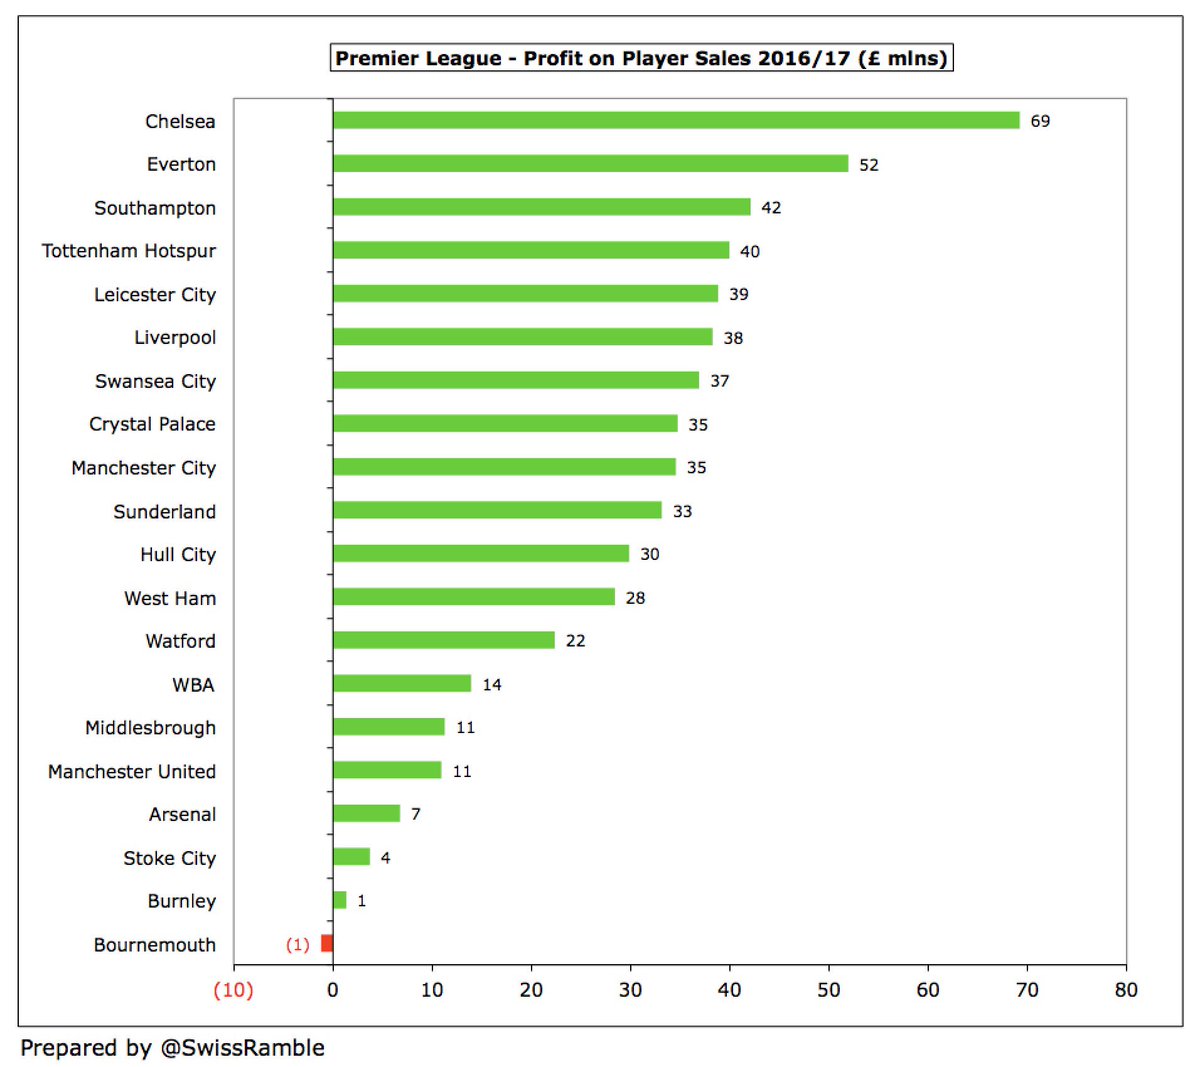
If the player were to be sold at this point for £35m, profit on player sales from an accounting perspective would be £23m, i.e. sales proceeds of £35m less remaining book value of £12m.

Player amortisation is a non-cash expense, so is added back for the cash flow calculation. In the same way, profit on player sales is purely an accounting profit, which is booked in total, regardless of when the club is paid. Instead, cash flow shows cash sales & purchases.
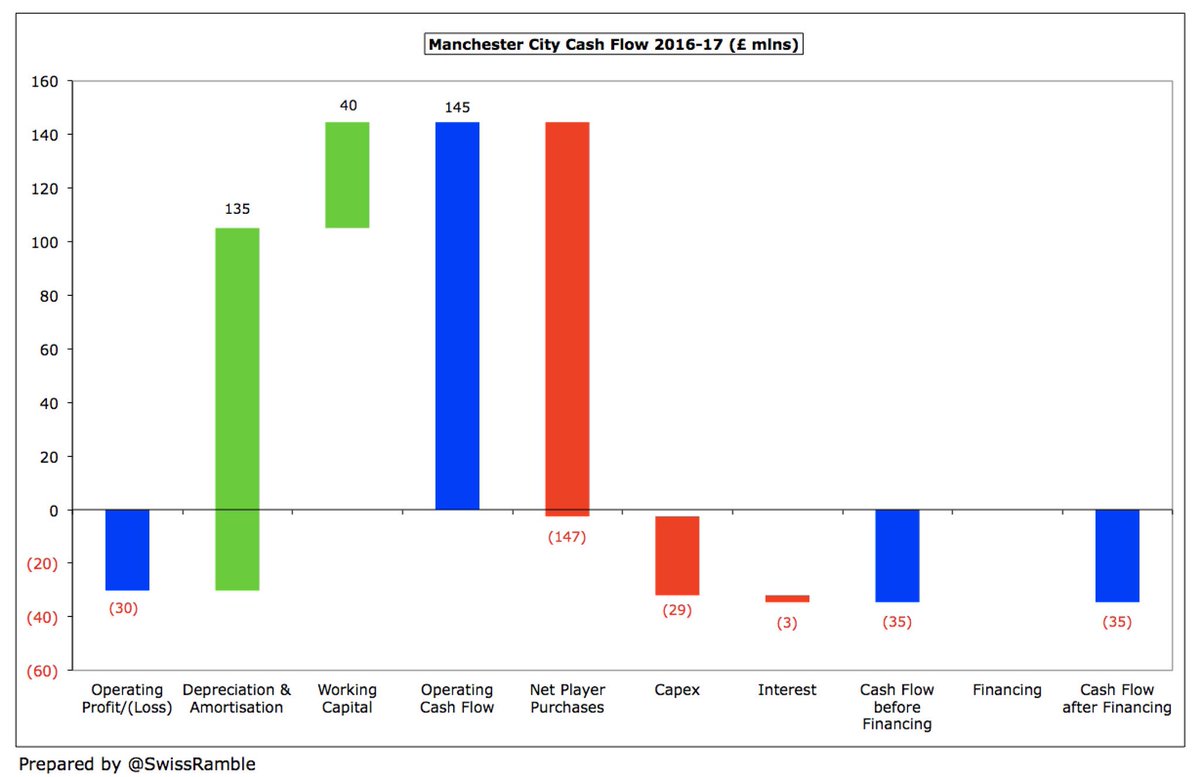
Given the rise in transfer fees, player amortisation has become a major expense in the profit and loss account, e.g. adding back #MCFC £135m amortisation & depreciation moves them from £30m operating loss to £105m cash generated from operations (before working capital movements).
Working capital measures short-term liquidity, defined as current assets less current liabilities. Changes in working capital can cause operating cash flow to differ from net profit, as clubs book revenue and expenses when they occur instead of when cash actually changes hands.
If current liabilities increase, a club is paying its suppliers more slowly, so is holding on to cash (positive for cash flow). On the other hand, if a club’s debtors increase, this means it collected less money from customers than it recorded as revenue (negative for cash flow).


This £1.3 bln operating cash flow is what is available to the club to spend on buying players, investing in infrastructure (stadium or training ground) or paying interest on loans and (occasionally) tax, though additional financing may be required to cover any shortfall.


The cash number for transfers is the only authentic figure publicly available, but it can also be a bit misleading, as it may not cover the entire fee due to payments made in instalments. Paying transfer fees in stages is increasingly used by some clubs as a source of financing.


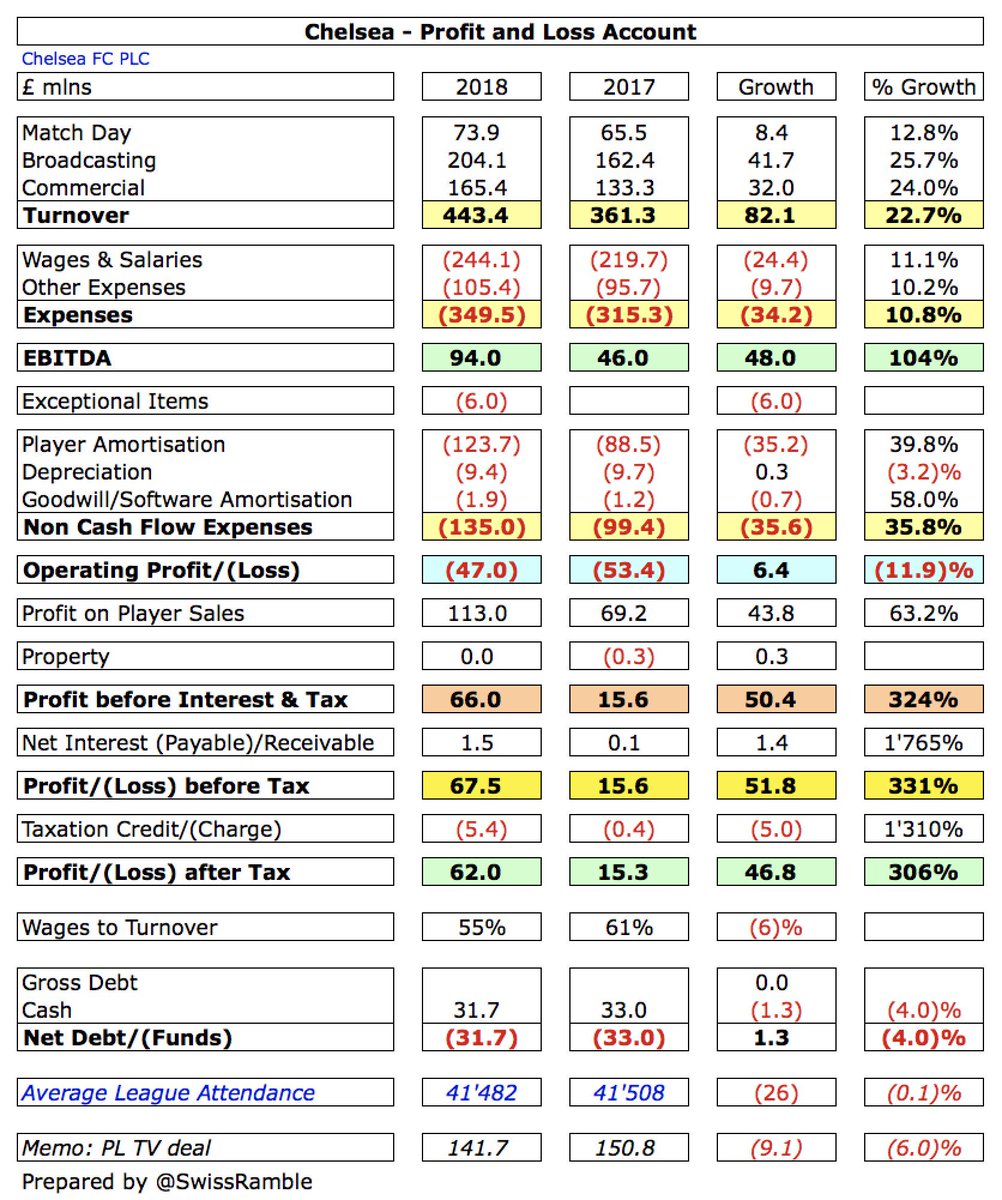
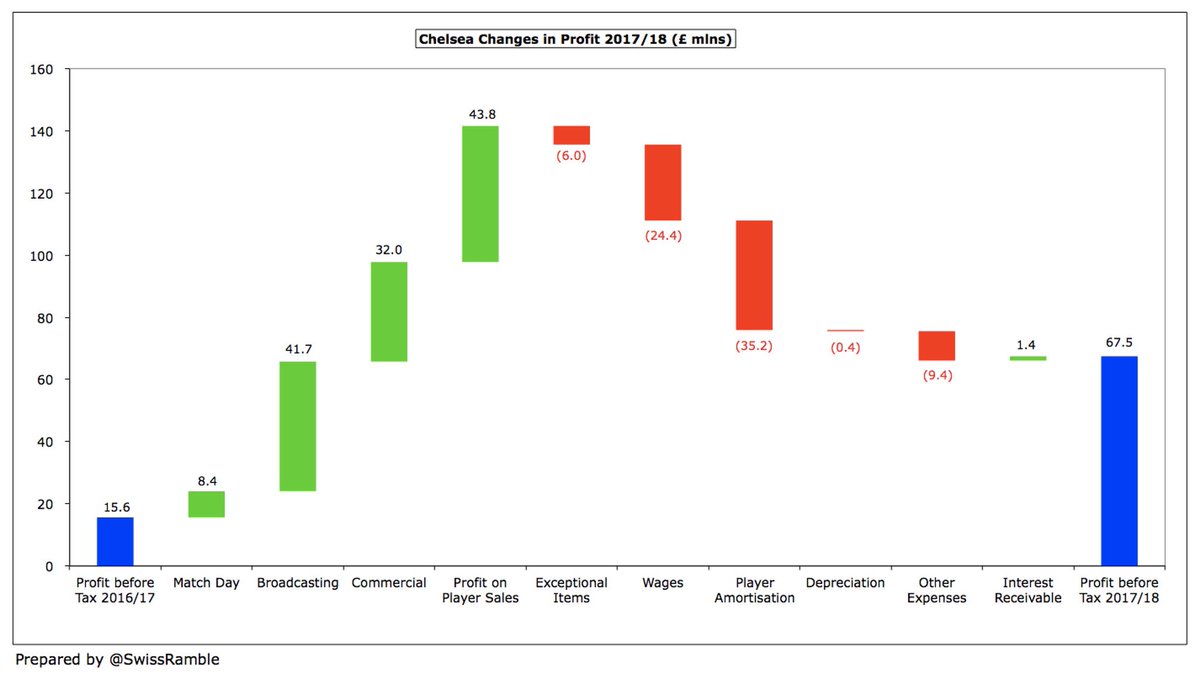
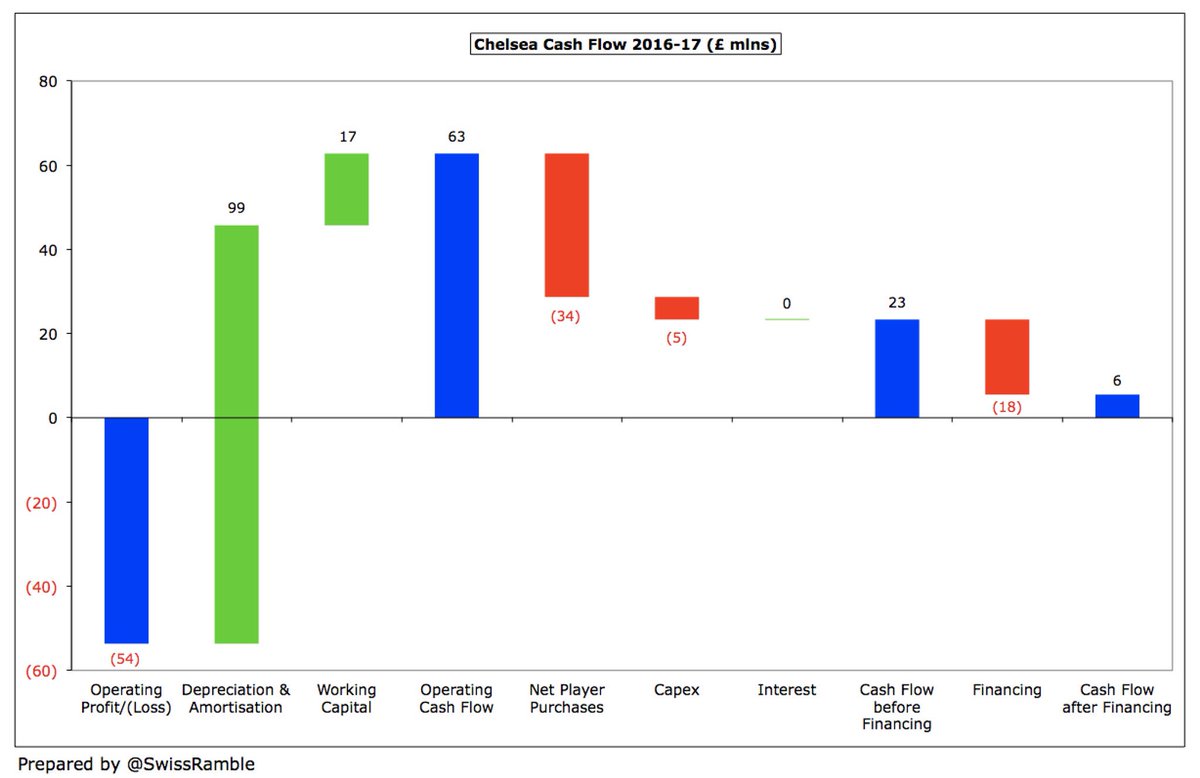
So, on a cash basis, #CFC had £135m player purchases and £101m player sales, giving net player purchases of £34m, which is completely different from the £69m profit on player sales reported in the profit and loss account.


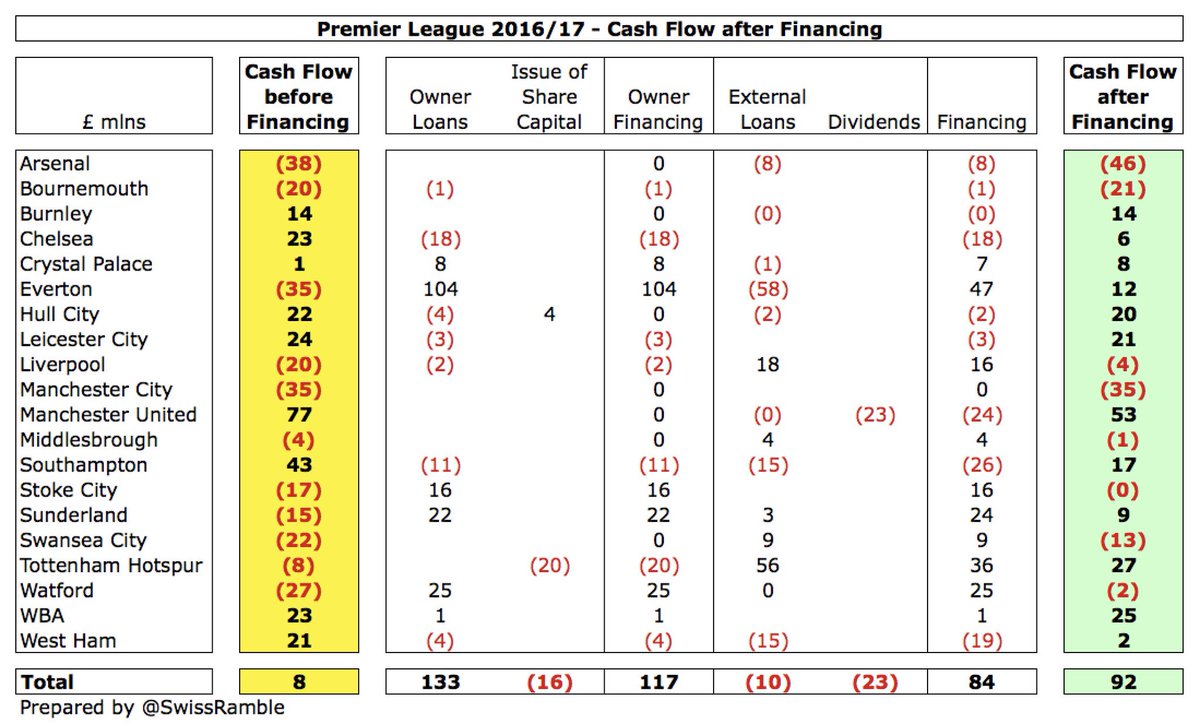
We then add £84m of financing to give our final £92m cash flow after financing, comprising £117m of owner funds less £10m external loan repayments and £23m dividends (all paid by #MUFC).


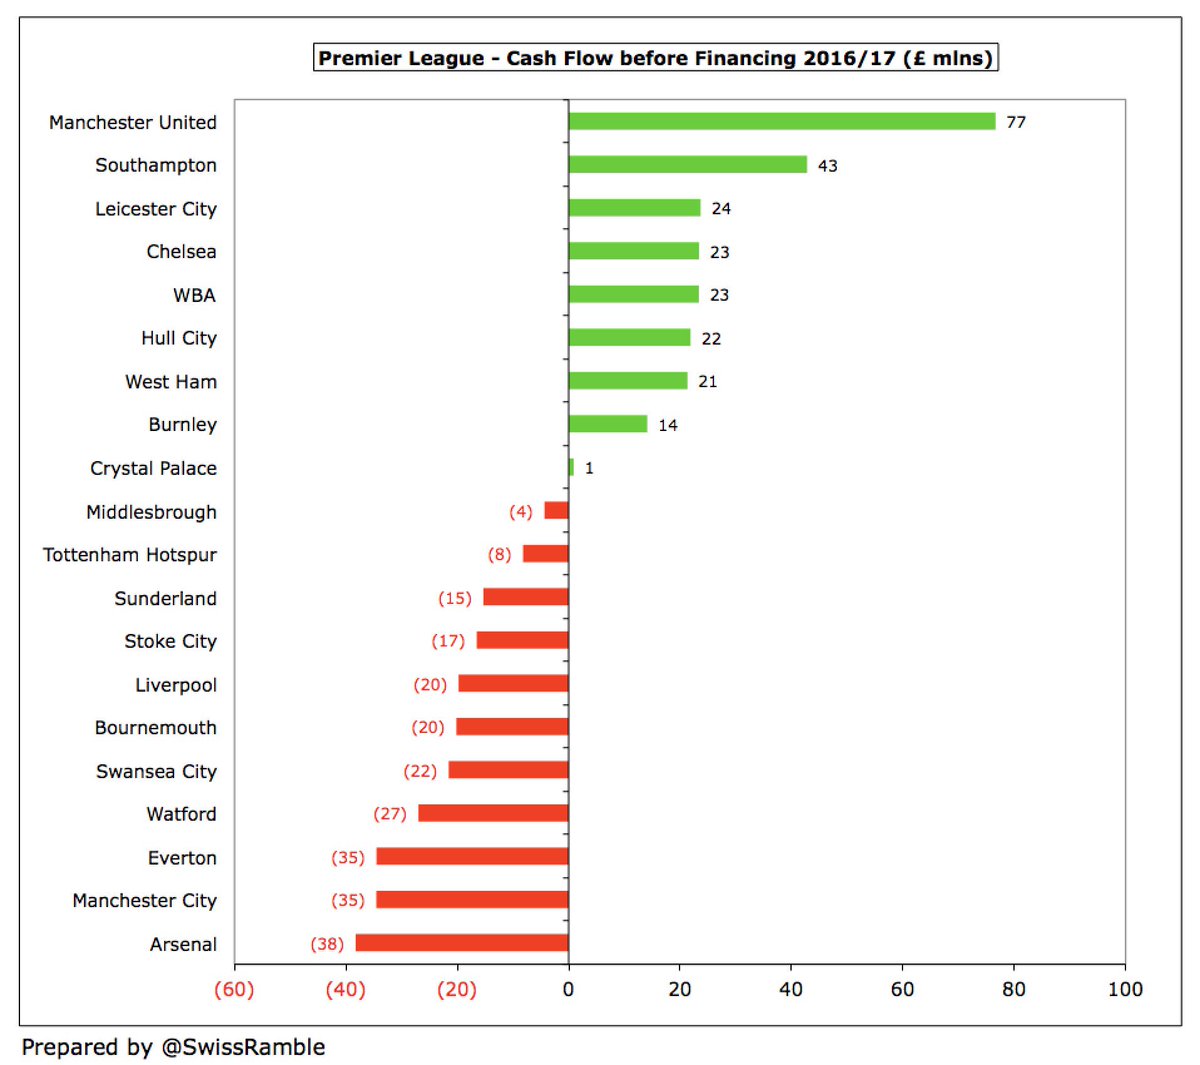
Let’s now look at how the cash flow has impacted the actions of the seven leading clubs in the Premier League.
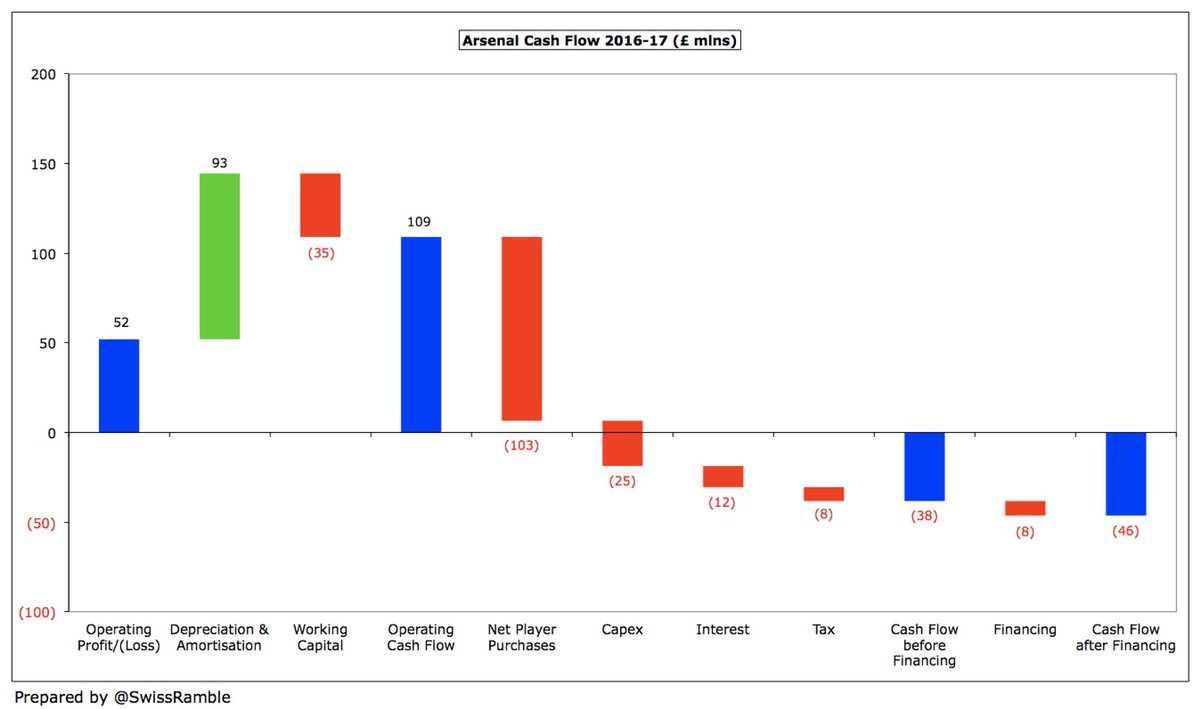
Although #AFC had £109m operating cash flow, they “went for it” in 2016/17 after years of relative austerity, splashing £103m (net) on players and £25m capex (mainly training grounds). Also paid £20m for Emirates loan (£12m interest & £8m debt) and £8m tax. Net outflow £46m.
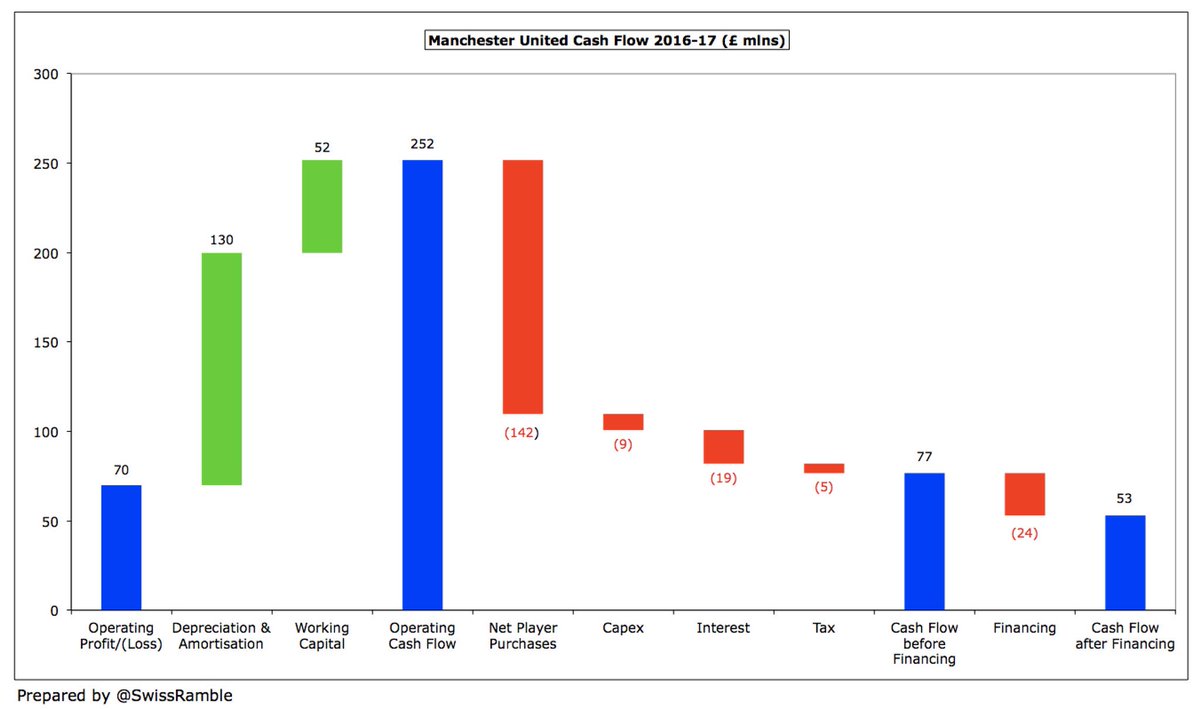
Massive #MUFC operating cash flow of £252m funded £142m player purchases (net) and (relatively low) £9m capex. Held back by £43m paid out due to Glazers’ financing: £23m dividend and £19m interest. However, after £5m tax payment, cash still rose by £53m to a jaw-dropping £290m.
#MCFC £145m operating cash flow was entirely used (and more) to fund £147m player purchases (net), while they invested £29m in capex and made £3m lease payments on the stadium. As a result, cash fell by £35m to £19m. City did not have any owner financing (unlike previous years).
#CFC £54m operating loss became £63m operating cash flow thanks to non-cash adjustments. Only spent (net) £34m on players (high purchases offset by sales) and £5m capex, while £18m loan reduction due to conversion to equity. Net cash inflow of £6m increased cash balance to £33m.
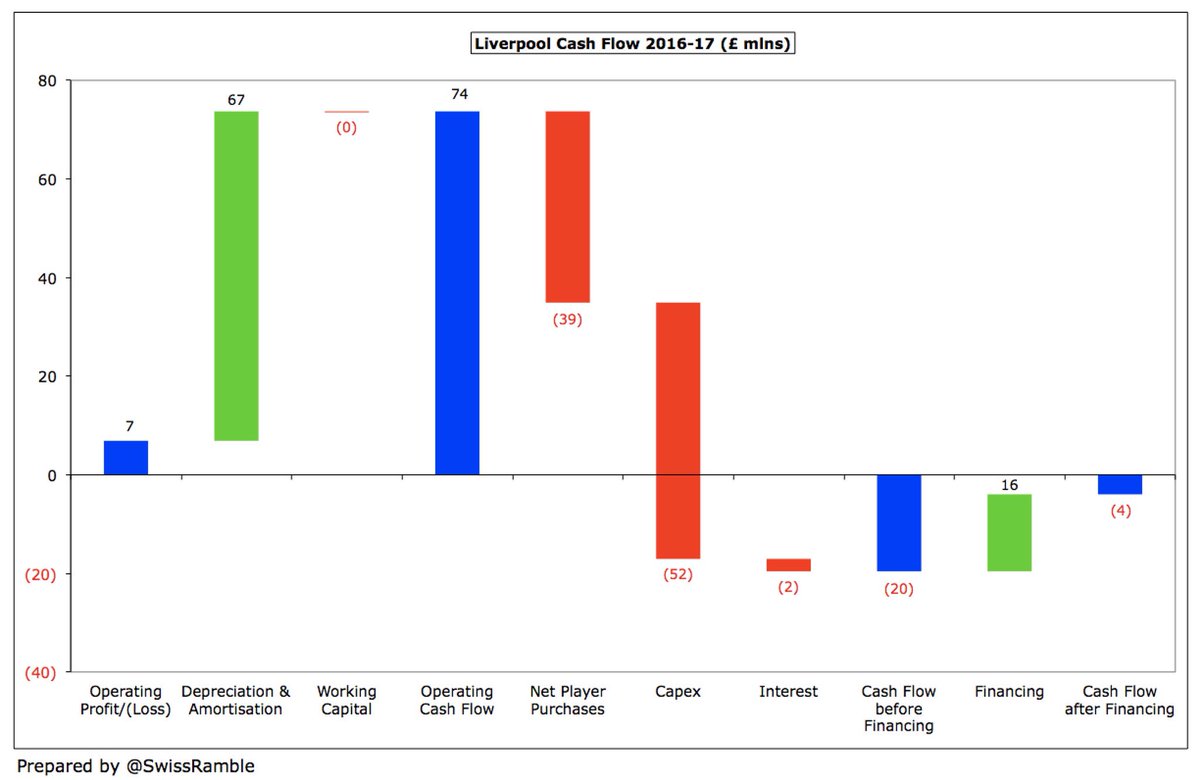
#LFC £74m operating cash flow mainly spent on capex £52m (stand expansion) and players £39m – £97m purchases less £58m sales. Shortfall largely funded by £18m increase in bank loan, leading to £4m decrease in cash. Liverpool spend all they earn, so have a low £4m cash balance.
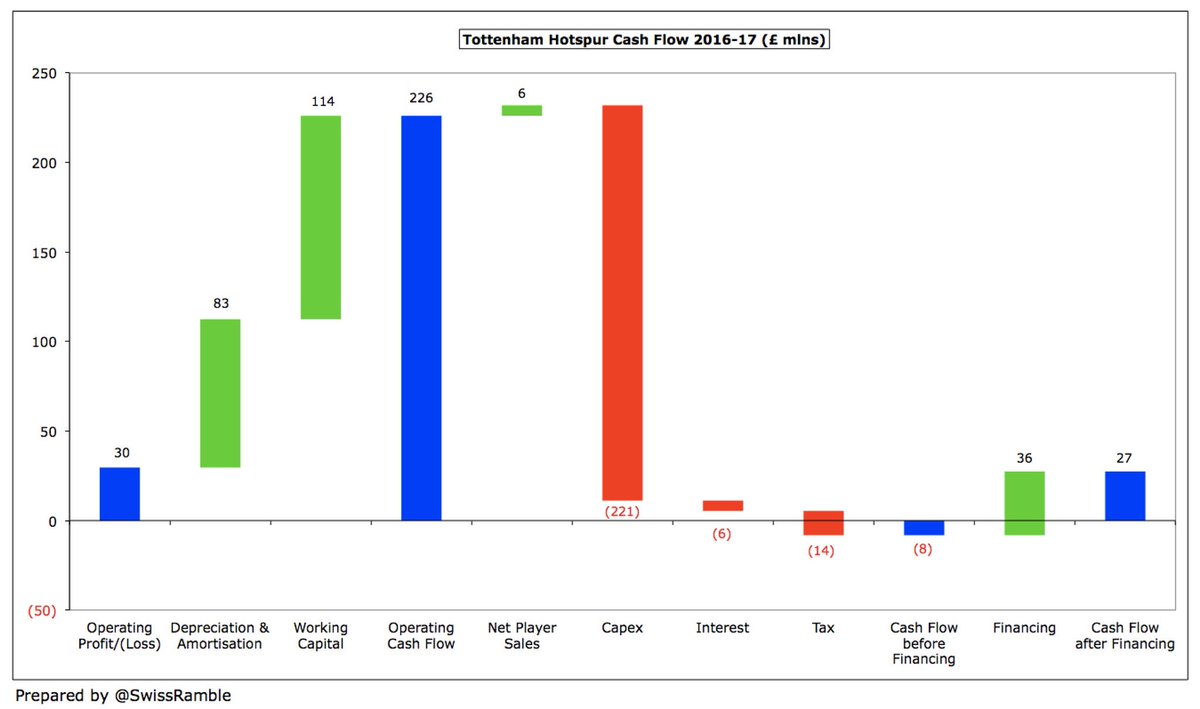
#THFC high £226m operating cash flow, boosted by £114m working capital movements, but spent almost all on new stadium £221m. Only major club with net player sales £6m. Paid £6m interest & £14m tax. £56m additional loans; bought back £20m preference shares. Cash up £27m to £200m.
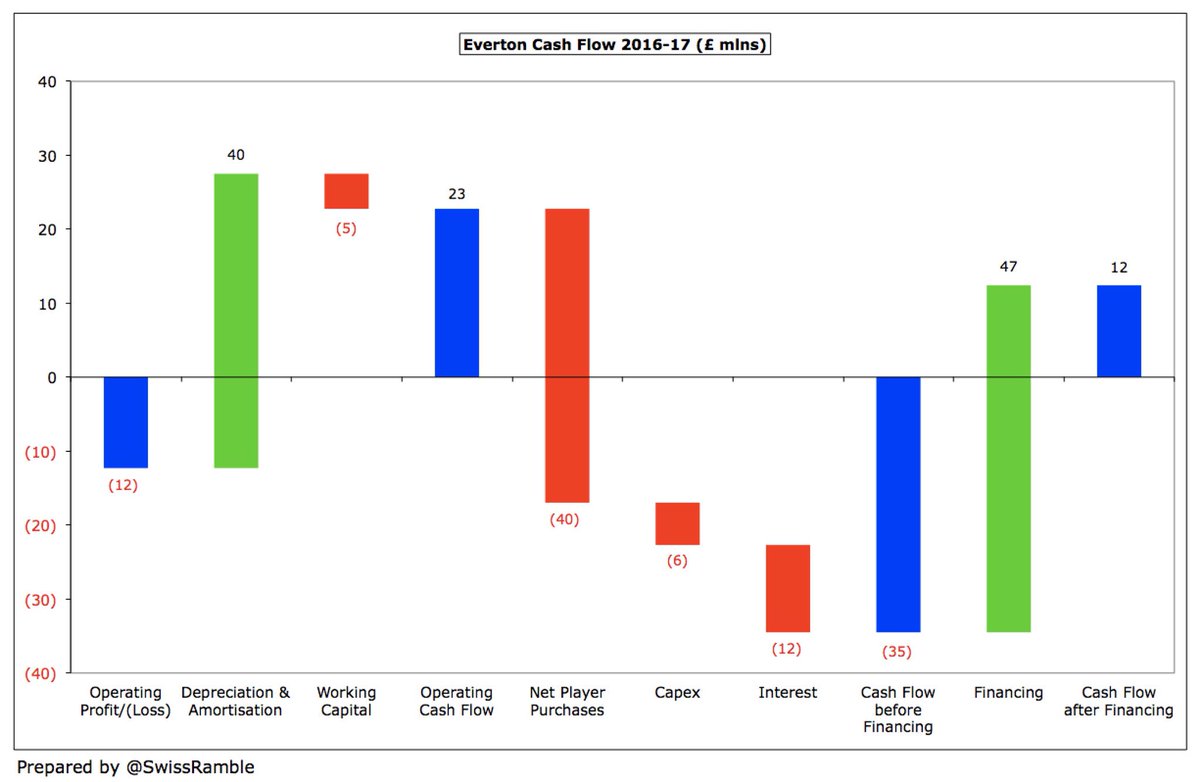
#EFC £23m operating cash flow helped by £47m net financing (£104m from Moshiri less £58m external loan repayment). Spent £40m on players – £71m purchases less £31m sales. Also £6m capex & £12m interest (incl penalty fee). Cash up £12m, but balance only £10m as overdraft cleared.
This has been quite technical, but those wishing to understand a football club’s finances and the impact these have on its strategy should, as always, follow the money. That means not just focusing on the P&L, but also looking into the mysterious world of the cash flow statement.