,
68 tweets,
16 min read
Read on Twitter
1/ Here is the @crypto_voices Q4 2018 update on the global monetary base. This is the only economically comparable money supply to bitcoin's. #Bitcoin is the *18th largest currency in the world*. To dig deeper in what it all means, follow on below. This is installment #3. 👇 
2/ To begin, it's important to understand the universal accounting identity: Assets = Debt + Equity. Today, it's true that all fiat money is debt-based. But before exploring fiat money, let's look at asset-based money.
3/ Traditionally, commodity money has been asset-based, most notably gold. Gold is a true asset of the holder. If you own gold free and clear, it is your asset, and no one else's debt, no one else's liability.
4/ So back to the accounting identity, if you hold gold free and clear, it would be correct to say your personal balance sheet includes a 100% gold asset (matched by 100% personal equity), and *no one else* has a claim on that asset. What else is interesting about gold?
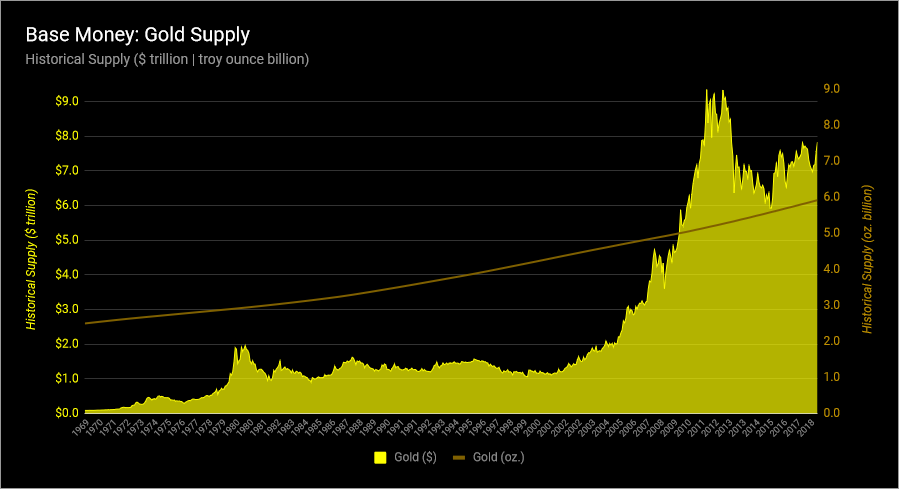
5/ As many Austrian economists point out, gold has unique characteristics that drive its demand as money. Most notably, its supply is extremely hard to produce. This is why gold is hard money. How hard? Here are the gold supply inflation rates since 1970.

6/ The compound annual inflation rate of the gold supply since 1970 is 1.8%. Not pictured, the compound annual inflation rate of gold since medieval times (1400s) is 0.7%. This is hard money.
7/ Since 1970, let's see how this looks from the supply-side. There were 2.5 billion ounces of gold above-ground in 1970. Today, 5.9 billion ounces. Hard money. However, since 1971, gold has been demonetized as money, and no central bank will redeem gold on demand, to anyone.
8/ Let's go back to fiat money. Central banks have a license, a monopoly, to print fiat money. Unlike gold, fiat money is weird. The money they print is *their* debt to the public. And they can meet this liability with a strange tool: the printing press.
9/ If you hold a dollar (Fed note), euro (ECB note), yuan (PBOC note), or yen (BOJ note), it is true, this is *your* asset. But what for? What if you took this note to the central bank in an effort to "redeem" it? What is the central bank obligated to do?
10/ Remember, the note is the central bank's liability. They have an obligation on this note. What would they give you in return? Answer: *another,* fresh banknote! What if the central bank doesn't have any fresh notes available? Answer: *they have a license to print more.*
11/ In this way, we can see that fiat money, central bank money, is different than gold. Unlike gold, which is your asset and no one else's debt; if you hold a fiat banknote, it is your personal asset, *but* it is also the central bank's debt.
12/ Now, question, can we pinpoint a fiat money supply that is "comparable" to gold's supply? You have likely heard of M1, M2, M3, maybe even M4 or L or the Divisia money supplies. Are these fiat money supplies comparable to gold's supply? No, they are not. Why?
13/ The reason is that all of these monetary aggregates (M1 and up) include *commercial bank liabilities.* Meaning? Those money supplies themselves really are "claims" on basic money. Let's look at an example. A common "money" in M1 is demand deposits. What? Checking accounts.
14/ The checking account is very common. If you see "money" that's "in" your bank account on your screen, it is true, this is "close" to real money. But other banks do not actually "need" to accept your checks. A bank could, if it wanted to, actually deny payment from your check.
15/ Mostly this doesn't happen, & FDIC gives confidence to checking accounts acting as money, but this strays from our topic. Back on point, if you added all a bank's checking accounts together, does the bank have enough banknotes (dollars) in reserve, in case holders want cash?
16/ The answer is no. The bank doesn't reserve 100% of checkable deposits. It reserves less (sometimes much less) than 10% of what's on your computer screen, in cash (and central bank reserves - we will get to this). This is called fractional reserve banking.
17/ Now, this isn't an exercise on fractional reserve banking. Remember, the goal is to find a comparable fiat money supply to gold's. M1 & up isn't good enough, because these supplies are "claims" on money, even though day-to-day checking accounts (M1) are "close" to base money.
18/ So what is a fiat money supply that is comparable to gold's supply? The answer is *base money.* This is also called the monetary base, reserve money, central bank money, outside money, or (most meaningfully) *high-powered money.* This typically includes two things...
19/ Those two things are cash (banknotes) and commercial bank reserves at the central bank. Remember how commercial banks only "reserve" less than 10% of outstanding claims? Those reserves are what I'm talking about here. Commercial bank reserves, redeemable at the central bank.
20/ Don't worry too much on the meaning of commercial bank reserves versus cash. The point is that the central bank has authority to create either, whenever it wants. In the fiat banking system, this is the "base layer" of money for all claims made by anyone, legally.
21/ This is why base money is comparable to gold's money supply. And where can we find it? Base money - that is all currency plus commercial bank reserves - is reported on central banks' balance sheets each month (remember, as a liability!).
22/ There are other reasons why base money is a "good" figure. It's the only money supply central banks directly control. It's a clear accounting entry on their balance sheet. Also, the shadow economy is continuously eating into M1 and other aggregations.
23/ So let's get to fiat. The following chart includes the base money of 30 currencies & 61 countries, or 90.5% of global GDP. All fiat units have been converted to US$, starting 1970. At that time, the global fiat money supply was about $80 billion. Now? $19.6 trillion.

24/ A note on prior tweet. In fact, we are covering 115 nations, 84 currencies, and 94.4% of global GDP. Why? 11 countries use a currency board and 43 are pegged to major currencies already in this sample (don't worry, complete summary of this awaits at end).
25/ Final note here. We use the IMF classification of different FX regimes. Any currency that makes it to our "headline" sample needs at least a "Stabilized arrangement," such as China. These currencies have some kind of market influence. For more, see IMF 2017 FX report.
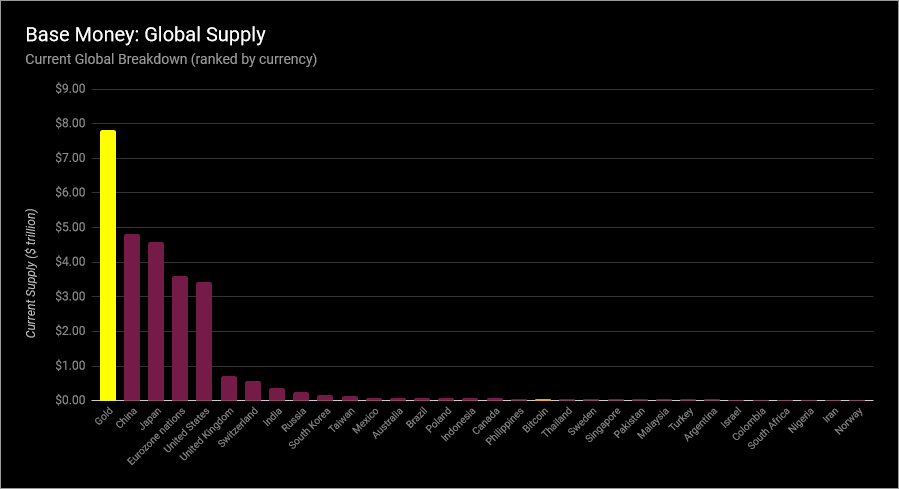
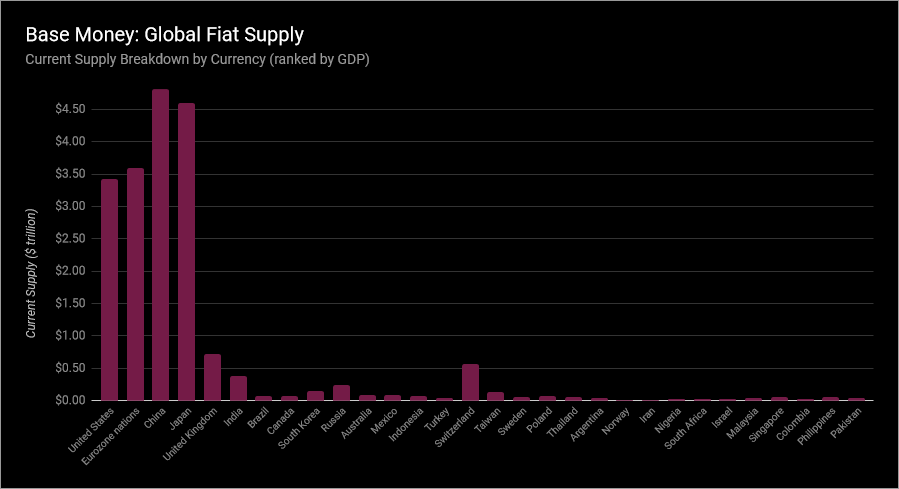
26/ If you would like to see not historical balances, but how these 30 fiat currencies actually shake out in the present, that chart is here.
27/ Back to that fiat base money chart, which is now $19.6 trillion. What can we make of this? Well, remember gold's supply increased 1.8% compounded since 1970. What about all the fiat units in the world put together? 12.8%. Compounded. Annual money growth.
28/ Now remember, the prior figure of 12.8% is *compounded,* annual inflation for fiat base money, since 1970. This may not seem like a huge difference (it is), so we need to dig into the compounding...
29/ Compound annual growth is an extremely important metric. It's "stronger" than a simple, annual rate (cryptovoices.com/compound-retur…). We can use this rate to understand investment returns, or long-term trends like population growth. We can also derive doubling time from this figure.
30/ For example, gold's 1.8% compounded rate means a doubling of supply every 39 years. Global fiat? 12.8% means a doubling of supply *every 5.7 years.* Now we can start to understand the differences between these monies.
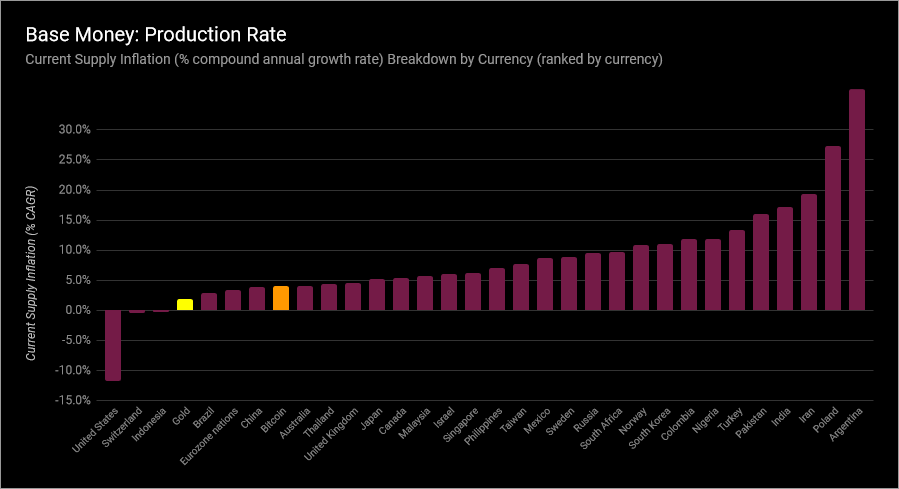
31/ We should soon say something about "price inflation." But first, let's go ahead and show these global fiat base money compound growth rates each year, as we did with gold. Remember, this is not "price inflation," but "money stock inflation"…

32/ The prior chart once again was historical growth, weighted since 1970. Here is the current breakdown, but this time we are showing the inflation rates of the past 12 months, so note these rates will be different.

33/ Note on both previous charts: this "global" fiat unit base money inflation rate was calculated using a weighted factor of each base money supply (weighting respective US$ value during that period, and applying that factor to each fiat currency's actual inflation rate).
34/ Another note on prior charts: not all CB balance sheets are available from 1970. For those that weren't, they didn't factor into that period. Example, US$ weight was 66% in 1970, and is only 18.5% of the total today, as (among others), data on China only began in Dec-1999.
35/ Yet another note on prior charts: the compound annual growth rates were always calculated from *monthly* fiat unit growth, and compounded to annual (to the 12th exponent). This is necessary due to cases like Brazil, which has had 6 different currencies since 1969 alone.
36/ Continuing last note, a compounded annual growth rate of currency units since 1970 doesn't make sense for Brazil. So the *monthly* rate must be taken across time and then compounded, ignoring those 6 months when the government reset (slashed zeroes) from the old currency.
37/ And final note here, the mechanics of this method - deriving compound annual growth from "average monthly" growth - was repeated this way also for gold's growth (and the other asset we will soon get to), for consistency.
38/ OK, so the chat thus far has been all about the base money supply & its inflation rate, but what about "price inflation?" To be clear, we should stress, this analysis is *not considering prices at all*; rather, this is only about the base money stock and its actual growth.
39/ Milton Friedman said, "Inflation is always and everywhere a monetary phenomenon." He meant *price* inflation (not graphed here) always and everywhere follows *money* inflation (painstakingly graphed here).
40/ Now isn't the time to judge (in)accuracies of indexes like CPI, but what we can say here is that, at the very least, and ceteris paribus (meaning if no change in the demand for money), a growing base money supply will always undermine that money's purchasing power.
41/ So we have gold's money supply, and we see why it's been hard money. We have fiat's base money supply, and we see why it's not nearly as hard as gold. No surprise many nations suffer from hyperinflation. Is there something else that can compare with these base money supplies?
42/ As a matter of fact, there is… #Bitcoin.
43/ Bitcoin has the characteristics of global base money. Bitcoin is hard money. Bitcoin is settlement media. If you own bitcoins on-chain, you own an asset that is also 100% your equity, and no one else's liability.
44/ Beginning in only 2009, bitcoin's supply increase is now running at a 4.1% annual rate. Compare that with fiat's trailing 12-month inflation rate of 1.8%, and gold's 1.9% inflation rate.
45/ Notice the phrase "supply increase" for Bitcoin, and not "inflation rate." This is a topic for another post, but Bitcoin's inflation is already "baked in." Everyone knows its max supply: 21 million coins. In fact, we can actually predict this rate of increase until 2140.
46/ Curious what that number is? From 2018 until 2140, the Bitcoin system will only "inflate" at a compounded rate of *0.15% per year*. And "inflate" is not the best term. It's more like "issue coins"…because the total supply is already known by all... unlike fiat, or even gold!
47/ So we can compare bitcoin's *current* issuance rate to gold's *current* inflation rate. As shown, gold currently increases only 1.9% per year, so Bitcoin's current 4.1% compounded issuance rate is a bit more than 2x faster than gold… for now. See the following chart.

48/ As Bitcoin is mathematical money, adjusting its difficulty every 2 weeks, adding new coins automatically every 10 minutes, Bitcoin's system will continuously issue a lower rate of new coins, until it becomes harder than gold's annual supply increase, by the mid-2020s.
49/ It is true, Bitcoin's *lifetime*, average issuance rate still looks high (75%), due to its very fast supply increase in the first two years. But unlike fiat base money, or even gold, it is mathematically certain that Bitcoin's supply will never increase that fast again.
50/ Yes, the Bitcoin max supply is a function of distributed consensus, but from Bitcoin's illustrious, unyielding short history, each day adds more confidence in this money supply never changing. See the current supply curve here (monthly frequency, like the others).

51/ Think of base money this way. You *can't* have ""money"" in:
❌ Real estate (you just own real estate)
❌ Stocks (you just own stocks)
❌ Bonds (you just own bonds)
These are all assets, indeed, and they each have benefits, but also counterparty risk and varying liabilities.
❌ Real estate (you just own real estate)
❌ Stocks (you just own stocks)
❌ Bonds (you just own bonds)
These are all assets, indeed, and they each have benefits, but also counterparty risk and varying liabilities.
52/ Think of base money this way. You absolutely hold ""money"" when you hold:
😬 A banknote (BUT, it is the liability of a central bank, hopefully they manage it well...)
✅ A gold coin (AND it is no one else's liability)
✅ A bitcoin (AND it is no one else's liability)
😬 A banknote (BUT, it is the liability of a central bank, hopefully they manage it well...)
✅ A gold coin (AND it is no one else's liability)
✅ A bitcoin (AND it is no one else's liability)
53/ So what has been displayed here are three global base money supplies: fiat reserve money, gold, and bitcoin. Base money is the "transmission mechanism" of the global economy. Gold once was, fiat is now, and bitcoin very well could be in the future.
54/ Base money is the thing that settles any and all outstanding liabilities. It is the ultimate asset of settlement. It is "settlement media" of exchange. Banks and central banks, at the end of the day, settle with base money.
55/ So when you hear someone compare bitcoin's (or gold's) supply to USD M1, or EUR M2, you can now redirect them here. :) The *only fiat money supply* which economically compares is the base money of all central banks.
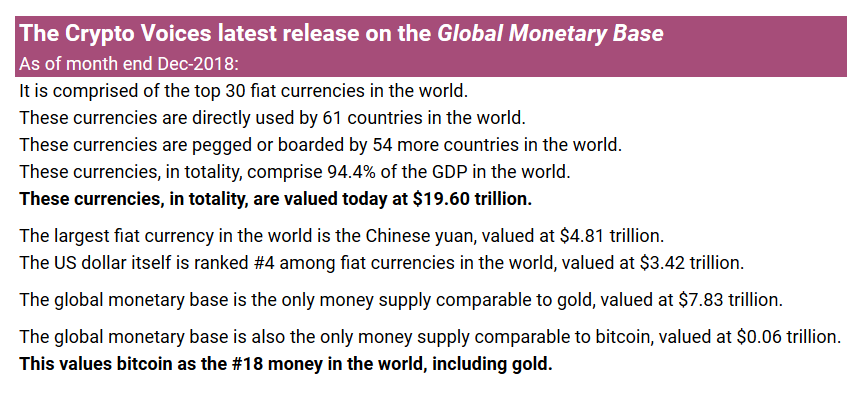
Where does Bitcoin rank globally? #18.
USD? #5.
Gold? #1.
Where does Bitcoin rank globally? #18.
USD? #5.
Gold? #1.
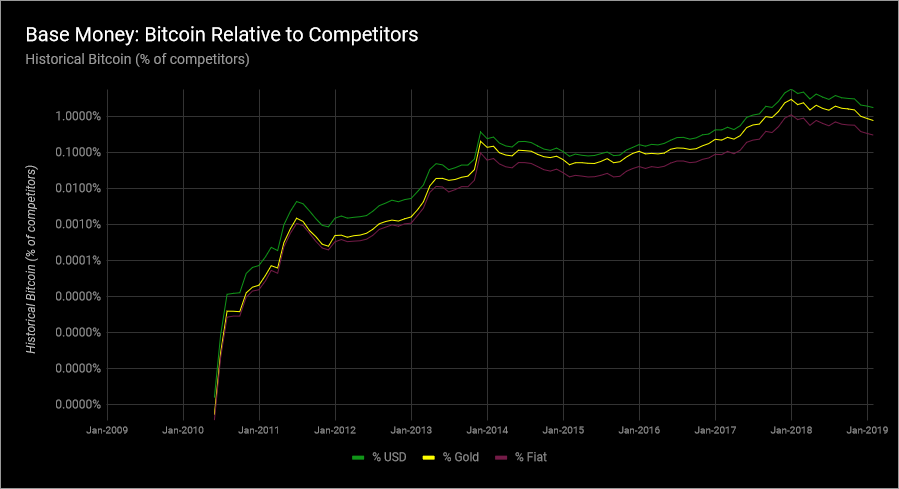
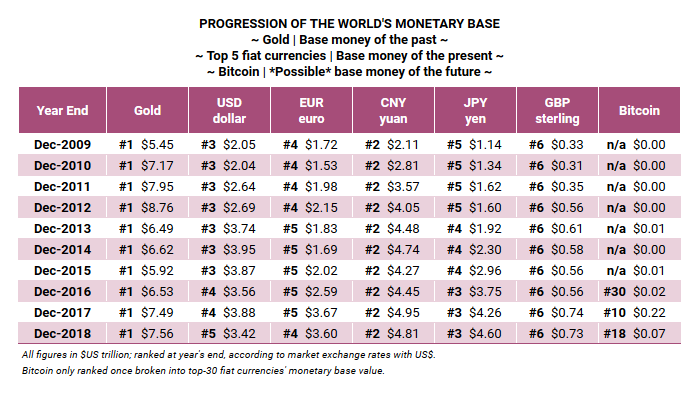
56/ Maybe you would like to see a historical progression of #bitcoin and global base money over the last 10 years. It is here. Bitcoin first broke into the top 30 currencies in 2016.
57/ A few closing remarks. This isn't about "all or nothing" in money, or attempting to expose the current fiat money system as completely inept. There certainly is some value and efficiency in having a payment system based on *claims* to base money, i.e. checking accounts (M1).
58/ There has been plenty of research done by experts showing a payment system based on claims can work fine, particularly when central banks aren't meddling around with a monopoly causing distortions, and the base money is gold.
59/ But we've also seen worse. Hyperinflations and collapsed economies abound throughout history, no less than 50 in the 20th century alone. The sardonic slogan of the Soviet Union's labor market was literally "they pretend to pay us; we pretend to work."
60/ The "unseen" is always at play, when unsound money is at play. Certainly not saying the current payment system cannot allocate resources. The real questions are, how effectively is capital being allocated, under whose direction (and monopoly), and at what cost to society?
61/ On our podcast @crypto_voices, @fernandoulrich and I explore the varying nuances of Bitcoin as a base money contender, and we look forward to continuing this discussion with you.
62/ The penultimate graphic is a summary of all items. Print it out if you like. The base money of 115 nations is included, as well as gold's money supply, as well as Bitcoin's money supply. It is a supply-side summary of nearly all base money in the world.

63/ The exhibits are also located here: cryptovoices.com/basemoney Fiat base money is sourced from central bank balance sheets, wonderful gold history from Nick Laird, and bitcoin from @Blockchain and @coinmarketcap.
64/ To be sure, today in 2019 the unit of account here must be in US$ for comparison. Notice the prices per bitcoin if the Bitcoin network "absorbs" the fiat money supply value, or gold's (or both). These are calculations *only* for general reference, not predictions.
65/ Nonetheless, if Bitcoin truly takes over as global base money, then an orderly (or disorderly) exchange rate capture of at least $1 million per bitcoin (1 cent per satoshi) is certainly not outside the realm of possibility.
66/ Remember, Bitcoin is unlike anything else in the (financial) world! But, if you do want to make the comparison, the *only* money supply you can economically compare it with is the *global monetary base*, not M1, M2, or M3!
67/ This penultimate tweet reflects all of these base money supplies put together (not stacked). Note it is quite hard to see Bitcoin's supply in this chart.

68/ The final three graphics more allow us to more easily compare Bitcoin across all base monies. We do see that Bitcoin has a long way to go to truly compete. But to be sure, if Bitcoin does absorb gold and/or fiat money's value, then that will be the true #flippening.
/fin
/fin