,
13 tweets,
4 min read
Read on Twitter
S/X Delivery Thread:
1/13
With the final week of the Quarter beginning and the delivery wave upon us, lets take a look back at the abysmal S/X deliveries and see if we can draw some conclusions.
1/13
With the final week of the Quarter beginning and the delivery wave upon us, lets take a look back at the abysmal S/X deliveries and see if we can draw some conclusions.
2/13
As documented by @TeslaCharts & @fly4dat the S/X has had a rough go at it in the EU this Quarter. Sad.
As documented by @TeslaCharts & @fly4dat the S/X has had a rough go at it in the EU this Quarter. Sad.
3/13
And although much attention has been put on the lackluster M3 demand in the US, InsideEVs, also shows us that S/X demand has been all but impressive.
And although much attention has been put on the lackluster M3 demand in the US, InsideEVs, also shows us that S/X demand has been all but impressive.
4/13
Although it may seem obvious, these EU/US data points paint a pretty ominous picture of what Q1 S/X Demand. Lets have a look.
Although it may seem obvious, these EU/US data points paint a pretty ominous picture of what Q1 S/X Demand. Lets have a look.
5/13
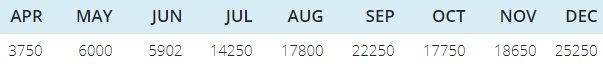
Using the Eu-Evs database, InsideEvs monthly prints, and Tesla reported S/X deliverers we can observe that the United States, NL, NO & Spain account a substantial portion of world demand.
Using the Eu-Evs database, InsideEvs monthly prints, and Tesla reported S/X deliverers we can observe that the United States, NL, NO & Spain account a substantial portion of world demand.
6/13
In fact, in the most recent quarter, these 4 countries accounted for 93% of Tesla's reported S/X deliveries... And since the trade war with china started at the beginning of Q3, these countries have accounted for at least 85% of S/X deliveries.
In fact, in the most recent quarter, these 4 countries accounted for 93% of Tesla's reported S/X deliveries... And since the trade war with china started at the beginning of Q3, these countries have accounted for at least 85% of S/X deliveries.

7/13
Since EU-Evs database is updated almost daily we have a pretty good idea of EU m3 deliveries. Which means we can make some predictions.
Since EU-Evs database is updated almost daily we have a pretty good idea of EU m3 deliveries. Which means we can make some predictions.

8/13
If we go back through the past 4 quarters and subtract out the deliveries from these 3 countries from Tesla's reported number, we can develop a US % of world demand less NL, NO, and SP.
If we go back through the past 4 quarters and subtract out the deliveries from these 3 countries from Tesla's reported number, we can develop a US % of world demand less NL, NO, and SP.

9/13
Using insideEVs Jan/Feb deliveries and the percentages which are delivered in the US, we can make some predictions about world demand outside the US then add back in the 3 EU countries we have data for.
Using insideEVs Jan/Feb deliveries and the percentages which are delivered in the US, we can make some predictions about world demand outside the US then add back in the 3 EU countries we have data for.

10/13
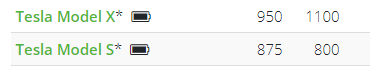
I call this the "Choose Your Own Adventure Table". To use this table simply pick what you think the S and X March deliveries will be (if you pick 2000 that would be 2000 S and 2000X for a total of 4000 vehicles) and what you think the US percent of world demand is.
I call this the "Choose Your Own Adventure Table". To use this table simply pick what you think the S and X March deliveries will be (if you pick 2000 that would be 2000 S and 2000X for a total of 4000 vehicles) and what you think the US percent of world demand is.

11/13
Keep in mind Since the Trade war started it appears that US demand will account for somewhere between 70-80% of the world total outside the 3 EU countries.
Keep in mind Since the Trade war started it appears that US demand will account for somewhere between 70-80% of the world total outside the 3 EU countries.
12/13
Using that percent range and a march delivery number somewhere between 3000 and 2000 (3000 was last years S/X march number and 2000 is to account for lower S/X volume as described by SGF) we get what i believe to be the most likely range for S/X Q1 deliverers.
Using that percent range and a march delivery number somewhere between 3000 and 2000 (3000 was last years S/X march number and 2000 is to account for lower S/X volume as described by SGF) we get what i believe to be the most likely range for S/X Q1 deliverers.

13/13
The Average of these 6 numbers is 12,551 which would represent a 42% decline in S/X sales from Q1 of last year... #growthcompany
Thanks for reading.
The Average of these 6 numbers is 12,551 which would represent a 42% decline in S/X sales from Q1 of last year... #growthcompany
Thanks for reading.