,
11 tweets,
6 min read
Read on Twitter
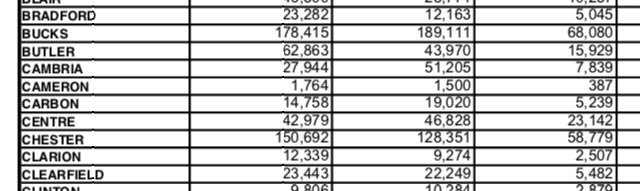
Something is very off with voting in Cambria PA.
45,512 registered Democrats (55% of the county)
29,947 reg GOP
7,932 reg Independent
1/
45,512 registered Democrats (55% of the county)
29,947 reg GOP
7,932 reg Independent
1/
2016 Primary Cambria PA
18,040 voted for Democrats
16,573 voted for GOP in the Primary
Democrats got 52% of Primary votes (3% less than registered Democrats in Cambria)
2/
18,040 voted for Democrats
16,573 voted for GOP in the Primary
Democrats got 52% of Primary votes (3% less than registered Democrats in Cambria)
2/


18,040 Democratic votes in the Cambria, PA 2016 Primary BUT...
In the General HRC only got 18,867 votes, just 827 more Dem votes than in the Primary? 🤔
Democrats had 52% of the vote in the Primary but it dropped to 30% In the General
3/
In the General HRC only got 18,867 votes, just 827 more Dem votes than in the Primary? 🤔
Democrats had 52% of the vote in the Primary but it dropped to 30% In the General
3/

It wasn’t a downward swing just for HRC. We saw a similar swing w/ the 2016 PA Senate seat
52% of voters voted Democratic in the *Primary* but in the *General* only 35% voted Dem (only 48% of registered Dems)
GOP got 100% of ALL registered GOP & 98% Ind votes.
5/
52% of voters voted Democratic in the *Primary* but in the *General* only 35% voted Dem (only 48% of registered Dems)
GOP got 100% of ALL registered GOP & 98% Ind votes.
5/

From 2014 there was a 14.7% decrease in registered Democrats and a 21.1% increase in registered GOP in Cambria PA
There’s 83k registered voters in Cambria AND at least 21% of the changed their registrations!?! 🍌
#ThatsNotNormal
6/
There’s 83k registered voters in Cambria AND at least 21% of the changed their registrations!?! 🍌
#ThatsNotNormal
6/

Shocked Trump won the county by 67%, National Geographic & the Gaurdian sent documentary filmmakers there to figure out how it could have flipped so dramatically.
7/
7/

The county still votes largely Democratic in State & Local elections.
And it votes Democratic in POTUS Primaries.
But, when it comes to POTUS General elections it flips upside down. Not just in 2016...
8/
And it votes Democratic in POTUS Primaries.
But, when it comes to POTUS General elections it flips upside down. Not just in 2016...
8/


Dems got 16k votes in the 2012 Primary, 2X more than GOP primary votes in a re-elections yr. Only 28% of registered GOP voted in the 2012 primary
👀 in the 2012 General
Romney 35,173 (58%)
Obama 24,299 (40%)
In 2012 Cambria was 59% Dem #Flipped
9/
👀 in the 2012 General
Romney 35,173 (58%)
Obama 24,299 (40%)
In 2012 Cambria was 59% Dem #Flipped
9/
In the 2012 General election Democrats got only 47% of registered Democrats votes.
But Dems got 2X more democratic votes in t 2012 Primary
In the 2016 General Dems got only 41% of registered Democrats votes
#CambriaPA needs to secure 🗳 systems
/11 end
But Dems got 2X more democratic votes in t 2012 Primary
In the 2016 General Dems got only 41% of registered Democrats votes
#CambriaPA needs to secure 🗳 systems
/11 end
One more!
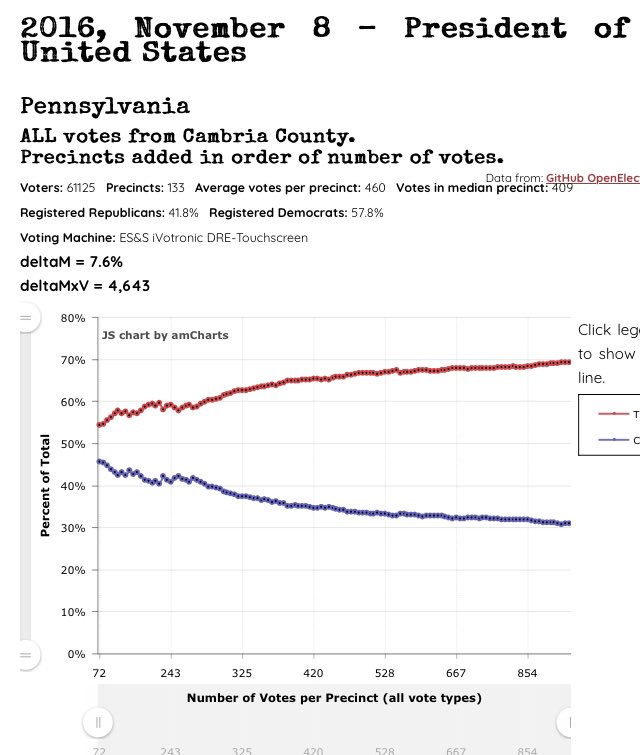
We see this over & over in these questionable elections.
Once again, as the size of the precinct increases (voters per precinct) so does the GOP %. This is NOT possible without vote manipulation.
#Hacked #GOPCheats
We see this over & over in these questionable elections.
Once again, as the size of the precinct increases (voters per precinct) so does the GOP %. This is NOT possible without vote manipulation.
#Hacked #GOPCheats