,
6 tweets,
3 min read
Read on Twitter
I don't recall American farmers being "forgotten".
Let me check.
1/6
Let me check.
1/6

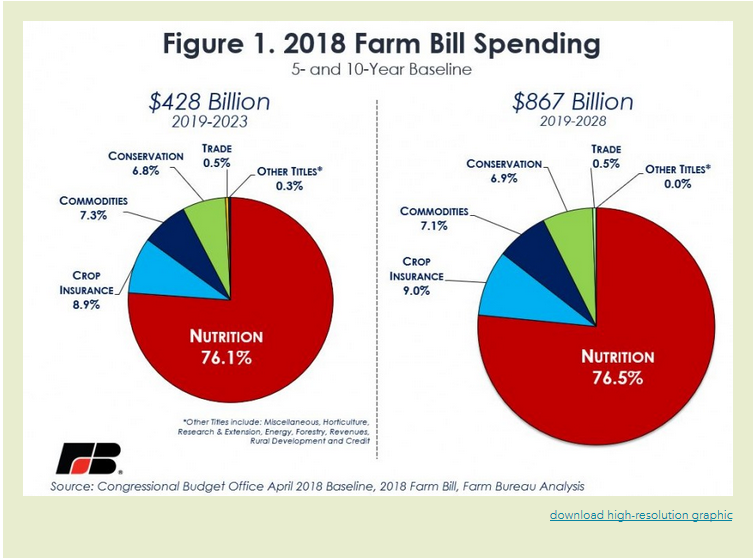
Here's the American Farm Bureau Federation, "the voice of agricultural producers at all levels"
2018 Farm Bill. $428bn for 5 years, $867bn for 10.
2/6
fb.org/market-intel/r…
2018 Farm Bill. $428bn for 5 years, $867bn for 10.
2/6
fb.org/market-intel/r…
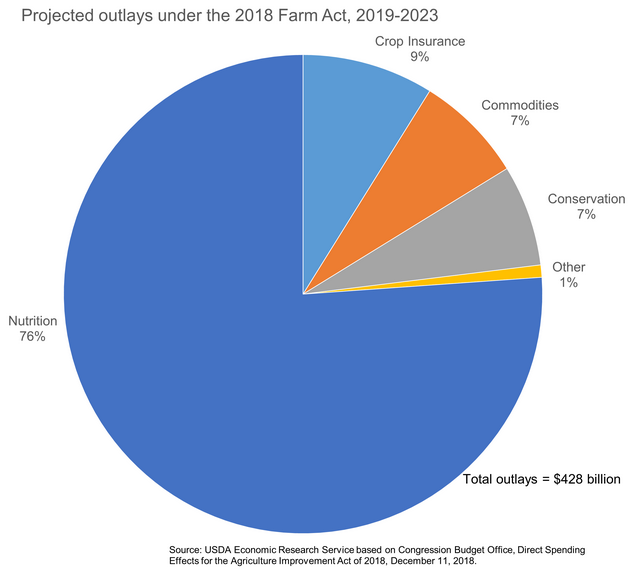
And here's the US government (US Dept of Agriculture). Same numbers.
3/6
ers.usda.gov/topics/farm-ec…
3/6
ers.usda.gov/topics/farm-ec…
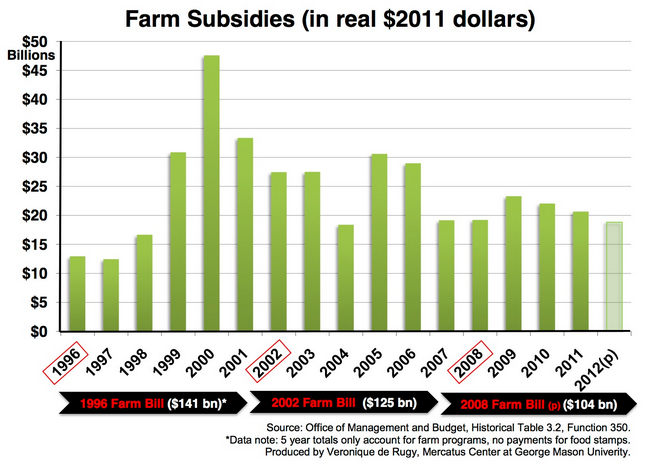
Here's the US President's Office of Management and Budget (processed by Veronique de Rugy of Mercatus Center). US farm subsidies, currently around $20–25bn annually
4/6
mercatus.org/publication/hi…
4/6
mercatus.org/publication/hi…
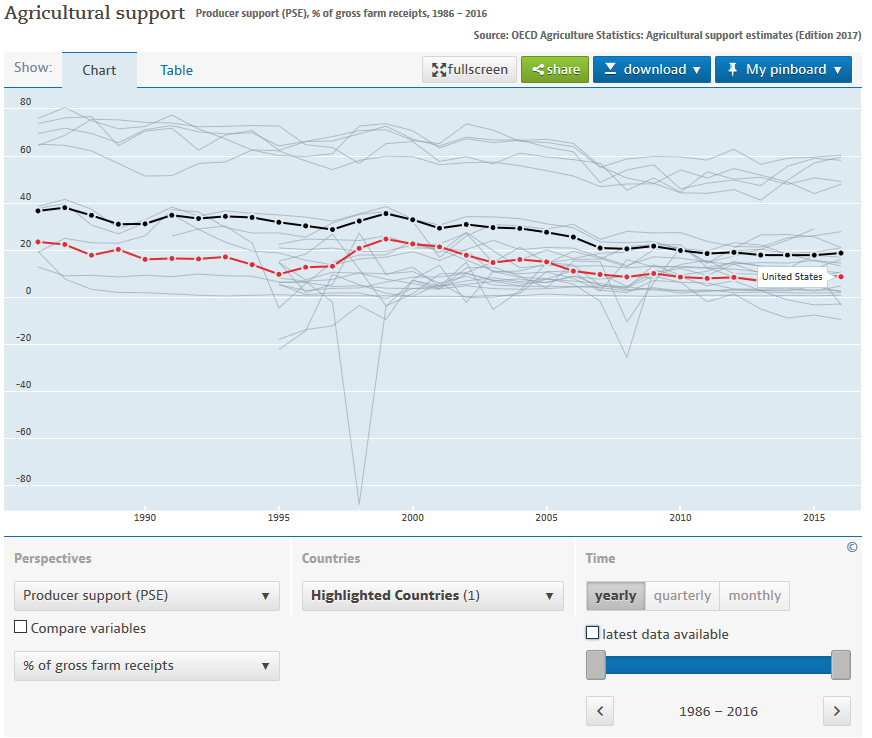
Here's the OECD, producer support estimate (PSE), ie, the percentage of farmers' incomes arising from government intervention or other policies
For the US, about 20% of farmers' incomes is from direct or indirect support
5/6
data.oecd.org/agrpolicy/agri…
For the US, about 20% of farmers' incomes is from direct or indirect support
5/6
data.oecd.org/agrpolicy/agri…
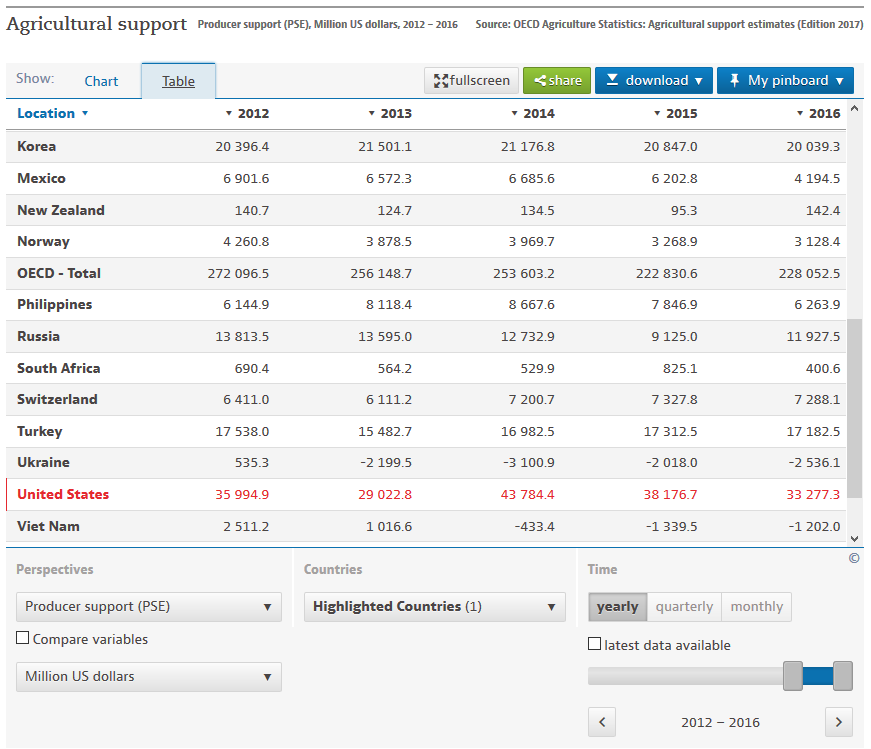
And here's the OECD producer support estimate (PSE) in dollars, showing $29–44bn, 2012–2016.
PSE = amount of farmers' income from direct or indirect government support
6/6
data.oecd.org/agrpolicy/agri…
PSE = amount of farmers' income from direct or indirect government support
6/6
data.oecd.org/agrpolicy/agri…