The repo drama of last month brought bank liquidity back to the spotlight. How lucky are we that the ECB disclosed the results of its stress this week! Plenty of insights there, so bear with me. (Warning: geeky thread.)
Before getting into the details you must understand two things: (i) this is a stress test on no name basis and (ii) liquidity regulations are mostly driven by the LCR (Liquidity Coverage ratio) and that stress test is not a binding constraint.
So what’s the point, you might ask? Well, three things.
1) As we will see the stress test could impact the LCR – and this might be the most important take away.
2) The stress test will be used as input for the SREEP, i.e. to calculate capital requirements for banks and this has direct implications on balance sheet growth and capital return to shareholders.
3) It’s a treasure of trove of data.
What is useless, however, are the red flashy headlines such as “half the banks would not survive more than six months” bullshit. This test is designed to identify weaknesses, it is designed to see banks face a shortage of liquidity.
Quickly, how is the test designed: on a bank by bank basis, an assumption of capital market closure + rating downgrades and deposit outflows that vary according to the severity of the scenario.
One word on the scenarios: they are calibrated on past events and clearly we have a vicious circle here with the very odd case of Popular. The bank isn’t named but I am pretty sure that it is the blue line there. 

If the rumors that this corporate deposit outflow was organized are true, and if this then feeds into policy, it’s a serious concern.
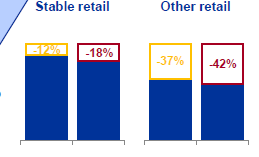
Another interesting point on the scenario is that deposits <100k (i.e. guaranteed) are considered more stable. This is yet another regulatory advantage for those deposits…
…but they are also the deposits that banks can’t really price at negative rates. Houston, we have a problem there and serious schizophrenia. And the scenario differences are huge (% outflows in 6 months):
In terms of the outcome of the test, banks are assessed on three criteria: their survival period (how long before cash turns <0), the data quality and the cliff effect. I’d argue that paradoxically the survival period is the less important because it’s very theoretical.
First, the survival period. The main result in extreme scenario is this.
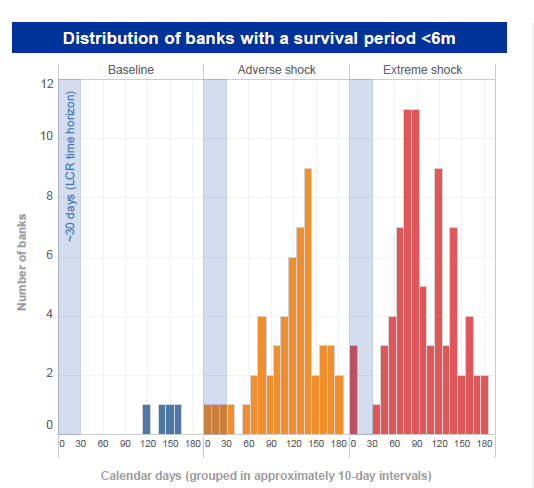
Honestly, I wouldn’t worry about this. Except maybe the 4 banks with shitty results in the base line and the 4 with poor results in the extreme, all the others should be fine –
Why? Simply because the regulatory constraint is only 30 days and under less adverse shocks. Here we’re talking much more severe shocks and longer periods.
The main reason EU banks are so resilient to liquidity shocks is this (and that is a MAJOR difference with US banks.) QE is the reason for the 9%, LCR is the reason for the 7% and 1% but the big difference with the US is the 6% and that’s a lot.
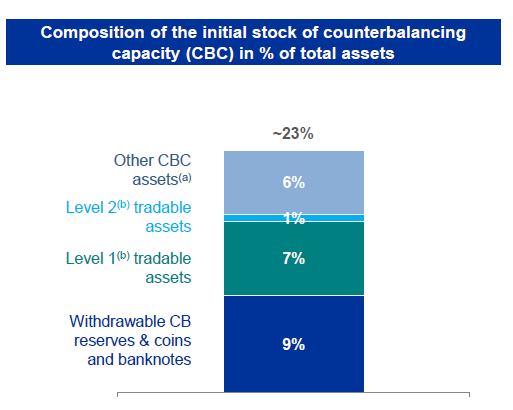
EU banks benefit from an open-ended refinancing facility at the ECB and from much more extensive collateral eligibility. In fact, the real buffer is even bigger, as shown below.

Banks have 12% of assets that can easily refinanced in a way that is not available in the US.
There are two other very interesting snippets in the survival period data.
The first is the impact of the business model (yeahhh, Deutsche Bank Twitter aficionados this is where you can step in.) Clearly GSIB have a much more challenging liquidity profile.
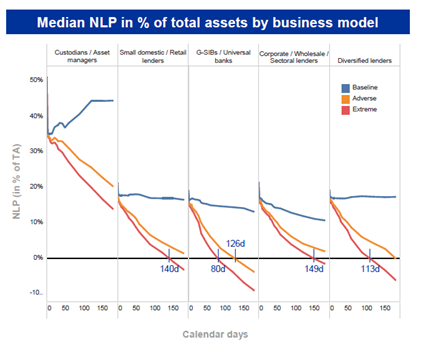
And the reason is clear from another chart: repo funding is bigger at GSIB, deposit funding is lower.

The second snippet is this: what about the dollar? Well, the Fed’s balance sheet policy has clear effects even in Europe. The median extreme survival period is 125 days in EUR but only 57 days in USD! That’s a HUGE difference.
Of course, that’s partly driven by the test’s assumptions since EU banks have limited USD deposits, but still significant.
The second big part of the test is the data quality issue / LCR issue. This is very important because it’s the part which could change something about bank liquidity management.
There are two main areas to watch here. The first one is collateral management, i.e. how do bank manage the collateral they can use for central bank funding. And This chart is quite extraordinary.
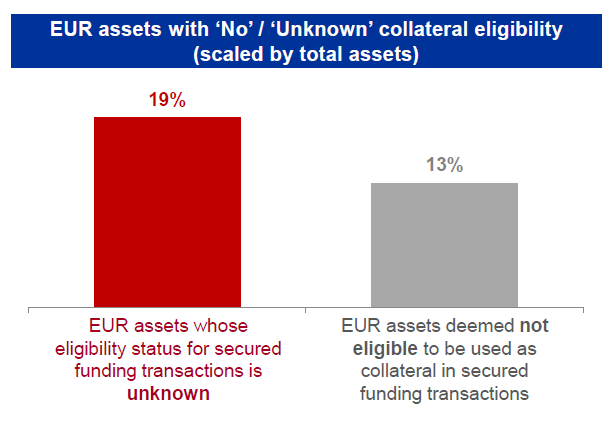
Yep, you read that correctly. For 19% of EU EUR banking assets, banks don’t have a f*** clue whether they can be refinanced at the ECB!! (This reminds me of the most extraordinary story of my career, but maybe another time.)
Honestly, that’s nuts.
The second big area is the LCR, with (again) two topics.
Topic #1: many banks have been wrong in their LCR calculations. Ouch. This mostly relates to the fact that deposits have been misclassified. (retail or not, stable or not, etc.)
As the ECB puts it : “On average banks changed 25% of data points following ECB enquiries” And several banks had to reduce their LCR figures post enquiries. This is NOT good.
But the topic #2 is even worse. Believe or not, the ECB has identified banks that are gaming the LCR ratio. Nooooooo! Really? Can’t believe it. Through collateral swaps or maturity optimization they game the 30-day ratio.
The ECB has two ways to see this.
First they calculate a cliff effect, i.e. the 35-day LCR ratio vs 30-day. When I read this, it actually made me laugh out loud. Such a funny way to catch the cheaters! We don’t have names, but some did game the rules.

The second way is more statistical and is the most fascinating chart in this report buried in the annex.
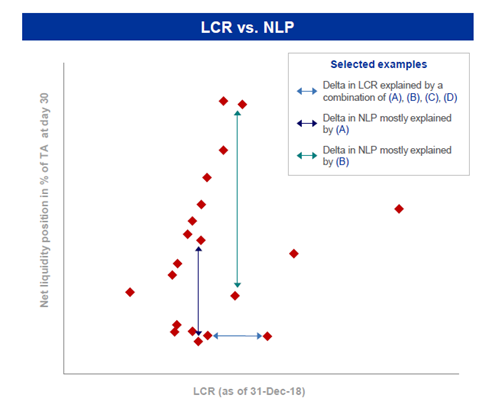
Amusingly, the chart is only for GSIBs. Could it possibly that they are the most prone to game the rules? Anyway, you can clearly show the “reasonable” banks which have a nice linear relationship between the two metrics…
And the gaming ones which are the clear outliers on the regression line (and all below the line of course.) Again, no name and the ECB was even careful enough to remove the scale to prevent anyone from double guessing!
Finally, the last takeaway of the test is that it will feed into the SREP and capital requirements. The ECB states that it will use mostly two metrics: the survival period and (& this is innovative) the cliff effect, i.e. how much did banks game the rules.
When you see that kind of liquidity profile, with a big cliff of cash outflows just after the LCR horizon, you can understand that the supervisor is a bit pissed off!

Ultimately this translates into a liquidity score from 1 to 4 with EU banks not scoring very well.

But I hope my thread has made one thing clear: if they’re not scoring well, it's more because of data quality issues, poor collateral management processes and abuse of the LCR rules. Not because any of them is going to be bust soon.
Sorry, this thread was way too long and I wish I could have included more Deutsche Bank fun, but hey, it's a no name basis and I followed the rules 😅