~1.7 million 🇬🇧 UK people may be #COVID19 infected.
~3% or 1 in 39. ~6% in London.
Assume: 1019 dead; IFR 0.9%; Adj. days to death ~13.
So ~113k infected 13 days ago
~3.25 days to double so ~4 doublings
So infections to date: ~1.8m, ~5% recovered so ~1.7m infected.
~3% or 1 in 39. ~6% in London.
Assume: 1019 dead; IFR 0.9%; Adj. days to death ~13.
So ~113k infected 13 days ago
~3.25 days to double so ~4 doublings
So infections to date: ~1.8m, ~5% recovered so ~1.7m infected.
London estimates are based on yesterday's 32% of UK "confirmed cases" - not on separate doubling rates.
Implies ~467k current infections in London, or ~6% of the population.
Within the range mentioned by @neil_ferguson in S+T cttee:
Implies ~467k current infections in London, or ~6% of the population.
Within the range mentioned by @neil_ferguson in S+T cttee:
Whole model is v.v.sensitive to inputs, so low confidence + wide ranges apply.
More deaths --> more infections
Higher IFR% --> fewer infs (don't need as many for same deaths)
Longer days to death --> more infs (more time to double)
Higher doubling rate --> more infs
More deaths --> more infections
Higher IFR% --> fewer infs (don't need as many for same deaths)
Longer days to death --> more infs (more time to double)
Higher doubling rate --> more infs
I'm now using "Adjusted days to death".
Mean days to death still estimated at ~18.5.
However, given exponential growth of infections, a higher proportion of deaths to date were caused more recently than that average. Hence adjusted to ~13 days.
Thanks to @cheianov!
Mean days to death still estimated at ~18.5.
However, given exponential growth of infections, a higher proportion of deaths to date were caused more recently than that average. Hence adjusted to ~13 days.
Thanks to @cheianov!
Gov data on "recovered" has been stuck at 135 for days now, but was about 2-3%.
arcgis.com/apps/opsdashbo…
Given "cases" are only the most serious (we ~only test in hospital) I've used higher recovery rate 5%.
Given exponentials, vast majority of those ever infected still are now
arcgis.com/apps/opsdashbo…
Given "cases" are only the most serious (we ~only test in hospital) I've used higher recovery rate 5%.
Given exponentials, vast majority of those ever infected still are now
Counter-intuitively, the stronger your health services are in the early stages, the higher the number of infections must have been to generate the actual deaths to date.
Strong NHS means more days to death which gives infections more doubling periods since the infection point.
Strong NHS means more days to death which gives infections more doubling periods since the infection point.
Also maybe counter-intuitively, the more deadly the disease is (infection fatality rate %), the fewer infections were needed 2-3 weeks ago to have generated the deaths you see today.
If it's less deadly, there must have been many more infections to drive the deaths.
If it's less deadly, there must have been many more infections to drive the deaths.
If we were doing population sample testing (as promised here) gov.uk/government/new… we could observe the infection doubling rate.
As nothing has been published on this, I've used lagged death + confirmed case doubling rates over last 2-3 weeks as proxies.
As nothing has been published on this, I've used lagged death + confirmed case doubling rates over last 2-3 weeks as proxies.
This would imply total UK death toll of ~16k...
But only if IFR remains 0.9% + we see zero new infections.
Sadly, neither of the above are sound assumptions.
If our ICU capacity is overrun, the IFR% will spike hard.
New infections depends on hard #Lockdown + test/trace.
But only if IFR remains 0.9% + we see zero new infections.
Sadly, neither of the above are sound assumptions.
If our ICU capacity is overrun, the IFR% will spike hard.
New infections depends on hard #Lockdown + test/trace.
A wave is crashing over our ICUs.
We can't reduce the size of that wave because it's caused by infections from 2-5 weeks ago.
We can improve our readiness by scaling ICUs + protecting NHS staff.
We can stop the wave getting bigger + longer by hard #Lockdown + test/trace.
We can't reduce the size of that wave because it's caused by infections from 2-5 weeks ago.
We can improve our readiness by scaling ICUs + protecting NHS staff.
We can stop the wave getting bigger + longer by hard #Lockdown + test/trace.
A less pessimistic view? If #Lockdown has already helped slow infection doubling over last 3 weeks to every 4 days, takes # infections down to ~1m.
Still projects 10k death toll assuming ICUs not over-run and zero new infections from today.
Neither are sensible assumptions.
Still projects 10k death toll assuming ICUs not over-run and zero new infections from today.
Neither are sensible assumptions.
It's tempting to think... "There's 1019 deaths and #Covid19 kills about 1 in 100, so there must be ~113k infections".
The problem is you're nearly right. But those ~113k infections were 2-3 weeks ago. That's how long it takes to kill.
They've been doubling every 3-4 days since.
The problem is you're nearly right. But those ~113k infections were 2-3 weeks ago. That's how long it takes to kill.
They've been doubling every 3-4 days since.
This isn't the best way of estimating % infected!
It's waiting for people to die, assuming fatality rate to judge how many infections drove those deaths, then using doubling rates to judge infections today.
A better way? Population sample testing!
It's waiting for people to die, assuming fatality rate to judge how many infections drove those deaths, then using doubling rates to judge infections today.
A better way? Population sample testing!
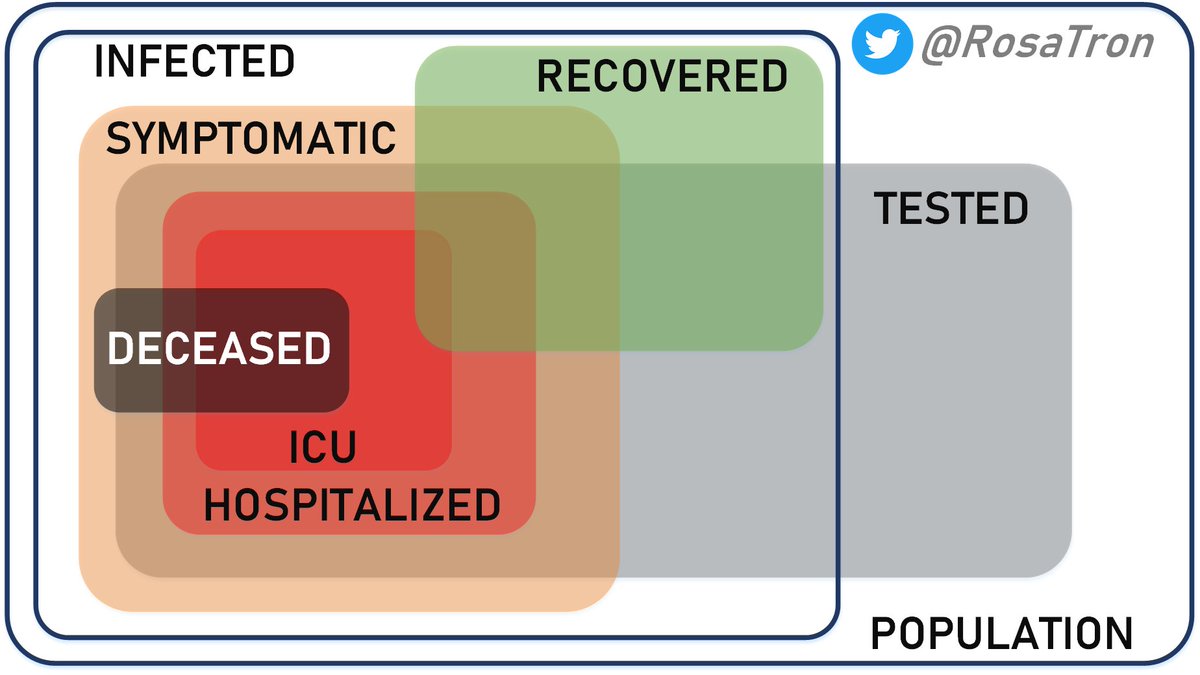
Why is estimating # infected more important than just tested "cases"?
1⃣ Infected people are doing more infecting. The "cases" are mostly in hospital or dead.
2⃣ If you know # infected and # deaths you can assess how deadly this thing really is (IFR%, not just "case" fatality)
1⃣ Infected people are doing more infecting. The "cases" are mostly in hospital or dead.
2⃣ If you know # infected and # deaths you can assess how deadly this thing really is (IFR%, not just "case" fatality)
3⃣ Telling public % infected helps us comply with hard #Lockdown.
BJ's speech should have started:
"There are infected people in every train, in every shop, in every park, in every tube... you might even be one of them... please take what I am about to say very seriously..."
BJ's speech should have started:
"There are infected people in every train, in every shop, in every park, in every tube... you might even be one of them... please take what I am about to say very seriously..."
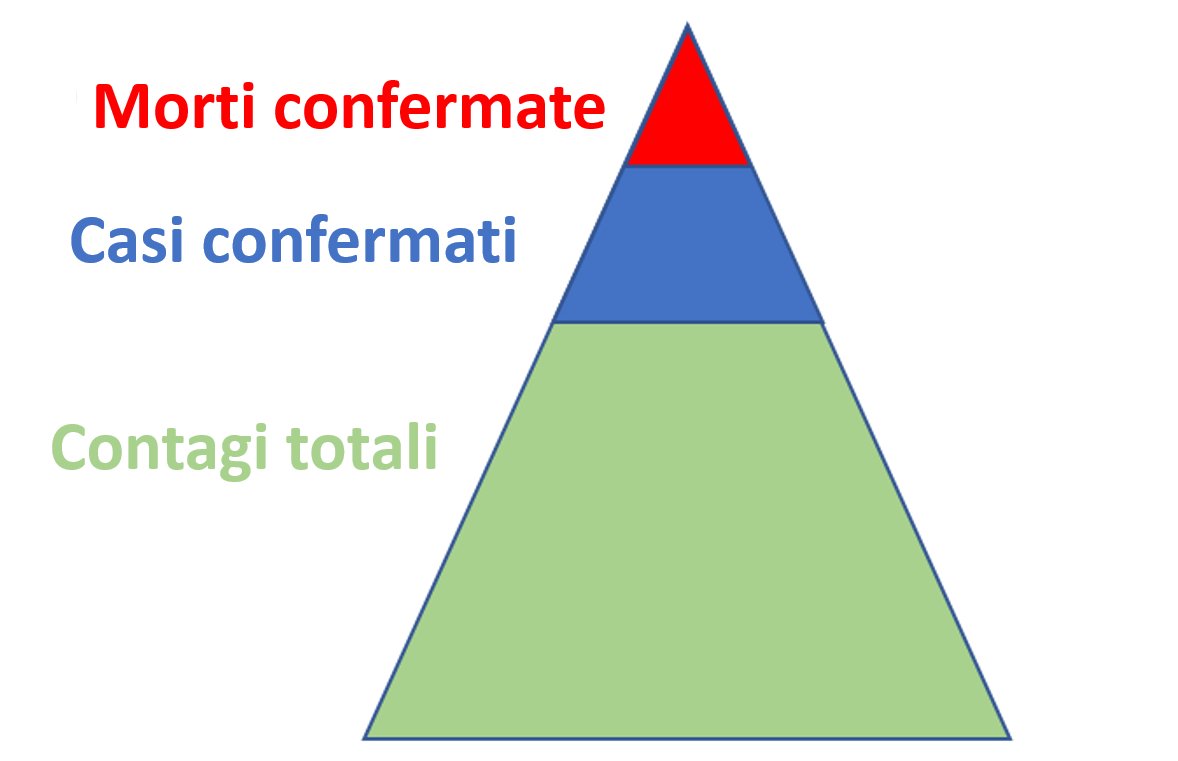
Instead, we continue to talk about the ~17k "confirmed cases".
These are just the tip of a very large, deadly iceberg.
These are just the tip of a very large, deadly iceberg.
If we'd started estimating % infected curves from day one (ideally via. pop. sample testing), we might have acted more quickly.
We might also have seen better compliance with our eventual #Lockdown.
As it is... "a national scandal" @richardhorton1
thelancet.com/journals/lance…
We might also have seen better compliance with our eventual #Lockdown.
As it is... "a national scandal" @richardhorton1
thelancet.com/journals/lance…
@threadreaderapp unroll