(1/8) #ECB today published an update on govvie purchases under PEPP (Aug-Sep) & PSPP (Sep) which shows the huge benefit from PEPP in terms of purchase pace & capital key deviation during times of stress.
(2/8) For example, total PEPP purchases of non-supra govvies slowed in Aug/Sep from EUR184BN in June/July to only EUR121BN. Partly this is seasonal, as August is a stale month for markets. But this also reflects the prior need to front load PEPP purchases.
(3/8) In terms of flexibility, chart shows share of PEPP govvie purchases over the 3 periods for which data is available. In Aug/Sept, as well as slowdown in purchases, deviations from capital key were much smaller than earlier this year. Image
(4/8) #Italy has consistently benefitted from a greater purchase share relative to capital key (17%) but this slowed in Aug/Sept. #Spain has also, but less. Relative German and French under-purchases provided an offset. Image
(5/8)Total purchases of govvies across the euroarea in Aug/Sept and since March, in both PEPP and PSPP, shown below. Also shows expected purchases based on capital key alone (assuming Greece is in PSPP for simplicity.) Image
(6/8) Total PSPP/PEPP govvie purchases were close to capital key over summer, w/ #France being slightly “over purchases” w/ Italy & Spain & many others marginally “under purchased.” Since Mar, German & Dutch govie purchases have allowed for excess purchases in Italy and Spain. Image
(7/8) 2 observations: 1. while there has been normalisation of purchases over summer relative capital key, there is still substantial “catch up” towards capital key needed for Germany & relative under purchases of Spain Italy, though horizon over which will happen not clear.
(8/8) 2. PEPP flexibility served successfully as "yield spread control” as opposed to yield curve control. This feature of PEPP is something #ECB Gov Council could carry forward following monetary policy strategy review, but whether this will be legally possible remains unknown.

• • •

Missing some Tweet in this thread? You can try to force a refresh
 

Keep Current with Exante Data

Exante Data Profile picture

Stay in touch and get notified when new unrolls are available from this author!

Read all threads

This Thread may be Removed Anytime!

PDF

Twitter may remove this content at anytime! Save it as PDF for later use!

Try unrolling a thread yourself!

how to unroll video
  1. Follow @ThreadReaderApp to mention us!

  2. From a Twitter thread mention us with a keyword "unroll"
@threadreaderapp unroll

Practice here first or read more on our help page!

More from @ExanteData

7 Oct
(1/4) Update re #ECB Q-end balance sheet released today. Confirms adjustments to asset holdings which distorted the flow of asset purchases published Monday. *Applying these corrections shows PEPP purchases during wk ended 2 Oct were EUR13.1BN & total asset purchases EUR20.6BN*.
(2/4) This still represents a softening in the pace of net asset purchases from EUR29.5BN the previous week and the lowest for 4 weeks, but redemptions of EUR8BN across all programs during the week also weighed on the flow. Updated chart below: Image
(3/4) Eurosystem bank reserves/deposits increased EUR247BN during the week, driven by net EUR157BN increase in PETLTRO claims, EUR77BN reduction in gov deposits, & EUR12BN addition of liquidity due to asset purchases (adjusted.)
Read 4 tweets
7 Oct
**October 6th marked 6 months since MAX GLOBAL #lockdown**. That was achieved on April 6 when 76% of global cities had #traffic congestion down 40% y/y or more. Now, only 8% of cities have congestion down 40%. (see thread - 6mo mark) Image
Charts: Side-by-Side Comparison - Top 30 Global Cities Most Depressed #Traffic Congestion. April 6 (Max lockdown) % Oct 6. Apr 6 (left): smoothed shows cities Manila & Kuala Lumpur top 2. The US had 7 cities in top 30. #India had 4. Other cities included: #Wuhan #Paris #Istanbul Image
Oct 6: smoothed data (right) US has 2 of the 3 top cities: #Honolulu #SanJose. #TelAviv is top city most depressed traffic congestion. #China cities make list, but has to do w/ Golden Week holiday.#Melbourne #Australia on list - has been a recent coronavirus hotspot Image
Read 5 tweets
15 Sep
Head of Asia Pacific, Grant Wilson on RISK PARITY: It has been presented as an alternative to the classic 60/40 allocation b/w equities & bonds. (Thread 1/8). Originally featured as an opinion piece in @FinancialReview
2/8: Risk Parity equalizes contributions to risk from different asset classes in portfolio. Typically targets #volatility for portfolio as whole, in range of 10-15%. Equity, bonds, & other sector allocations derived based on measures of expected return/risk/correlation.
3/8: Risk parity has become synonymous with an ‘all weather’ portfolio. In March, #COVID19 roiled financial markets & we saw the short-comings of this slogan.
Read 9 tweets
6 Aug
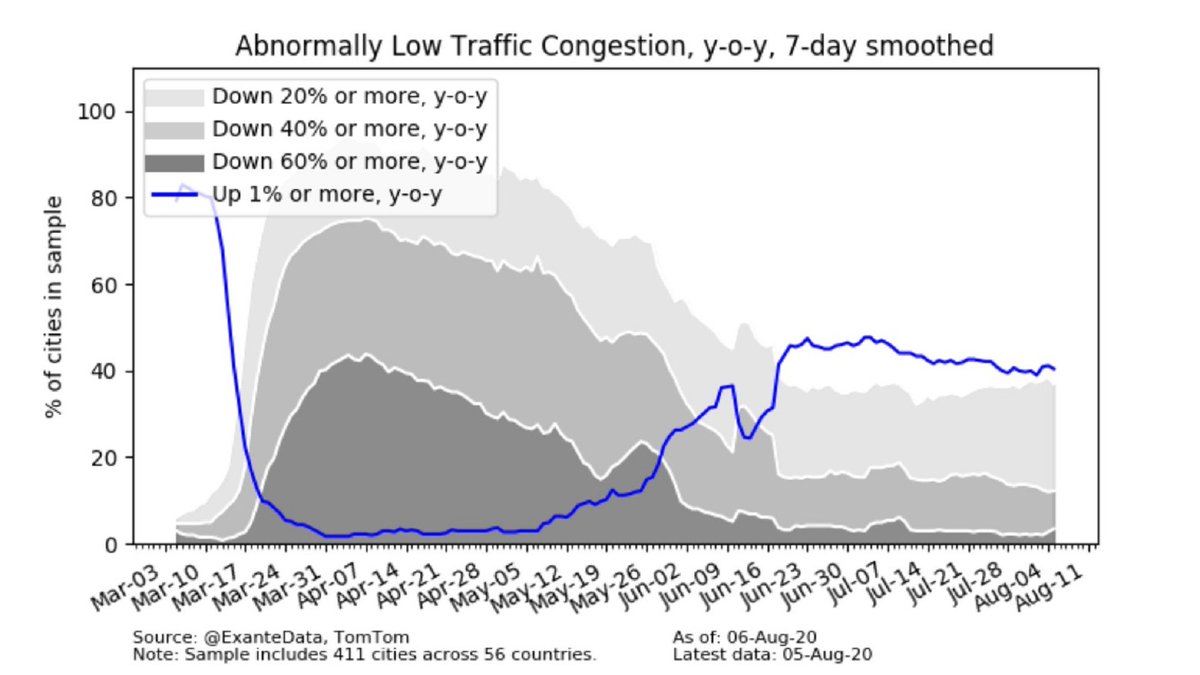
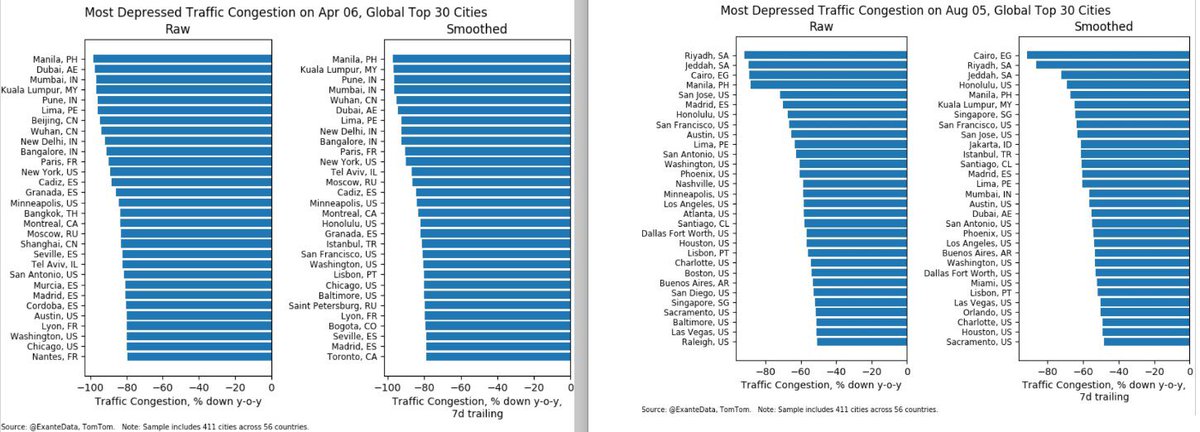
#ThursdayThoughts : Today marks 4 months since **MAX Global #Lockdown** (Thread). It was achieved on April 6 when 76% of global cities had #traffic congestion down 40% y/y or more. Now, only 12% of cities have congestion down 40%. #COVID__19 #pandemiclife #OOTT
*Side-by-Side Comparison*: Top 30 Global Cities w/ Most Depressed #Traffic Congestion. April 6 (Max lockdown) & today’s release. Apr 6th (left) Smoothed data showed #Philippines & #Malaysia cities top 2. US - 7 cities. #India - 4. #Wuhan #Paris #Istanbul #Moscow included. #OOTT
Now, (chart on right): #SaudiArabia is in focus w/ 2 cities in top 3: #Riyadh & #Jeddah . #Cairo is top in smoothed data. #Honolulu (US) is still in the top. US has 15 cities included now. #Manila & #kualalumpur still included. #COVID__19 #SocialDistancing #OOTT #Transportation
Read 5 tweets
30 Jul
*Peak hoarding* Thread - analysis by Sr. Advisor @Brad_Setser. Mar: financial stress re: #COVID19 shock generated unprecedented foreign outflows from Treasury market & unprecedented inflows into US banks. Interbank claims on US banks & non-bank deposits at US banks rose.
Official investors were on net pulling funds out of Treasury market & increasing deposits in US banks (including at Fed). Apr - little chg. *May TIC data*: firm evidence of normalization. Interbank flows into US reversed, generating modest outflows in short-term banking data.
X-border bank claims on US banks are about $200 billion below their peaks in latest data. A portion of Mar inflow in US banks reversed – but even so, foreign deposits & broader claims on US banks remain historically elevated. Image
Read 8 tweets
1 Jul
Backgrounder on #COVID19 Hospitalization Data (thread)
Exante started to track #hospitalization data around the time of the #COVID19 outbreak in #Italy. Hospitalization data are not as skewed by fluctuations in amount of testing done. The challenge w/ hospitalization data is that countries & various US states report it differently.
Types of #hospitalization data: 1). *Cumulative hospitalizations*: All people who have ever been in hospital for #COVID19, including: those currently in hospital, those discharged, and those that died. From cumulative hospitalizations, one can calculate new hospitalizations.
Read 7 tweets

Did Thread Reader help you today?

Support us! We are indie developers!


This site is made by just two indie developers on a laptop doing marketing, support and development! Read more about the story.

Become a Premium Member ($3/month or $30/year) and get exclusive features!

Become Premium

Too expensive? Make a small donation by buying us coffee ($5) or help with server cost ($10)

Donate via Paypal Become our Patreon

Thank you for your support!

Follow Us on Twitter!