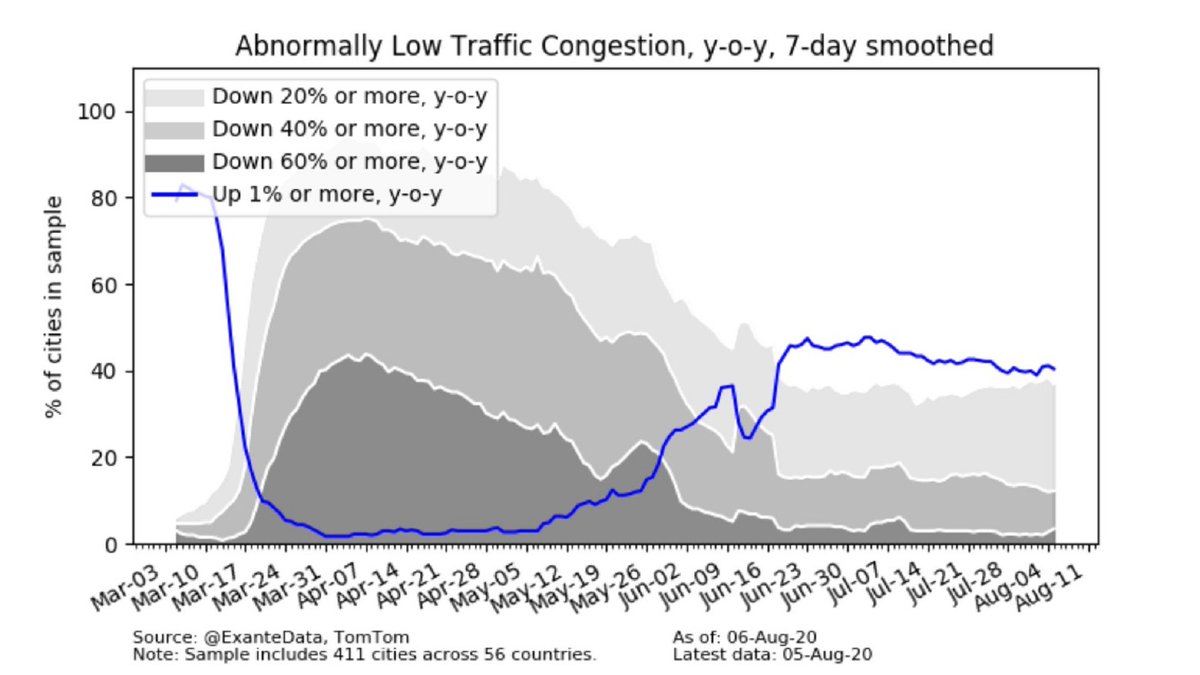
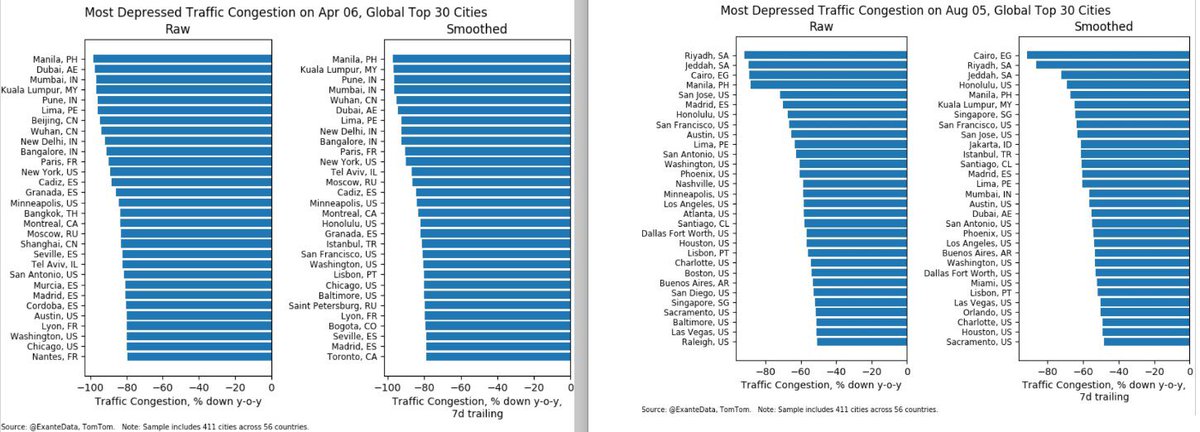
**October 6th marked 6 months since MAX GLOBAL #lockdown**. That was achieved on April 6 when 76% of global cities had #traffic congestion down 40% y/y or more. Now, only 8% of cities have congestion down 40%. (see thread - 6mo mark)
Charts: Side-by-Side Comparison - Top 30 Global Cities Most Depressed #Traffic Congestion. April 6 (Max lockdown) % Oct 6. Apr 6 (left): smoothed shows cities Manila & Kuala Lumpur top 2. The US had 7 cities in top 30. #India had 4. Other cities included: #Wuhan#Paris#Istanbul
Oct 6: smoothed data (right) US has 2 of the 3 top cities: #Honolulu#SanJose. #TelAviv is top city most depressed traffic congestion. #China cities make list, but has to do w/ Golden Week holiday.#Melbourne#Australia on list - has been a recent coronavirus hotspot
(1/4) Update re #ECB Q-end balance sheet released today. Confirms adjustments to asset holdings which distorted the flow of asset purchases published Monday. *Applying these corrections shows PEPP purchases during wk ended 2 Oct were EUR13.1BN & total asset purchases EUR20.6BN*.
(2/4) This still represents a softening in the pace of net asset purchases from EUR29.5BN the previous week and the lowest for 4 weeks, but redemptions of EUR8BN across all programs during the week also weighed on the flow. Updated chart below:
(3/4) Eurosystem bank reserves/deposits increased EUR247BN during the week, driven by net EUR157BN increase in PETLTRO claims, EUR77BN reduction in gov deposits, & EUR12BN addition of liquidity due to asset purchases (adjusted.)
(1/8) #ECB today published an update on govvie purchases under PEPP (Aug-Sep) & PSPP (Sep) which shows the huge benefit from PEPP in terms of purchase pace & capital key deviation during times of stress.
(2/8) For example, total PEPP purchases of non-supra govvies slowed in Aug/Sep from EUR184BN in June/July to only EUR121BN. Partly this is seasonal, as August is a stale month for markets. But this also reflects the prior need to front load PEPP purchases.
(3/8) In terms of flexibility, chart shows share of PEPP govvie purchases over the 3 periods for which data is available. In Aug/Sept, as well as slowdown in purchases, deviations from capital key were much smaller than earlier this year.
Head of Asia Pacific, Grant Wilson on RISK PARITY: It has been presented as an alternative to the classic 60/40 allocation b/w equities & bonds. (Thread 1/8). Originally featured as an opinion piece in @FinancialReview
2/8: Risk Parity equalizes contributions to risk from different asset classes in portfolio. Typically targets #volatility for portfolio as whole, in range of 10-15%. Equity, bonds, & other sector allocations derived based on measures of expected return/risk/correlation.
3/8: Risk parity has become synonymous with an ‘all weather’ portfolio. In March, #COVID19 roiled financial markets & we saw the short-comings of this slogan.
#ThursdayThoughts : Today marks 4 months since **MAX Global #Lockdown** (Thread). It was achieved on April 6 when 76% of global cities had #traffic congestion down 40% y/y or more. Now, only 12% of cities have congestion down 40%. #COVID__19#pandemiclife#OOTT
*Side-by-Side Comparison*: Top 30 Global Cities w/ Most Depressed #Traffic Congestion. April 6 (Max lockdown) & today’s release. Apr 6th (left) Smoothed data showed #Philippines & #Malaysia cities top 2. US - 7 cities. #India - 4. #Wuhan#Paris#Istanbul#Moscow included. #OOTT
*Peak hoarding* Thread - analysis by Sr. Advisor @Brad_Setser. Mar: financial stress re: #COVID19 shock generated unprecedented foreign outflows from Treasury market & unprecedented inflows into US banks. Interbank claims on US banks & non-bank deposits at US banks rose.
Official investors were on net pulling funds out of Treasury market & increasing deposits in US banks (including at Fed). Apr - little chg. *May TIC data*: firm evidence of normalization. Interbank flows into US reversed, generating modest outflows in short-term banking data.
X-border bank claims on US banks are about $200 billion below their peaks in latest data. A portion of Mar inflow in US banks reversed – but even so, foreign deposits & broader claims on US banks remain historically elevated.
Backgrounder on #COVID19 Hospitalization Data (thread)
Exante started to track #hospitalization data around the time of the #COVID19 outbreak in #Italy. Hospitalization data are not as skewed by fluctuations in amount of testing done. The challenge w/ hospitalization data is that countries & various US states report it differently.
Types of #hospitalization data: 1). *Cumulative hospitalizations*: All people who have ever been in hospital for #COVID19, including: those currently in hospital, those discharged, and those that died. From cumulative hospitalizations, one can calculate new hospitalizations.