Exante Data Profile picture
Data driven insights before the consensus We serve the world's top institutional investors. Check out: https://t.co/WcLvjdLaHc https://t.co/RWQ9sYIeag (substack)
𝔽_un Profile picture Democracy’N’Peace Profile picture Stephen Leung Profile picture 3 subscribed
Jan 27, 2023 5 tweets 2 min read
Busy week for fund flows... Thread!

Last week (Thu to Wed) saw a third consecutive week of robust inflows to both global equity ($13.7bn) and fixed income ($11.9bn) funds, totaling global inflows of $28bn in equity and $45.3bn in global fixed in the first three weeks of the year 
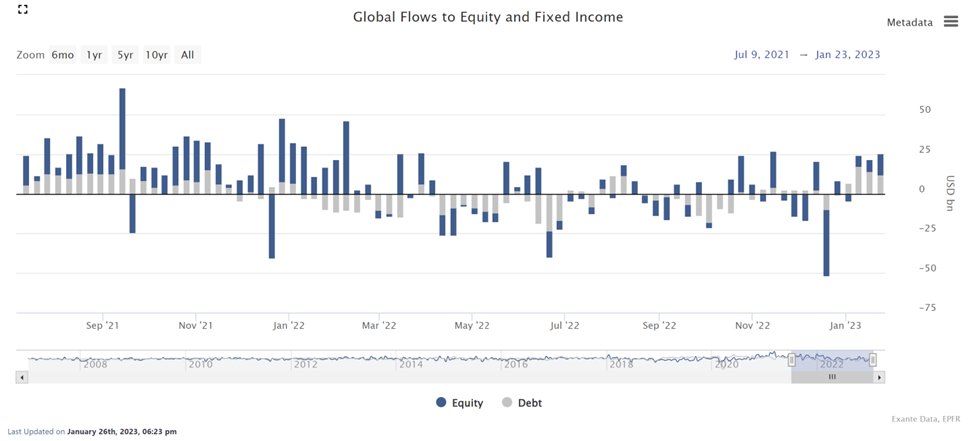
Inflows to global fixed income were explained by purchases of EM debt by foreign investors ($2.6bn), the highest record since February 2019, but also for purchases of US fixed income by domestic investors ($3.1bn).
Nov 10, 2022 7 tweets 3 min read
Given intense focus on foreign, especially Japanese activity vis a vis the US Treasury market we share some of the data we use to track these flows...🧵wsj.com/articles/japan… The latest Japanese data show sales of US LT debt of about $17bn in September. That brings such sales to $113bn YTD.
Nov 7, 2022 9 tweets 3 min read
There were several aspects of China's preliminary Q3 BoP that were notable = 🧵 The current account recorded a record surplus of $144bn. This is not surprising given that the customs data showed a trade surplus of $265bn in Q3.
Aug 25, 2022 12 tweets 4 min read
New Substack: 🔹Petrodollars: Where are the surpluses? Part 1 🔹by @EtraAlex and @Shekhar_HK17 . Combo of global pandemic & energy crisis is having an impact on global imbalances - a roughly once-in-a-decade event. (Thread) #OOTT @middleeast US, EZ, Japan, Korea will likely have current account deficits soon. Where are the counterpart surpluses to these shifts?
Apr 10, 2022 4 tweets 2 min read
#Shanghai #COVID #lockdown means that intercity travel to Shanghai is practically zero, weaker than during Spring 2020. But many neighbourhoods were locked down weeks before that; travel to Shanghai started to decline in early March - THREAD (1/4) #ZeroCovid Outbound travel from Shanghai is similarly weak.
Apr 7, 2021 33 tweets 6 min read
1. THREAD: Series by @GeneralTheorist
*To catch a falling knife: US Treasuries and the Fed*
The continued US deficit in 2021 puts Treasuries in focus, with 10y yield already having moved about 80bps higher to 170bps, & a number of weak primary auctions in Q1. What’s going on? 2. In a series of Substack blogs, we attempt to frame the unique situation in the US this year. Post-GFC and last year, the US fiscal deficit was the natural counterpart to private sector surpluses.
Apr 6, 2021 4 tweets 3 min read
Below @WSJ @jamestareddy released an article on #China #DigitalCurrency . Check out our Head of Asia Pacific, Grant Wilson's blogs on our Substack - Money: Inside and Out - on the subject (THEAD). Subscribe to our Substack at pinned tweet 📌#CBDC China's digital currency is a game changer (Part 1).
moneyinsideout.exantedata.com/p/chinas-digit…
Jan 7, 2021 5 tweets 5 min read
#UK #Covid19 press conference detailed national #vaccine plan to Feb 15-deadline to have 15 million people in 4 main groups have appointments to start #vaccination. 4 groups: 1. elder care residents/staff 2. 70yrs+ 3. frontline NHS staff 4. clinically very vulnerable. (Thread) Re: resources: #UK plans to have +1000 GP led #vaccination sites, 223 hospital sites, 7 giant #vaccine centers, & 200 community pharmacies to administer the vaccines. According to @BorisJohnson this will allow UK to administer 100s of thousands of vaccines daily by Jan 15. Image
Dec 4, 2020 6 tweets 4 min read
November was a huge month for EM ex-China portfolio flows and many are wondering will this continue and what are the implications for EMFX and the dollar. THREAD @adam_tooze @MarketInterest @jturek18 1/5 On flows, it is important to keep both the cyclical and structural stories in mind. Flows to EM ex-China (especially equity flows) have been weakening for years. And increasingly China accounts for debt inflows equal to the rest of EM combined. @michaelxpettis @M_C_Klein 2/5
Nov 11, 2020 6 tweets 4 min read
(1/5) Senior Advisor @Brad_Setser has joined the Biden-Harris Transition Team as a member of the Office of the United States Trade Representative agency review team. As such, Brad will be on leave from his role at @ExanteData. #BidenHarris2020 (2/5) Brad joined @ExanteData in mid-2019. While with Exante, he remained on fellowship with @CFR_org. Brad has been analyzing global capital movements for more than 20 years, and we regard him as one of the world’s top experts on this topic.
exantedata.com/announcement-b…
Oct 7, 2020 4 tweets 2 min read
(1/4) Update re #ECB Q-end balance sheet released today. Confirms adjustments to asset holdings which distorted the flow of asset purchases published Monday. *Applying these corrections shows PEPP purchases during wk ended 2 Oct were EUR13.1BN & total asset purchases EUR20.6BN*. (2/4) This still represents a softening in the pace of net asset purchases from EUR29.5BN the previous week and the lowest for 4 weeks, but redemptions of EUR8BN across all programs during the week also weighed on the flow. Updated chart below:
Oct 7, 2020 5 tweets 6 min read
**October 6th marked 6 months since MAX GLOBAL #lockdown**. That was achieved on April 6 when 76% of global cities had #traffic congestion down 40% y/y or more. Now, only 8% of cities have congestion down 40%. (see thread - 6mo mark) Charts: Side-by-Side Comparison - Top 30 Global Cities Most Depressed #Traffic Congestion. April 6 (Max lockdown) % Oct 6. Apr 6 (left): smoothed shows cities Manila & Kuala Lumpur top 2. The US had 7 cities in top 30. #India had 4. Other cities included: #Wuhan #Paris #Istanbul
Oct 5, 2020 8 tweets 3 min read
(1/8) #ECB today published an update on govvie purchases under PEPP (Aug-Sep) & PSPP (Sep) which shows the huge benefit from PEPP in terms of purchase pace & capital key deviation during times of stress. (2/8) For example, total PEPP purchases of non-supra govvies slowed in Aug/Sep from EUR184BN in June/July to only EUR121BN. Partly this is seasonal, as August is a stale month for markets. But this also reflects the prior need to front load PEPP purchases.
Sep 15, 2020 9 tweets 3 min read
Head of Asia Pacific, Grant Wilson on RISK PARITY: It has been presented as an alternative to the classic 60/40 allocation b/w equities & bonds. (Thread 1/8). Originally featured as an opinion piece in @FinancialReview 2/8: Risk Parity equalizes contributions to risk from different asset classes in portfolio. Typically targets #volatility for portfolio as whole, in range of 10-15%. Equity, bonds, & other sector allocations derived based on measures of expected return/risk/correlation.
Aug 6, 2020 5 tweets 9 min read
#ThursdayThoughts : Today marks 4 months since **MAX Global #Lockdown** (Thread). It was achieved on April 6 when 76% of global cities had #traffic congestion down 40% y/y or more. Now, only 12% of cities have congestion down 40%. #COVID__19 #pandemiclife #OOTT *Side-by-Side Comparison*: Top 30 Global Cities w/ Most Depressed #Traffic Congestion. April 6 (Max lockdown) & today’s release. Apr 6th (left) Smoothed data showed #Philippines & #Malaysia cities top 2. US - 7 cities. #India - 4. #Wuhan #Paris #Istanbul #Moscow included. #OOTT
Jul 30, 2020 8 tweets 3 min read
*Peak hoarding* Thread - analysis by Sr. Advisor @Brad_Setser. Mar: financial stress re: #COVID19 shock generated unprecedented foreign outflows from Treasury market & unprecedented inflows into US banks. Interbank claims on US banks & non-bank deposits at US banks rose. Official investors were on net pulling funds out of Treasury market & increasing deposits in US banks (including at Fed). Apr - little chg. *May TIC data*: firm evidence of normalization. Interbank flows into US reversed, generating modest outflows in short-term banking data.
Jul 1, 2020 7 tweets 3 min read
Backgrounder on #COVID19 Hospitalization Data (thread) Exante started to track #hospitalization data around the time of the #COVID19 outbreak in #Italy. Hospitalization data are not as skewed by fluctuations in amount of testing done. The challenge w/ hospitalization data is that countries & various US states report it differently.
Jun 23, 2020 4 tweets 2 min read
One big puzzle currently in COVID projections is why some states have much higher 'hospitalization rates' than others.

Brief THREAD on Texas, versus the rest... It is no surprise that hospitalization rates (those in hospital relative to active recorded cases) are coming down fast in states with aggressive testing and a moderating outbreak, such as NY:
Jun 11, 2020 5 tweets 3 min read
All US states are at least partially open. Investor focus is on risk of 2nd wave #COVID19 in states seeing rising case growth & increasing hospital pressure. CDC data through June 9 confirms recent growth of #COVID19 hospitalization trends in #Arizona & #Texas #Texas
May 12, 2020 5 tweets 3 min read
Lot of good discussion from @Brad_Setser @PMehrling @michaelxpettis @adam_tooze on a recent @TheEconomist article on the rise of the $rmb as a reserve currency. At Exante we track this closely. We have seen modest CB purchases of RMB driven mostly by the SNB in early 2020... 1/5 
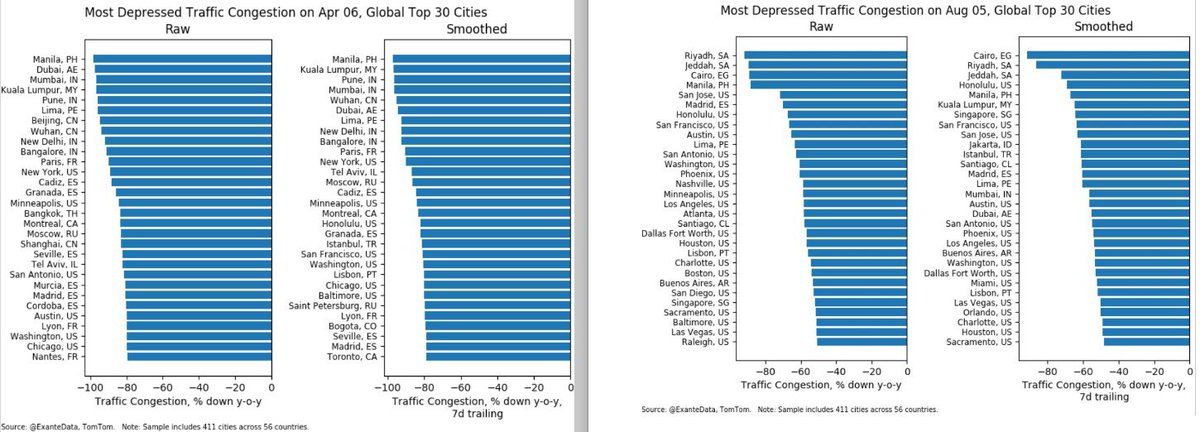
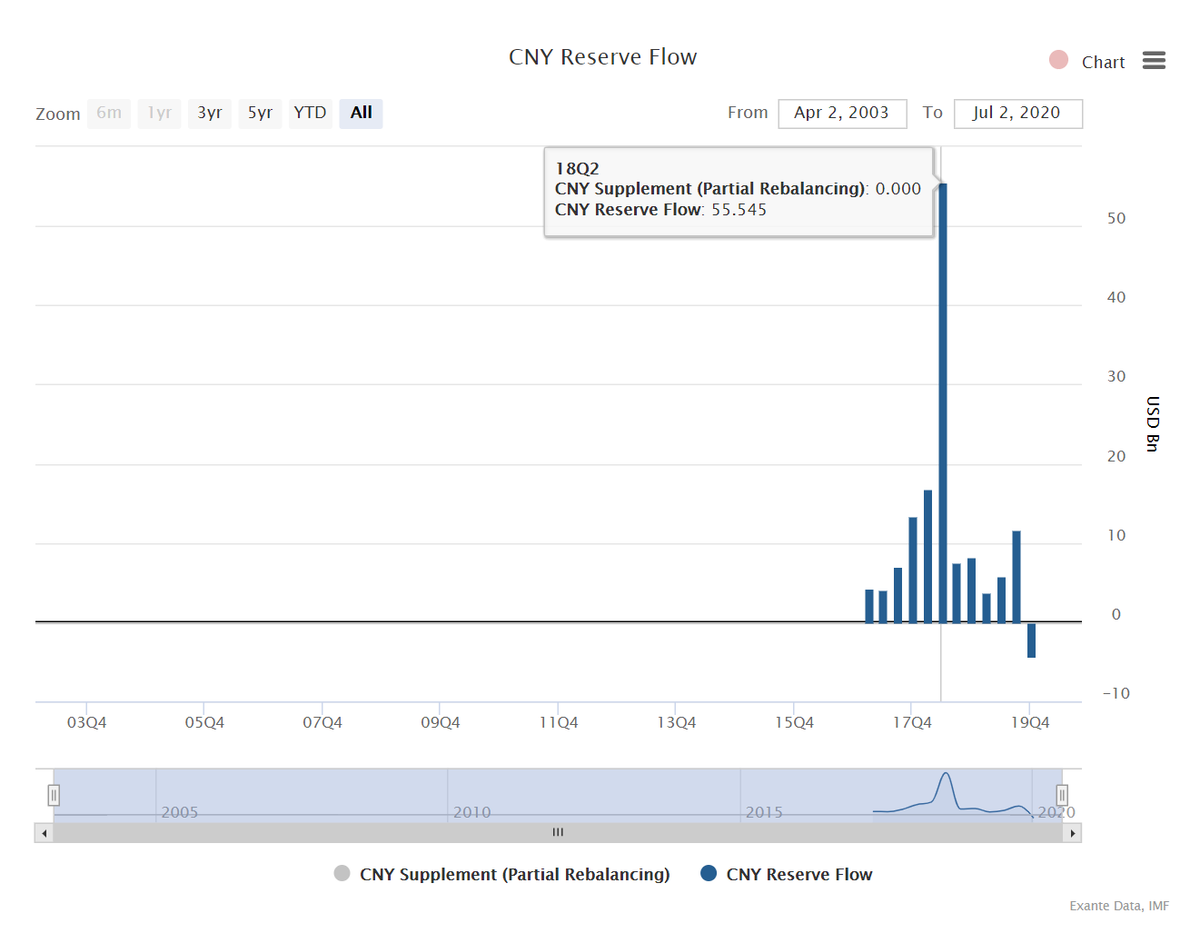
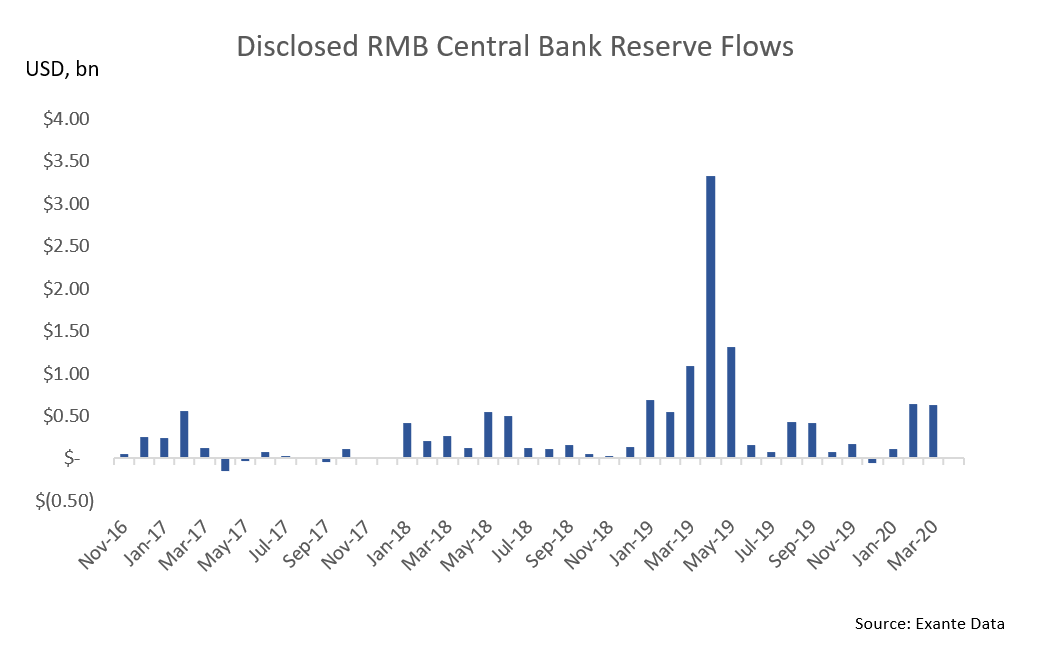
...but COFER data, which is a much broader sample than the reserve managers tracked above, shows net RMB sales by reserve managers in Q4. The first quarter of sales since joining the SDR... 2/5
Apr 30, 2020 25 tweets 8 min read
We have been tracking the coronavirus/COVID19 outbreak VERY closely since it started in #China in January, and we have learnt a fair bit about what data to use and not use in the process = A THREAD.

A key point: There is no single source of data that is the best. The data is collected in a decentralized way. Hence, you have to think about which data is best for each jurisdiction (though it is nearly impossible to track them all individually).