2018-19 GERS figures summarised and in historical context:
this graph plots real per capita *differences* over time between Scotland and rest of UK in terms of Onshore Revenue (green), Revenue including Oil (black) and Expenditure (Red)
(1/11)
this graph plots real per capita *differences* over time between Scotland and rest of UK in terms of Onshore Revenue (green), Revenue including Oil (black) and Expenditure (Red)
(1/11)
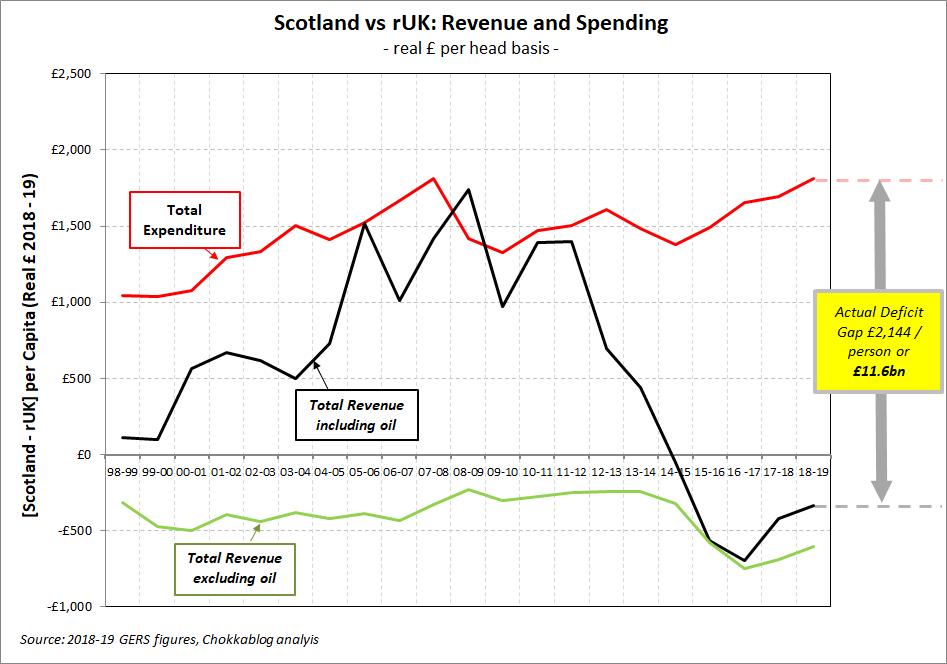
key points:
[green line] - the onshore economy performs less well than rUK, but there are signs of that gap closing following a recent relative slump
[black line] - adding (historically volatile) oil revenues further closes the revenue/capita gap to rUK
(2/11)
[green line] - the onshore economy performs less well than rUK, but there are signs of that gap closing following a recent relative slump
[black line] - adding (historically volatile) oil revenues further closes the revenue/capita gap to rUK
(2/11)

key points (cont'd):
[red line] - spending per head in Scotland continues to be much higher than in rUK & the relative gap is growing (as it has done since 2014)
Public spending per head in Scotland is now £1,809 higher than rUK (or £1,661 higher than UK average)
(3/11)
[red line] - spending per head in Scotland continues to be much higher than in rUK & the relative gap is growing (as it has done since 2014)
Public spending per head in Scotland is now £1,809 higher than rUK (or £1,661 higher than UK average)
(3/11)

key points (cont'd):
the gap between the red and black lines is the deficit gap between Scotland and rUK - since the oil revenues slumped this has been reasonably consistent and is £11.6bn or £2,144 per person in 2018-19
(4/11)
the gap between the red and black lines is the deficit gap between Scotland and rUK - since the oil revenues slumped this has been reasonably consistent and is £11.6bn or £2,144 per person in 2018-19
(4/11)

for those who care about such things, the "deficit gap" is not quite the same as the "effective fiscal transfer" which is £10.7bn or roughly £2,000 for every man, woman and child in Scotland
(5/11)
(5/11)

[for those struggling to grasp what the "fiscal transfer" means, think of it like sharing a bill in a restaurant - by sharing the deficit on a per head basis, we effectively "split the bill" across the UK]
(6/11)
(6/11)

and for those wondering where Scotland spends more per head than the rest of the UK, the answer is pretty much everywhere (except where costs are shared on a per capita basis, those being categories which by definition can't explain per capita differences)
(7/11)
(7/11)

There is of course nothing unique about Scotland being a net beneficiary of fiscal transfers
[apologies I haven't updated this, but it illustrates the point using 2015/16 data]
(8/11)
[apologies I haven't updated this, but it illustrates the point using 2015/16 data]
(8/11)

Conclusion (1):
GERS figures show a deficit gap between Scotland and the rest of the UK which is almost entirely explained by higher per capita spending on public services (*not* under-performance of the economy)
(9/11)
GERS figures show a deficit gap between Scotland and the rest of the UK which is almost entirely explained by higher per capita spending on public services (*not* under-performance of the economy)
(9/11)

Conclusion (2):
Scots share in the UK's 1.1% deficit, not the notional 7% Scottish deficit that GERS shows
if you believe in UK-wide pooling & sharing, this is just a paper exercise; the GERS deficit and public spend levels are - demonstrably - perfectly sustainable
(10/11)
Scots share in the UK's 1.1% deficit, not the notional 7% Scottish deficit that GERS shows
if you believe in UK-wide pooling & sharing, this is just a paper exercise; the GERS deficit and public spend levels are - demonstrably - perfectly sustainable
(10/11)

Conclusion (3):
Scotland's GERS deficit only becomes something that requires urgent action if we choose to become independent (or fiscally autonomous) - it would be a problem *created* by independence
note: the EU's excessing deficit procedure is triggered at 3% of GDP
[ends]
Scotland's GERS deficit only becomes something that requires urgent action if we choose to become independent (or fiscally autonomous) - it would be a problem *created* by independence
note: the EU's excessing deficit procedure is triggered at 3% of GDP
[ends]