
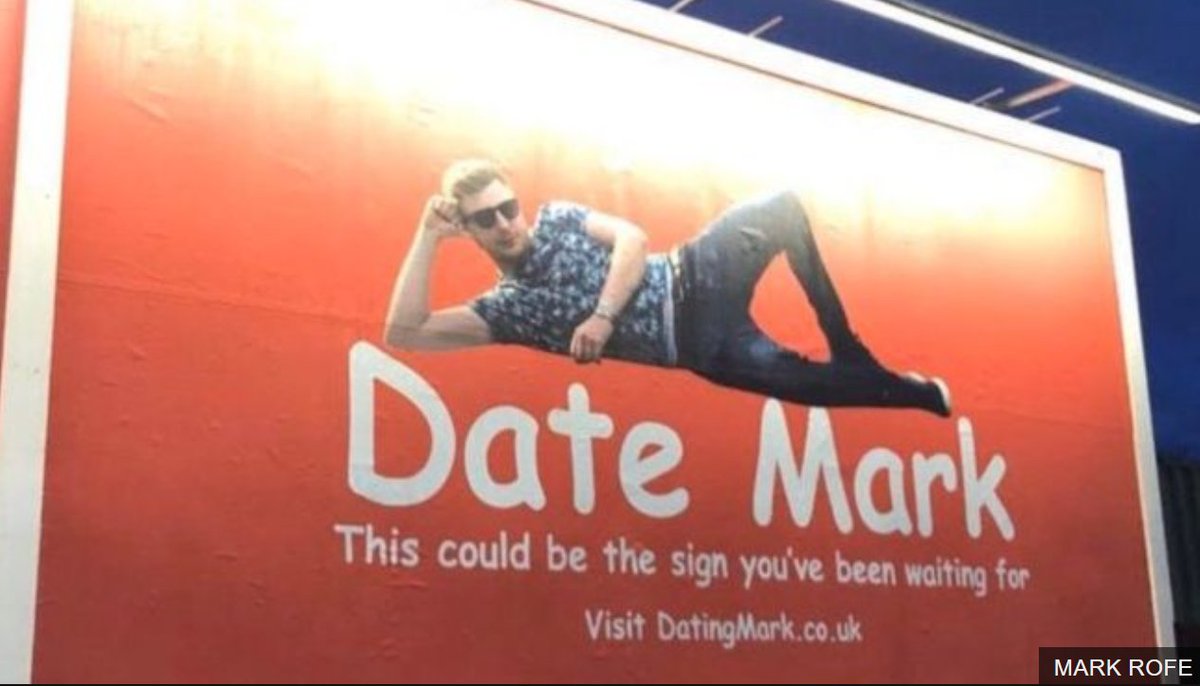
Mark Rofe (@iamrofe) ran a billboard in Manchester advertising for a date.
The ad included a website (datingmark.co.uk).
The billboard featured in the Daily Mail, BBC News, This Morning, Fox, and more.
He asked me to take a look at the data for the site. Here are notes:
The ad included a website (datingmark.co.uk).
The billboard featured in the Daily Mail, BBC News, This Morning, Fox, and more.
He asked me to take a look at the data for the site. Here are notes:
(nb: I wrote a few bits from this before & tweeted them, but the train connection died. I'll just tweet these as I go through the reports, with bad connection, so it may take a bit of time).
Bad joke: I suppose you could call this a 'dater analysis' thread.
Bad joke: I suppose you could call this a 'dater analysis' thread.
First off, it's almost midnight on Valentine's Day, and there are currently 30 people on the site.
It was featured on lots of big media sites, but mostly a week or so ago, so that's a surprise.
It was featured on lots of big media sites, but mostly a week or so ago, so that's a surprise.

Half the active users right now are in the States, they've mostly come direct to the URL (I'll explain why in a bit), but some from Google, and a couple from Twitter.


The site launched in late January. Since that time it's had 116,511 users.
Those users have spent 131,268 'sessions' on the site ('visits' to the general public).
The site has had just over 1/4 million pageviews, so the average user views roughly 2 pages.
Those users have spent 131,268 'sessions' on the site ('visits' to the general public).
The site has had just over 1/4 million pageviews, so the average user views roughly 2 pages.

Here's how those sessions break down over time.
Ie: After launch it hid a big peak (29,772 visits on one day), then curved down to a low of 884 visits on the 13th.
On Valentine's Day, it's had 12,328 visits.
Ie: After launch it hid a big peak (29,772 visits on one day), then curved down to a low of 884 visits on the 13th.
On Valentine's Day, it's had 12,328 visits.
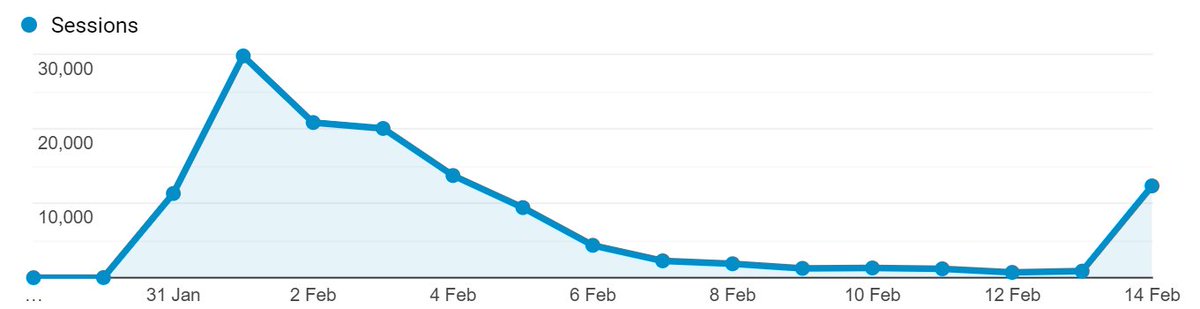
You can attribute the bump back up in sessions on Valentine's Day to this:
1. Mark tweeted last night that he had a date today.
2. Because this whole thing got so much coverage, he's picked up a lot of followers in the media.
...
1. Mark tweeted last night that he had a date today.
2. Because this whole thing got so much coverage, he's picked up a lot of followers in the media.
...

That tweet itself didn't get many likes, etc, but 'Billboard 'date me' guy gets Valentine date' is the kind of story that any journalists following him looking for an easy 'cute' Valentine's Day story may pick up.
And so today it hit the BBC News homepage again.
And so today it hit the BBC News homepage again.

Along with the BBC News, this 'reup' of the story ended up on Sky News, the Independent, Manchester Evening News, etc.

Ie, the curve back up at the right side of the graph here was basically caused by a single tweet with clever/serendipitous timing, and having built some followers who were interested in covering it.

The analytics setup didn't have 'demographic data' turned on when it launched, but it has had for the last few days.
From that we can see that a marginal majority (52:48) of site visits came from men, vs 48% from women.
From that we can see that a marginal majority (52:48) of site visits came from men, vs 48% from women.

In the chart there you can see that well over 2/3 of visits are from people under the age of 44.
The single largest group is men 25-34, followed closely by women 25-34 (the age bracket Mark himself is in).
The single largest group is men 25-34, followed closely by women 25-34 (the age bracket Mark himself is in).
You can also see there, older users spend less 'average session duration'. That's a very flawed metric, not calculated in a meaningful way, but - for what it's worth - women aged 18-24 spent most time on the site, with an average 1 minute 31 seconds.
Looking at the interests of site visitors, Google categorises them as being interested in: Shopping, Movies, Music, Green Living, Travel, Technology, Art & Theatre, Fitness, Food, and '30 minute chef' recipes.

Of those visitors categorised as being in the market to buy something, it's heartening to see 'Dating Services' in the top 5.
Hotels and Air Travel in there too, perhaps boding positively for the future. (in honesty those are often there, particularly with this age range)
Hotels and Air Travel in there too, perhaps boding positively for the future. (in honesty those are often there, particularly with this age range)

Geographically, people have visited the site from *202* countries. That's a fair spread.
UK was top at 55%, USA just over 10%, Germany, Australia (where it had TV coverage), Canada, India were all top 10. Nice to see Belgium & Hungary punching above their population weight too.
UK was top at 55%, USA just over 10%, Germany, Australia (where it had TV coverage), Canada, India were all top 10. Nice to see Belgium & Hungary punching above their population weight too.

The *busiest* user on the site has spent a massive 60 visits on there. (I'd guess this is actually Mark himself)
But 2nd most is 52 (maybe that's Mark on his phone 😆)
There's a lot of users that have visited the site frequently though (61 users have visited 10 or more times)
But 2nd most is 52 (maybe that's Mark on his phone 😆)
There's a lot of users that have visited the site frequently though (61 users have visited 10 or more times)

Here's an example of those - a user who checks back to the homepage a couple of times every day.
Perhaps looking for updates. There are quite a few with patterns similar to this.
Perhaps looking for updates. There are quite a few with patterns similar to this.

Vast majority of users visit via mobile (70%), with desktop users making up almost all of the rest.
It's a generalisation, but tablet users tend to be older and - as we saw earlier - those are in the minority.
It's a generalisation, but tablet users tend to be older and - as we saw earlier - those are in the minority.

Here's how people flow through the site. Ie:
Majority land on the homepage.
'Apply' (ie, ask for a date) is the 2nd page for most.
'Media' is next most popular 2nd page.
Having looked at 'Media', some more then go on to apply.
And often people will jump back home before leaving.
Majority land on the homepage.
'Apply' (ie, ask for a date) is the 2nd page for most.
'Media' is next most popular 2nd page.
Having looked at 'Media', some more then go on to apply.
And often people will jump back home before leaving.

Here's info on how people visited the site in more detail: Top 'landing pages'.
95% began their journey on the homepage. That has a bounce rate of just over 50% (ie. half were interested enough to view another page).
4,272 were so interested they *started* on the 'Apply' page.
95% began their journey on the homepage. That has a bounce rate of just over 50% (ie. half were interested enough to view another page).
4,272 were so interested they *started* on the 'Apply' page.

And here's the total pageviews (ie, including both when people 'landed' on a page, or when they simply viewed it later in a session).
From that you can see the 'apply' page had 54,603 views.
From that you can see the 'apply' page had 54,603 views.

You can also see from the difference between 'views' and 'unique views' on the 'apply' page that some users were interested enough to jump back to it more than once in a visit.
Mark sadly didn't set up anything to track how many applied directly within the analytics setup (poor attention to detail)... but from the number he manually updates on the homepage, we can see 2363 date applications.

2,363 applicants from 131k visits gives it a rough visit:date application conversion rate of 1.8%.
Based on just 48k of those viewing the 'apply' page, you can say that the application process ('the checkout funnel') has a conversion rate of almost 5%.
Based on just 48k of those viewing the 'apply' page, you can say that the application process ('the checkout funnel') has a conversion rate of almost 5%.
Traffic to the site breaks down like this:
1. 'none' is the largest medium (ie, mostly people directly typing the URL into a browser. Some of this will also be clicks from other untrackable apps).
2. Referrals from social media / news sites / etc next.
3. Google Organic 3rd.
1. 'none' is the largest medium (ie, mostly people directly typing the URL into a browser. Some of this will also be clicks from other untrackable apps).
2. Referrals from social media / news sites / etc next.
3. Google Organic 3rd.

Splitting out 'Social' & 'Other referrers' into 2 separate buckets, we can see that actually social media sent much more than news sites did (at least directly through clicking links on the web).

Those social sources break down like this.
This is quite interesting - Twitter first, home of journalists & the place where Mark seems to have promoted it most himself...
...but Facebook very close behind, and then *LinkedIn* (maybe due to the PR industry interest)
This is quite interesting - Twitter first, home of journalists & the place where Mark seems to have promoted it most himself...
...but Facebook very close behind, and then *LinkedIn* (maybe due to the PR industry interest)

You'll note above that Instagram is tiny - almost as low numbers as VKontakte (a big russian social network).
Instagram of course doesn't allow links in most areas, and - where it does - often people are hopping across from the app, which often appears as if 'direct'.
Instagram of course doesn't allow links in most areas, and - where it does - often people are hopping across from the app, which often appears as if 'direct'.
Among other sites that referred traffic (239 in total, excluding facebook/twitter/linkedin), there's quite a mix.
The Star is the top english language news publication sending traffic (a sheffield paper) with 366 visits. Fox News comes after that, Evening Standard at 197 visits.
The Star is the top english language news publication sending traffic (a sheffield paper) with 366 visits. Fox News comes after that, Evening Standard at 197 visits.

You may be surprised to see some of the sites we mentioned earlier (BBC News, Sky, Independent) missing from this list...
...that's because for weird legacy reasons, those sites *hate* to link out. So, even though they'll happily cover the story, they don't link to the site.
...that's because for weird legacy reasons, those sites *hate* to link out. So, even though they'll happily cover the story, they don't link to the site.
Some cases in point:
BBC news - a few hundred words but no link - bbc.co.uk/news/uk-englan…
Manchester Evening News (where the billboard is) - no link - manchestereveningnews.co.uk/news/greater-m…
Independent - links to the BBC, and back to their own Valentine's page, but no link to the site.
BBC news - a few hundred words but no link - bbc.co.uk/news/uk-englan…
Manchester Evening News (where the billboard is) - no link - manchestereveningnews.co.uk/news/greater-m…
Independent - links to the BBC, and back to their own Valentine's page, but no link to the site.
*BUT*, Mark put the URL on the billboard, and the billboard is featured in almost all articles about it, so that drives some traffic to:
1) Google, where people search for it.
2) Directly typing in the URL.
1) Google, where people search for it.
2) Directly typing in the URL.


You can also see - madly - the 3rd top Google Suggest for the word 'dating' followed by a space is for his website.

You can also see this a bit over on Google Search Trends. The biggest spike over there is for 'dating mark' (as opposed to 'mark rofe', or 'date mark' (the headline)).

You can also see the effect of Mark's appearances on TV within the data. Here's the graph of traffic on February 2nd.
Can you guess what time he appeared on TV just from looking at that?
Can you guess what time he appeared on TV just from looking at that?

Yep - he was on BBC Breakfast late into the 8am hour, lagging over just past 9am, so you see the big spike there, and bumping up further into the 9am-10am spot on the graph.
On Feb 3rd, he was on 'This Morning', with the billboard in the background. 'This Morning' is one of the most popular shows in the UK.
He was on for around 3 minutes, with the billboard in the background, 'datingmark.co.uk' visible.
He was on for around 3 minutes, with the billboard in the background, 'datingmark.co.uk' visible.
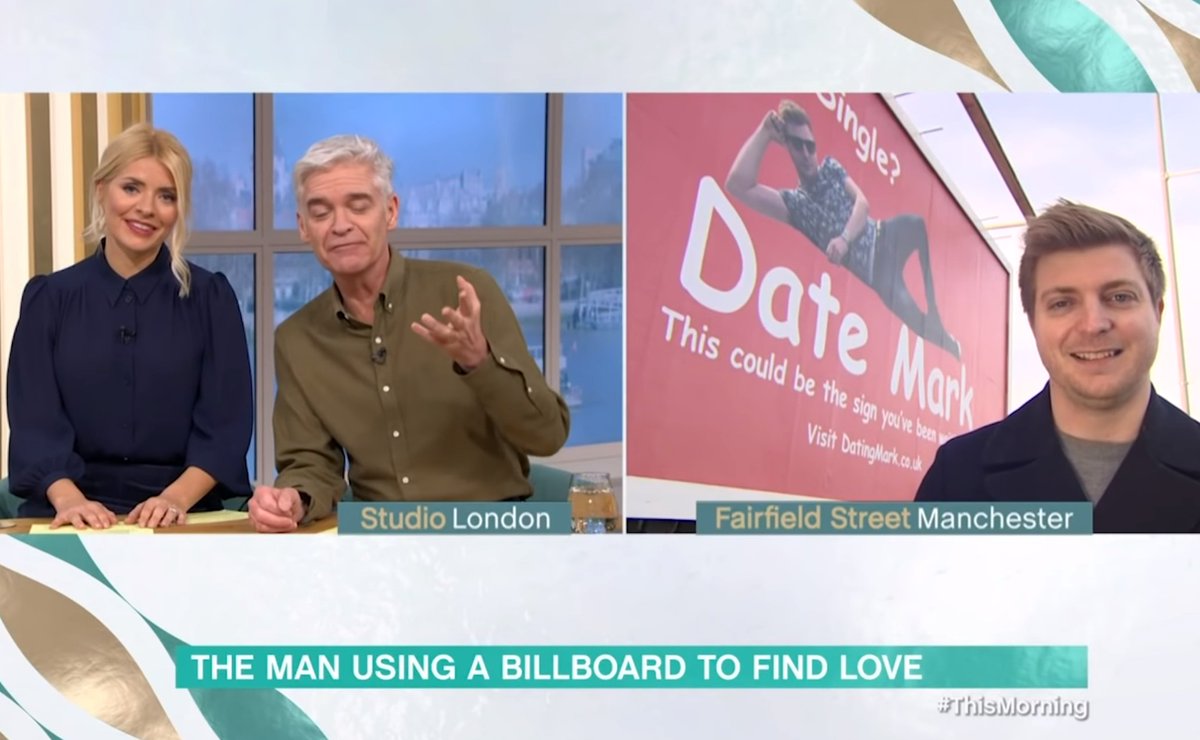
Here's the effect of his 'This Morning' TV appearance in the data. You can see the spike there, hitting 3,590 sessions within the hour.
You can also see the baseline remains raised for a couple of hours after that.
You can also see the baseline remains raised for a couple of hours after that.

Looking at the baseline there, This Morning drove around 2,750 visits direct to the website in the hour he was on.
You can see here these split fairly neatly between Organic (ie. Google), and Direct (ie. people typing in the URL directly).
You can see here these split fairly neatly between Organic (ie. Google), and Direct (ie. people typing in the URL directly).

Looking at how the traffic sent from his This Morning appearance split 'mobile' vs 'desktop' traffic (ie, people visiting on their phone while still watching TV, vs looking on a laptop/desktop), it's *all* mobile.

Each TV appearance has a spike in traffic like this. For example, here's another one - looking just at traffic from Australia, on a day where he was featured on TV over there.

For all of this he spent £425 on a billboard, plus the time to build the site, take a few interviews, etc.
That works out:
£0.18 cost per date application.
£0.00364 cost per user (or £3.64 per thousand users)
£0.00323 cost per visit (or £3.23 per thousand visits)
That works out:
£0.18 cost per date application.
£0.00364 cost per user (or £3.64 per thousand users)
£0.00323 cost per visit (or £3.23 per thousand visits)
Alongside that, he's picked up roughly 1,200 twitter followers, and the site has 174 referring domains (£2.44 cost per linking site), including The Metro, The Sun, Fox News.

I'll leave it at that for now. Any questions, do ask, and thanks to Mark for asking if I'd take a look & sharing access to some of the data.


