Chart 1
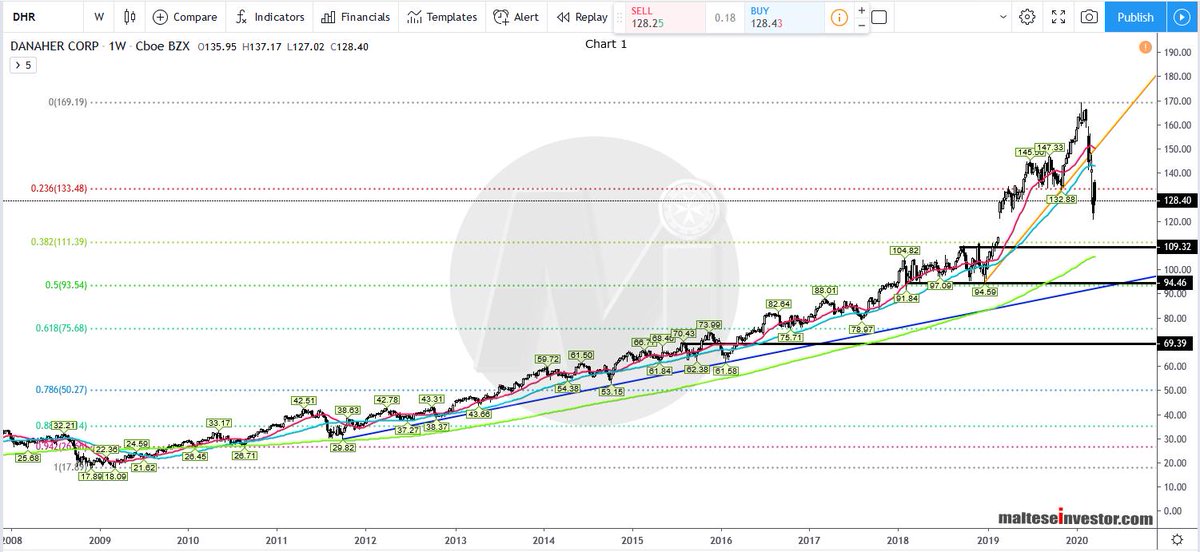
Weekly Chart: Since peaking at 169.19 (Jan. 2020) strong selling pressure has seen the price move down strongly below the one year #trendline support at 146.55 and #pivot support at 133.70. Expecting further downside probes .....
DHR 2/4
Weekly Chart: Since peaking at 169.19 (Jan. 2020) strong selling pressure has seen the price move down strongly below the one year #trendline support at 146.55 and #pivot support at 133.70. Expecting further downside probes .....
DHR 2/4
..... below the #Fib. 0.382 (111.39) support then below the #SMA 200 at 105.49. Major #support lies at the zone 94.46 - 93.54 (pivot and Fib. 0.50). To the upside strong #resistance seen between 145.75 - 149.95.
DHR 3/4
DHR 3/4