,
41 tweets,
27 min read
Read on Twitter
I recently wrote about the importance of the cash flow statement in assessing the financial performance of a football club, focusing on the Premier League. Since then I have had a few requests to do the same for the Championship, so let’s take a look in the following thread.
A club’s profit and loss account is easy to understand, i.e. basically revenue less expenses (mainly player wages), but this is a notional profit based on the accountants’ accruals concept, which can be very different from actual cash movements.
This is important, as the main reason that football clubs fail is cash flow problems. It does not matter how large your revenue is (or your profits are), if you do not have the cash to pay your players, suppliers or indeed the taxman, then you will find yourself in trouble.
This analysis will start with the familiar profit and loss account and then reconcile this to the cash flow statement to highlight the differences. It’s fairly technical, but will reveal the different business models that are employed and explain why certain clubs act as they do.
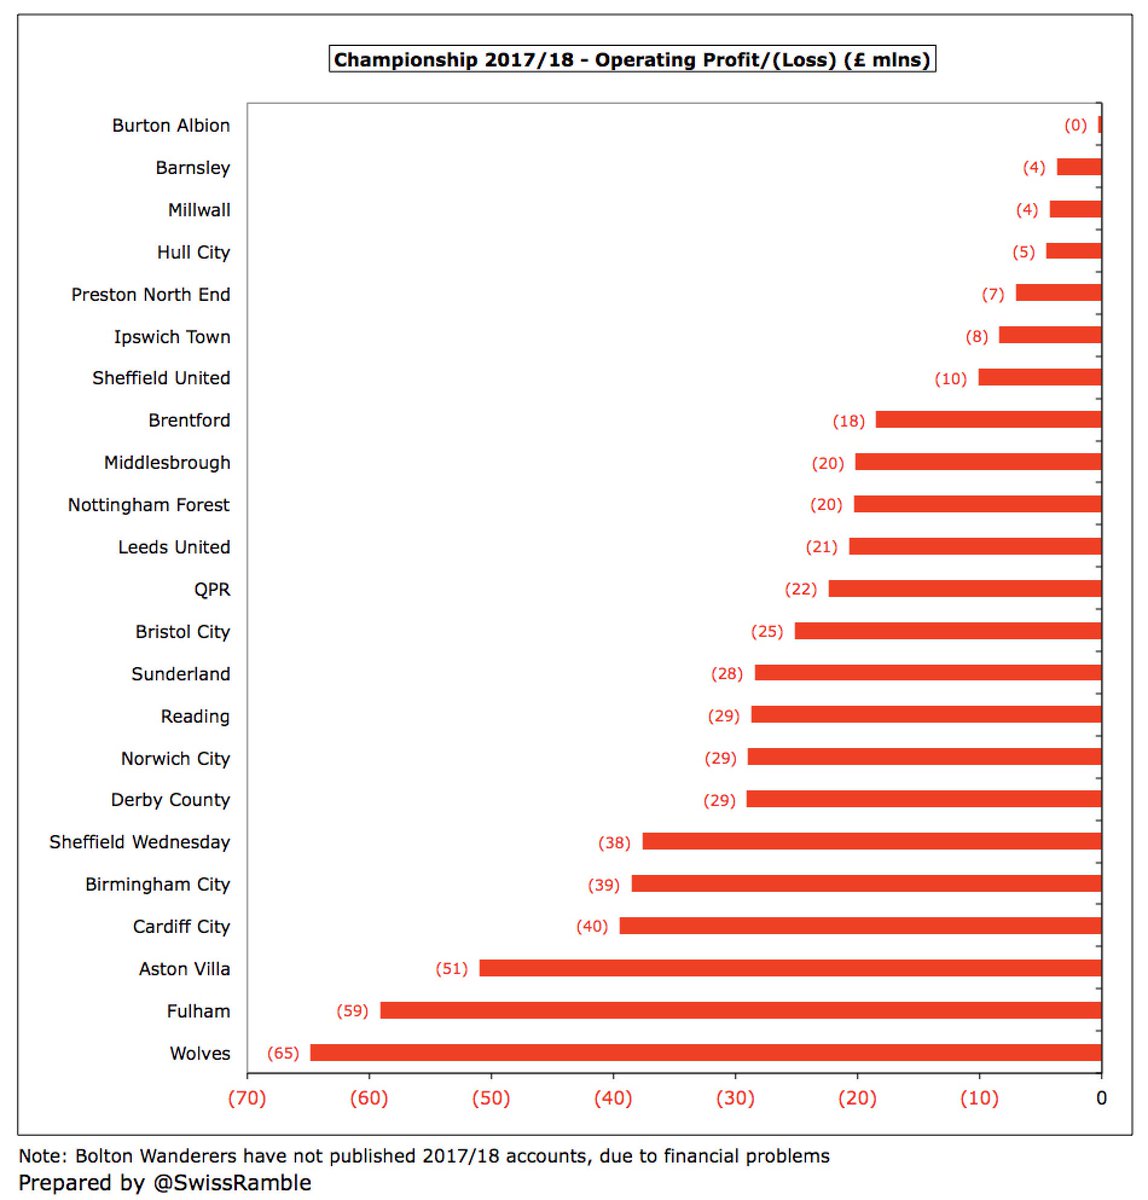
Total 2017/18 revenue in the Championship was £729m (TV £400m, commercial £177m and match day £152m), but there were hefty £572m operating losses, mainly due to £773m wages (wages to turnover ratio 106%) plus £264m player amortisation/depreciation and £259m other expenses. 

No Championship club made an operating profit in 2017/18, though 4 had losses below £5m, led by #BAFC £293k, followed by #BarnsleyFC, #Millwall & #hcafc. Huge operating losses were reported at #WWFC £65m, #FFC £59m, #AVFC £51m & #CardiffCity £40m (3 included promotion bonuses).
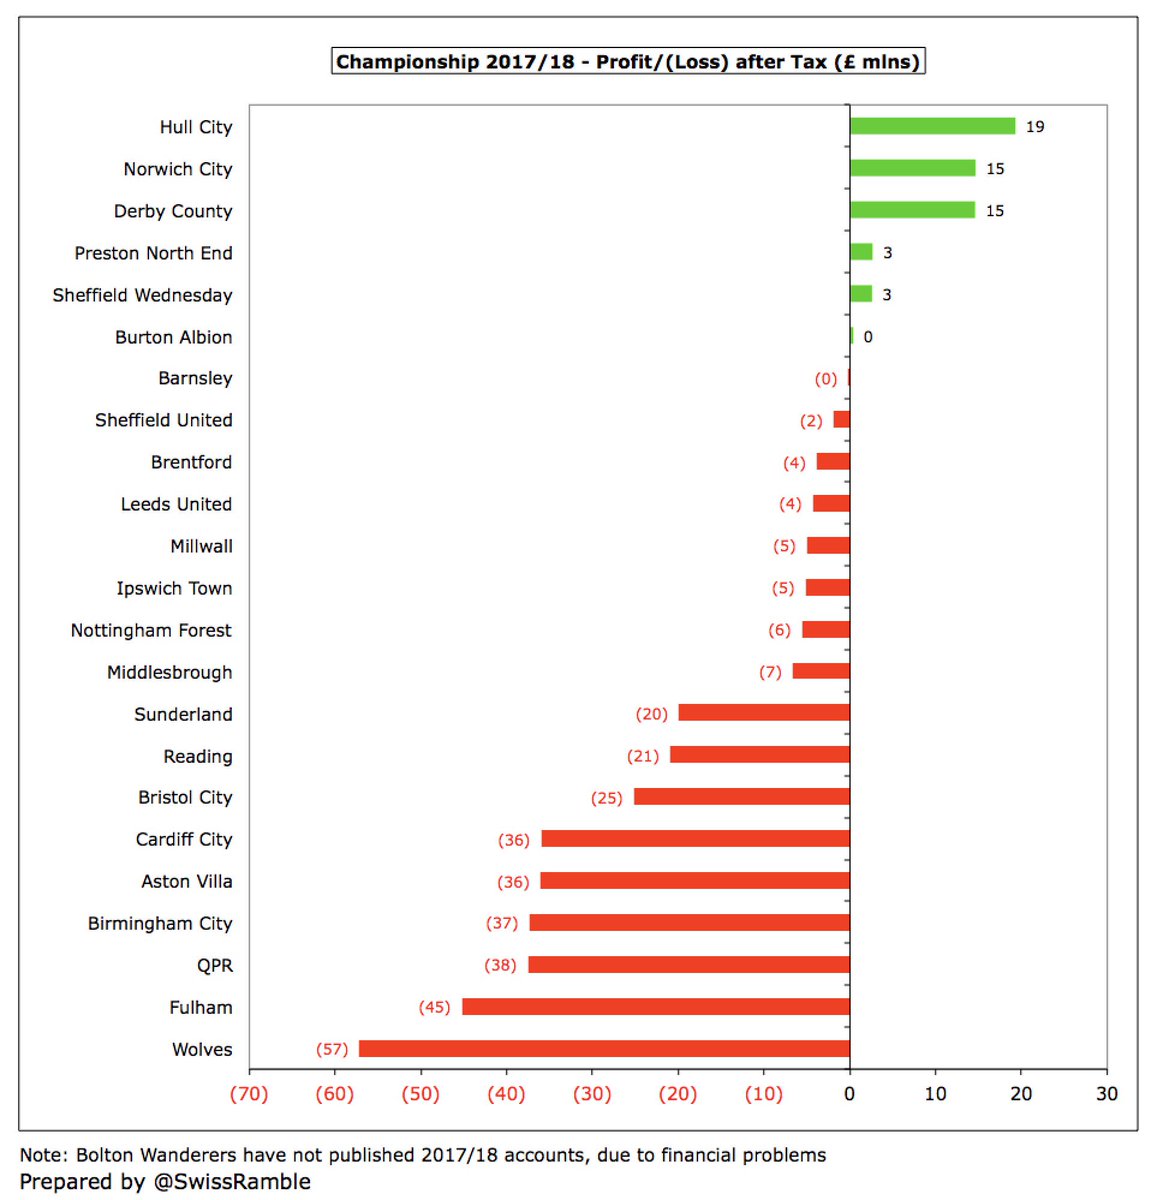
The £572m operating loss was partly offset by profits elsewhere: £219m from player sales, £78m from stadium sales and £5m exceptional items, though there was also £20m net interest payable, resulting in a £289m loss before tax. Deducting £5m tax gives a £294m loss after tax.


The profitability picture after tax is almost identical, as very few Championship clubs make enough money to pay tax. The only meaningful tax payments (around £4m) were at #hcafc and #NCFC, while #CardiffCity actually had a £3m tax credit.
The operating loss of £572m is reconciled to £301m negative cash flow from operating activities via two adjustments: (a) adding back non-cash items such as player amortisation, depreciation and impairment £264m; (b) movements in working capital £7m.

At this stage we need to understand how football clubs account for player trading, both for purchases and sales, as the accounting treatment in the profit and loss account is very different to the actual cash movements.
Football clubs do not fully expense transfer fees in the year a player is purchased, but instead write-off the cost evenly over the length of the player’s contract via player amortisation, while any profit made from selling players is immediately booked to the accounts.
So if a player is purchased for £10m on a 5-year contract, the annual amortisation in the accounts is £2m, i.e. £10m divided by 5 years. This means that the player’s book value reduces by £2m a year, so after 3 years his value in the accounts would be £4m, i.e. £10m less £6m.

If the player were to be sold at this point (after 3 years) for £12m, the profit on player sales from an accounting perspective would be £8m, i.e. sales proceeds of £12m less remaining book value of £4m.

Player amortisation is a non-cash expense, so is added back for the cash flow calculation. In the same way, profit on player sales is purely an accounting profit, which is booked in total, regardless of when the club is paid. Instead, cash flow includes cash sales & purchases.
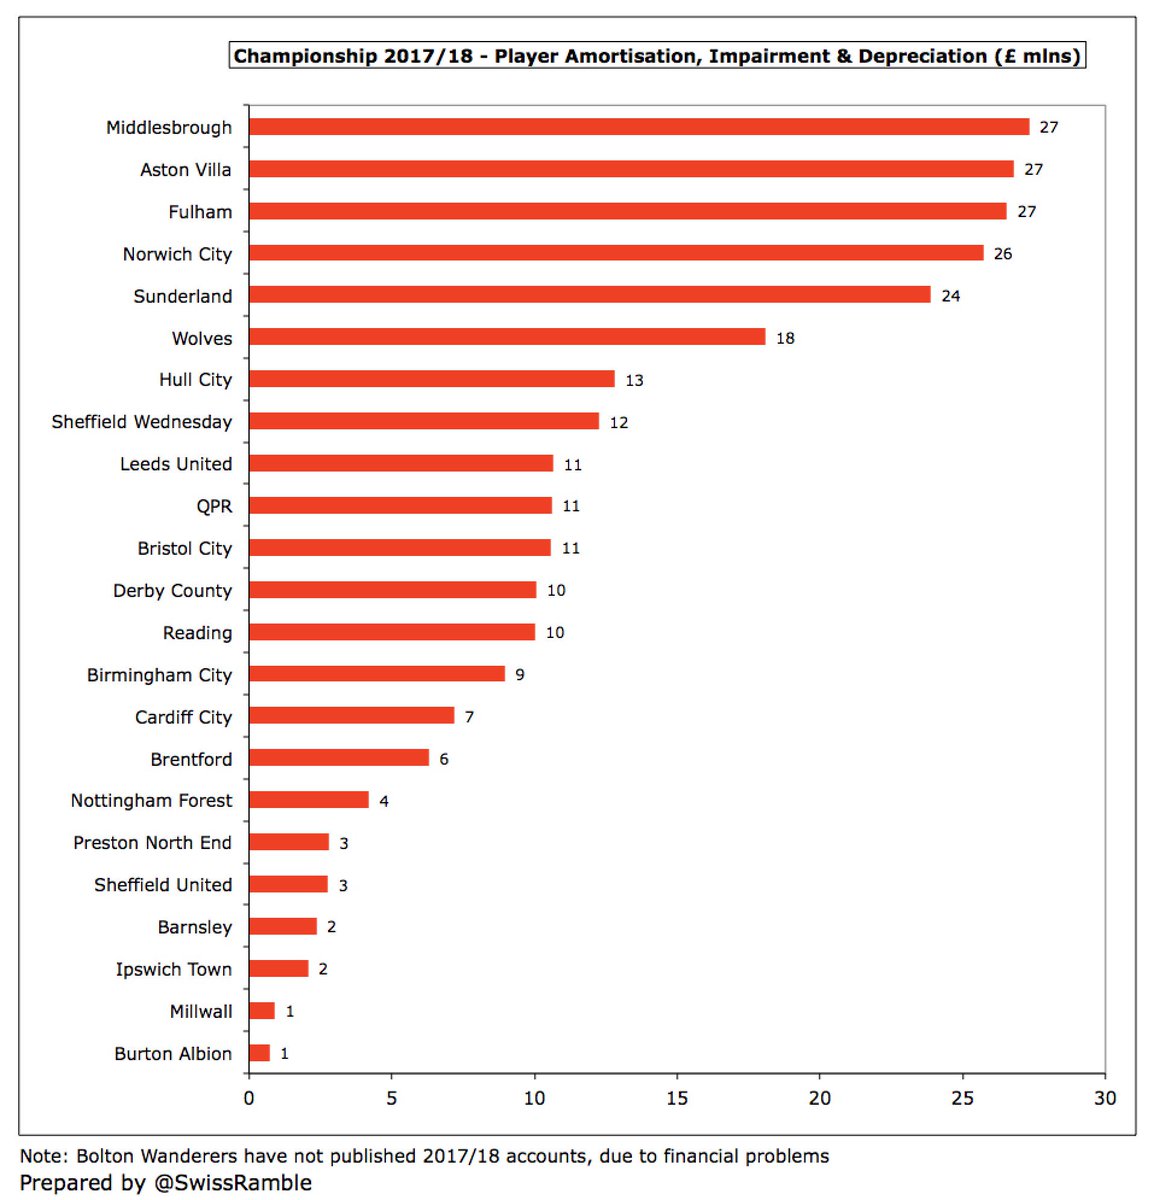
Given the rise in transfer fees, player amortisation has become a major expense in the profit and loss account, e.g. adding back #Boro £27m amortisation & depreciation moves them from £20m operating loss to £7m cash generated from operations (before working capital movements).
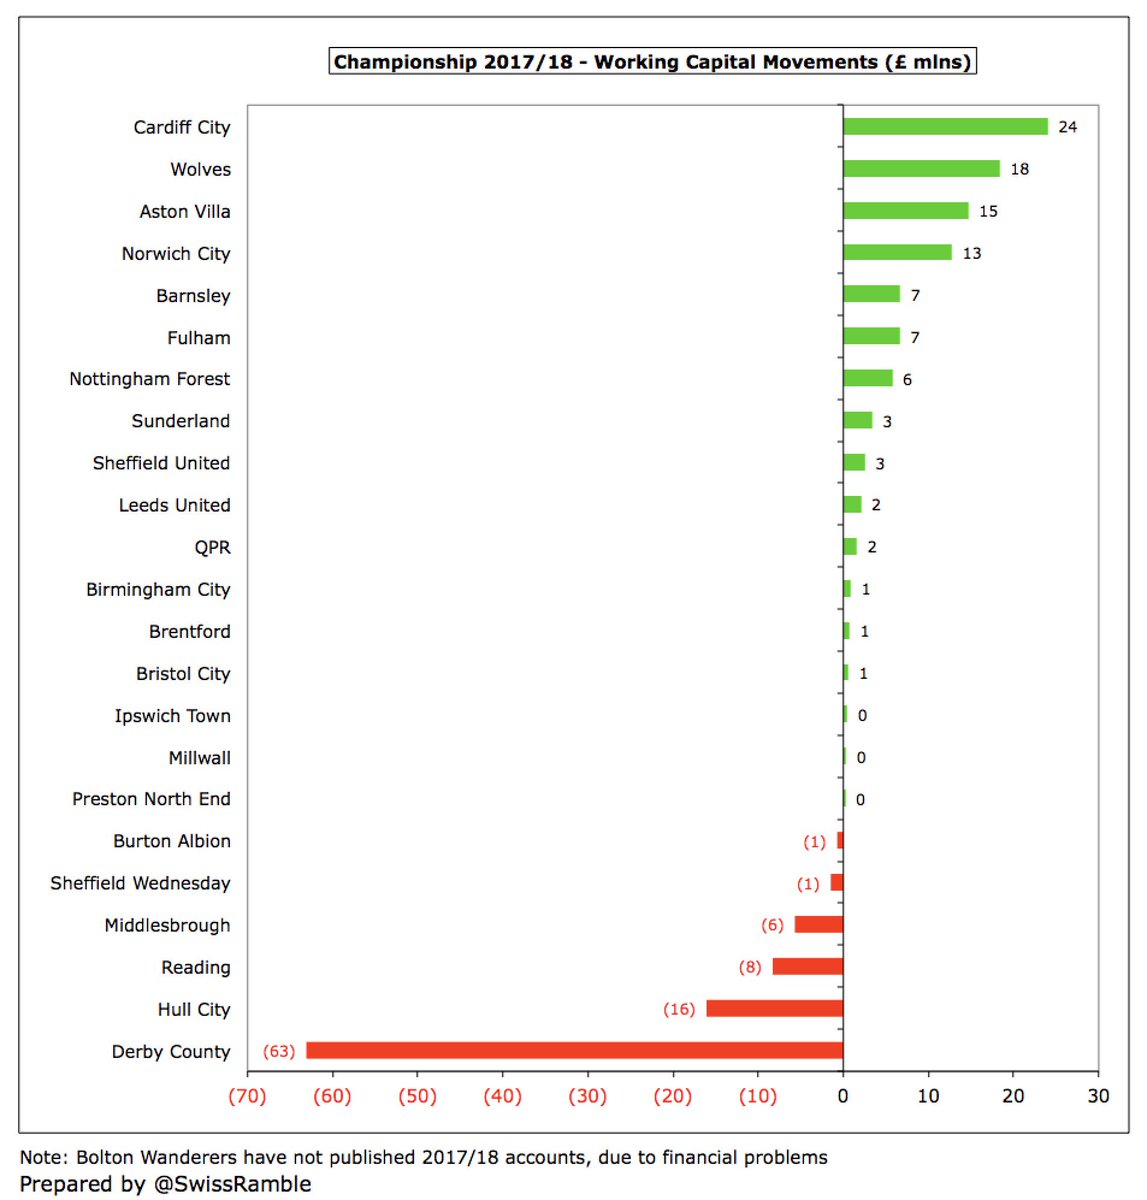
Working capital measures short-term liquidity, defined as current assets less current liabilities. Changes in working capital can cause operating cash flow to differ from net profit, as clubs book revenue and expenses when they occur instead of when cash actually changes hands.
If creditors increase, a club is paying its suppliers more slowly, so is holding on to cash (positive for cash flow). On the other hand, if a club’s debtors increase, this means it collected less money from customers than it recorded as revenue (negative for cash flow).
After adjusting for non-cash items and working capital movements, the picture looks a bit better, but is still awful with £301m negative operating cash flow. Only three clubs are positive, while around half the clubs have more than minus £10m cash flow from operating activities.

In spite of this £301m negative operating cash flow, the clubs then spent more money on buying players, investing in infrastructure or paying interest on loans and (occasionally) tax. As might be expected, given the size of the deficit, the outlays were on the low side.

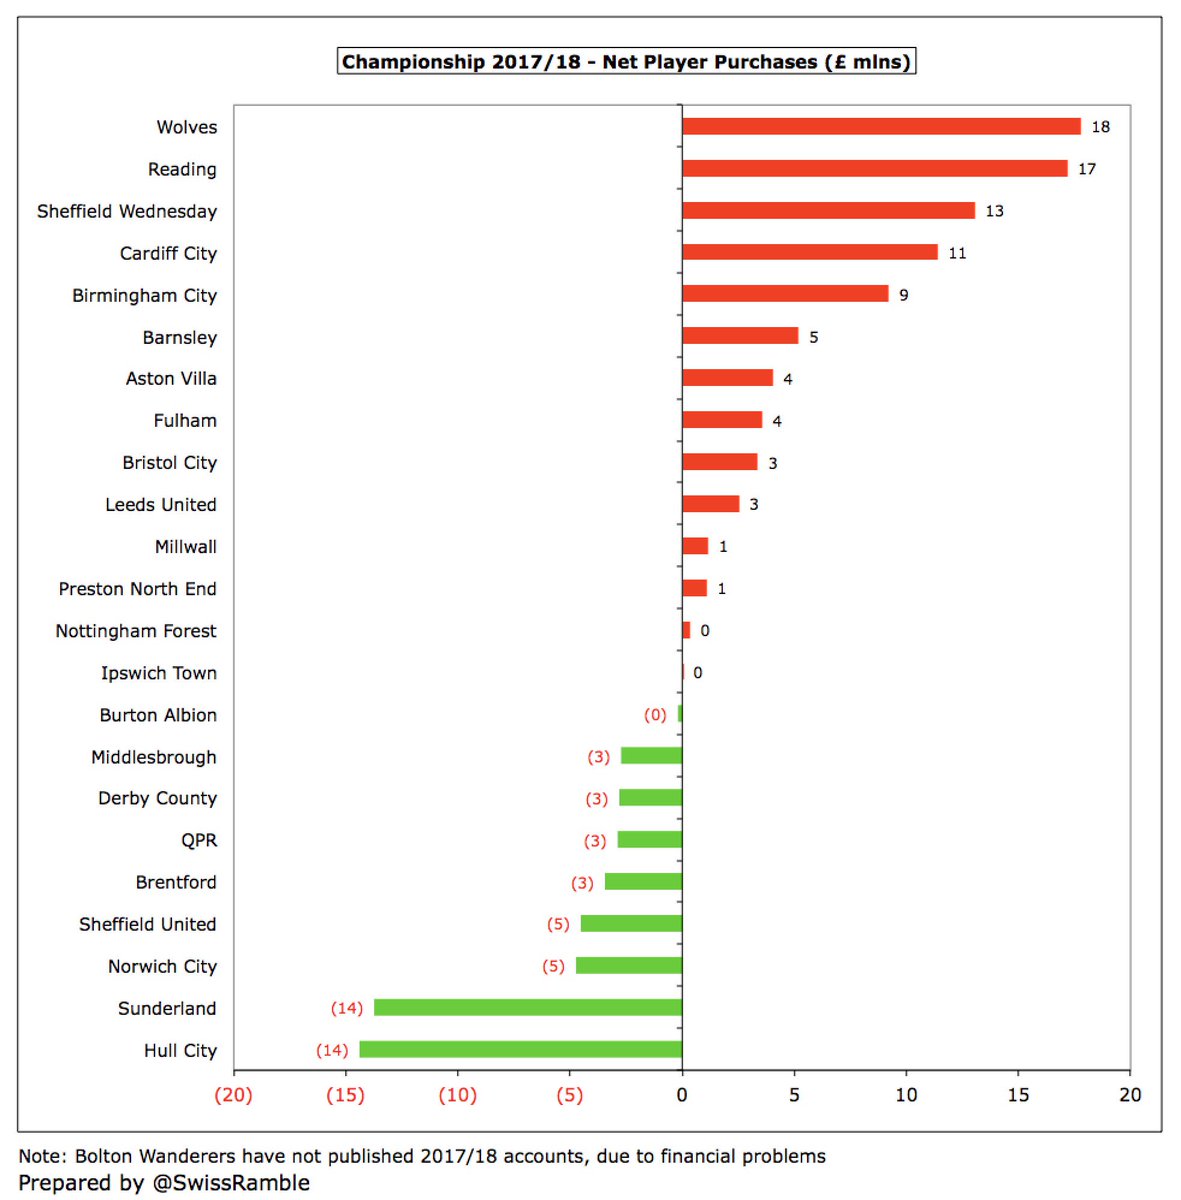
Only £41m was spent on net player purchases, led by #WWFC £18m, #ReadingFC £17m & #SWFC £13m. Nine clubs had net sales (highest #hcafc & #SAFC £14m). Cash payments on players are often very different from net spend reported in the media, mainly due to stage payments of transfers.
The cash figure for transfers is the only authentic figure publicly available, but it can also be a bit misleading, as it may not cover the entire fee due to payments made in instalments. Paying transfer fees in stages is increasingly used by some clubs as a source of financing.


A good example of differences in player trading accounting, on a cash basis #NCFC had £25m player sales and £20m player purchases, giving net player sales of £5m, which is significantly lower than the £48m profit on player sales reported in the profit and loss account.
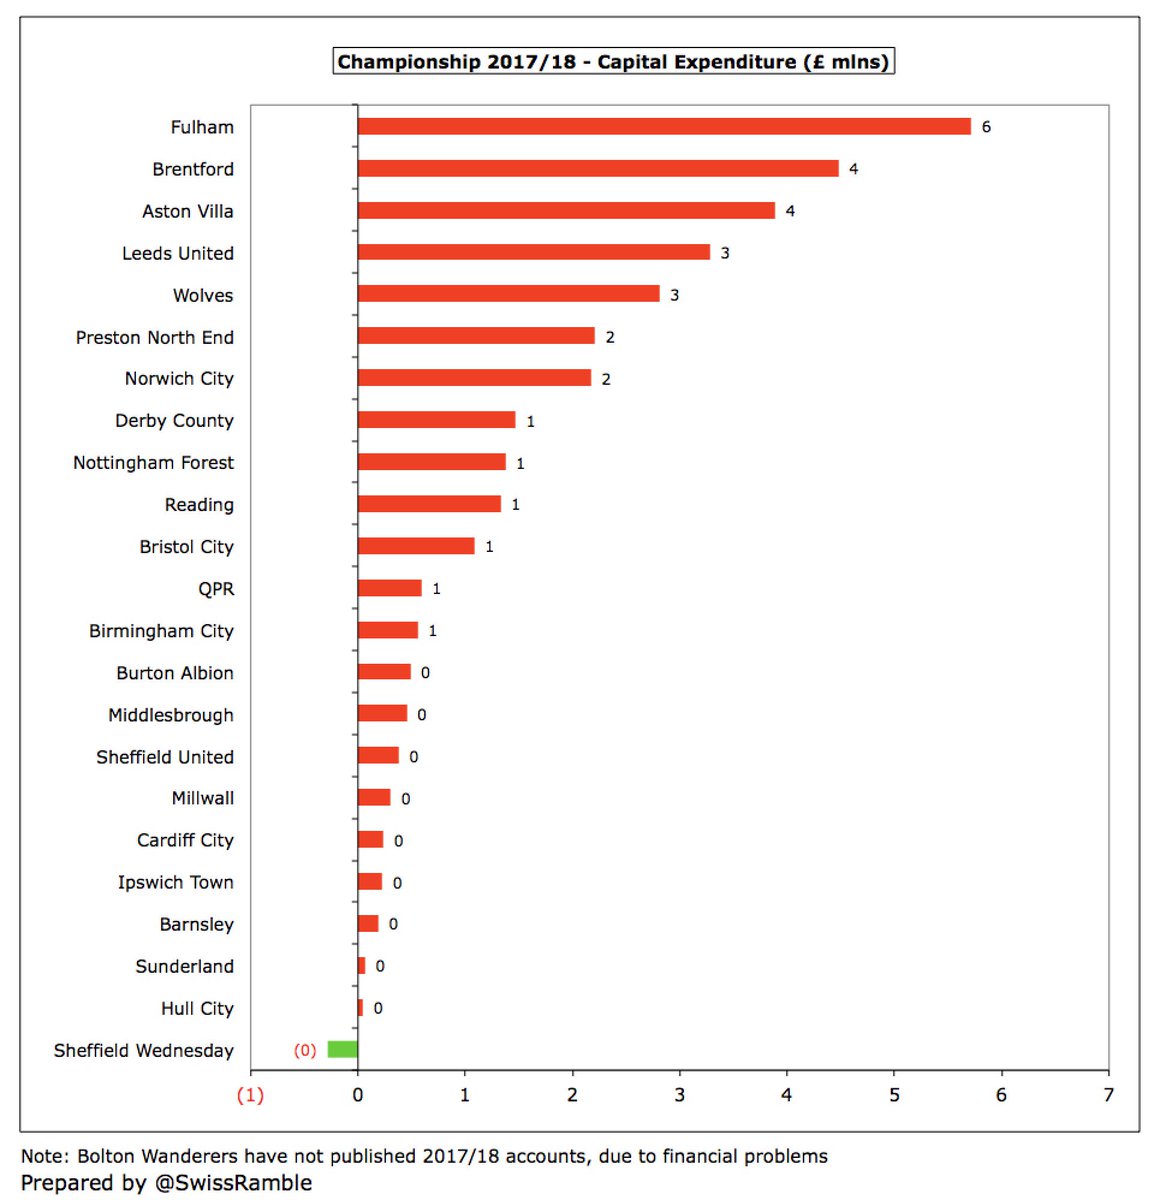
Championship clubs only invested a total of £33m in infrastructure in 2017/18, mainly for development of stadium and training ground. Only four clubs spent more than £3m with #FFC £6m leading the way, followed by #BrentfordFC £4m, #AVFC £4m and #LUFC £3m.


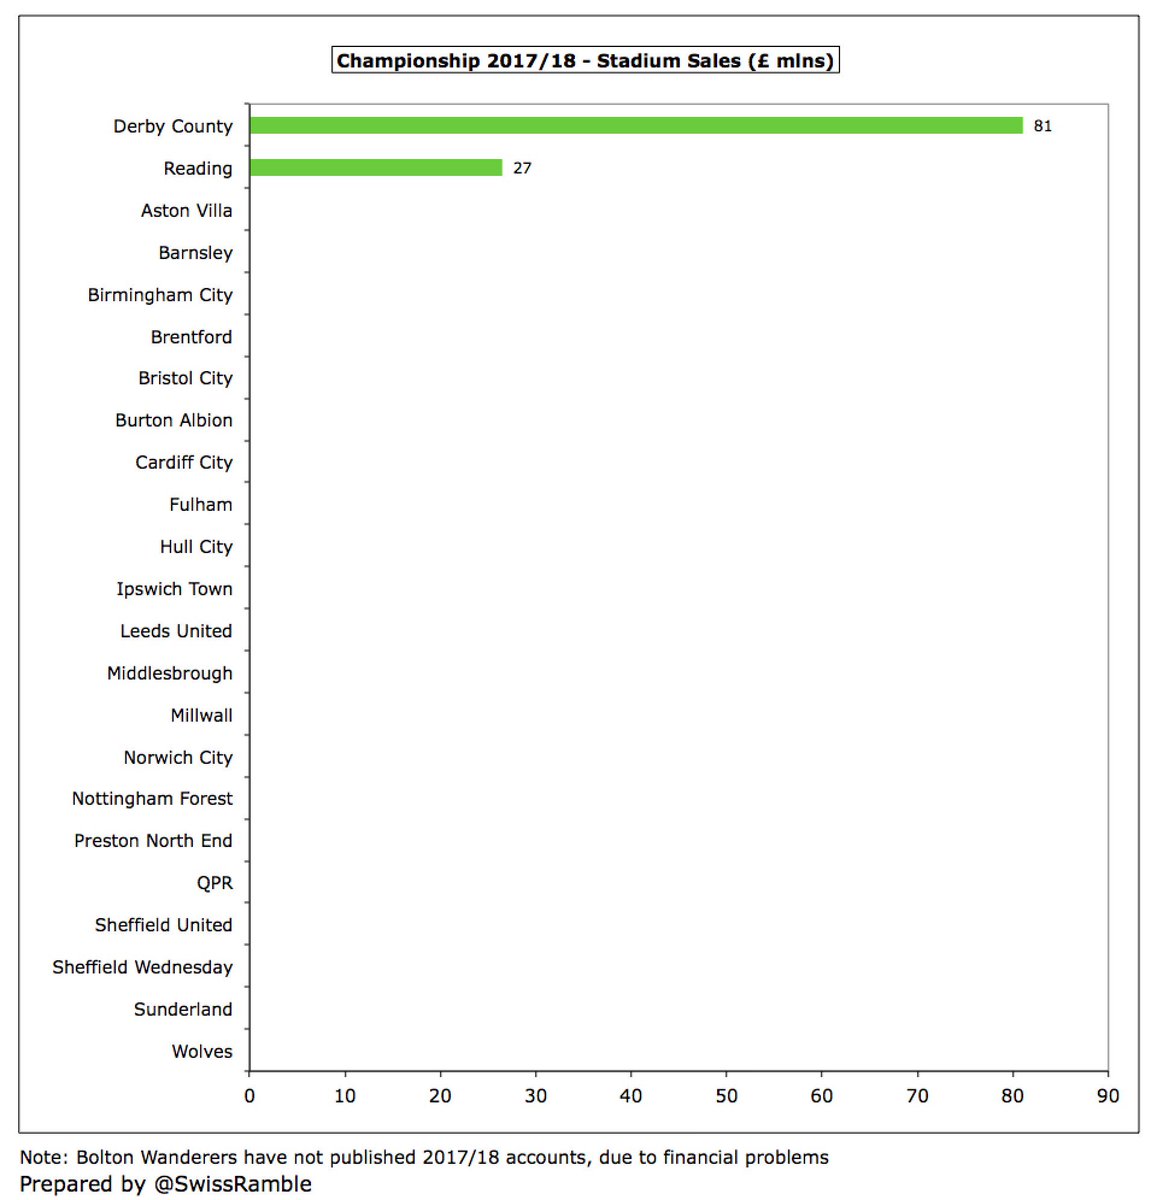
In 2017/18 we saw a number of Championship clubs sell their stadiums, almost certainly to help meet FFP requirements. This boosted the cash flow at #DCFC by £81m and #ReadingFC by £27m. No cash benefit for #SWFC stadium sale, so it looks like this was only an accounting entry.

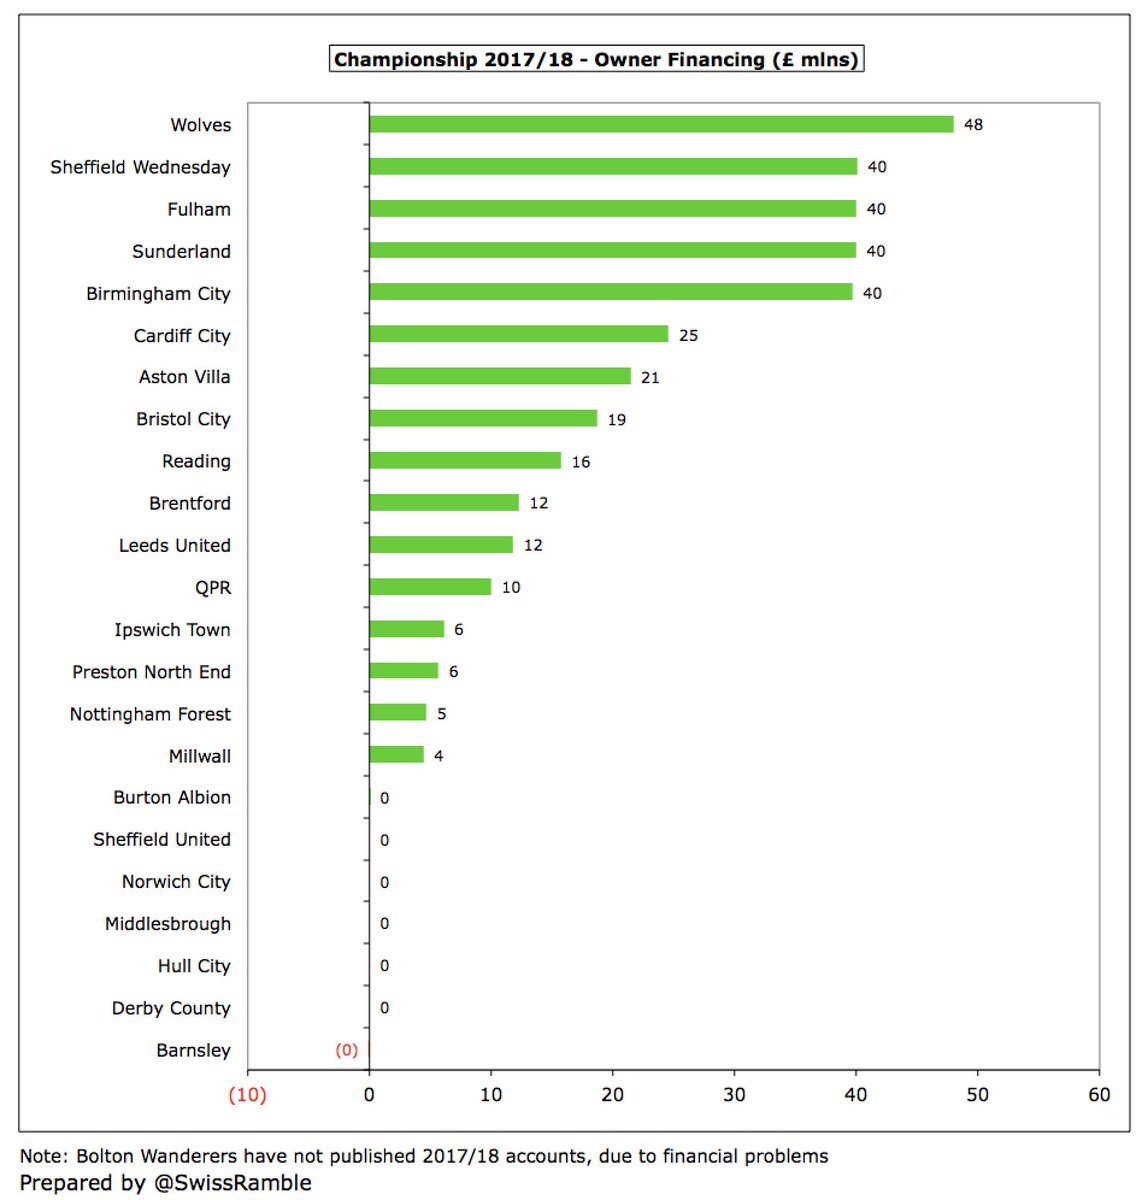
Fortunately, this £284m cash loss is almost entirely covered by around a quarter of a billion of financing to give a net cash outflow of (only) £31m. This is very largely from the owners who provided £343m funding, while a net £90m of external loans were repaid.

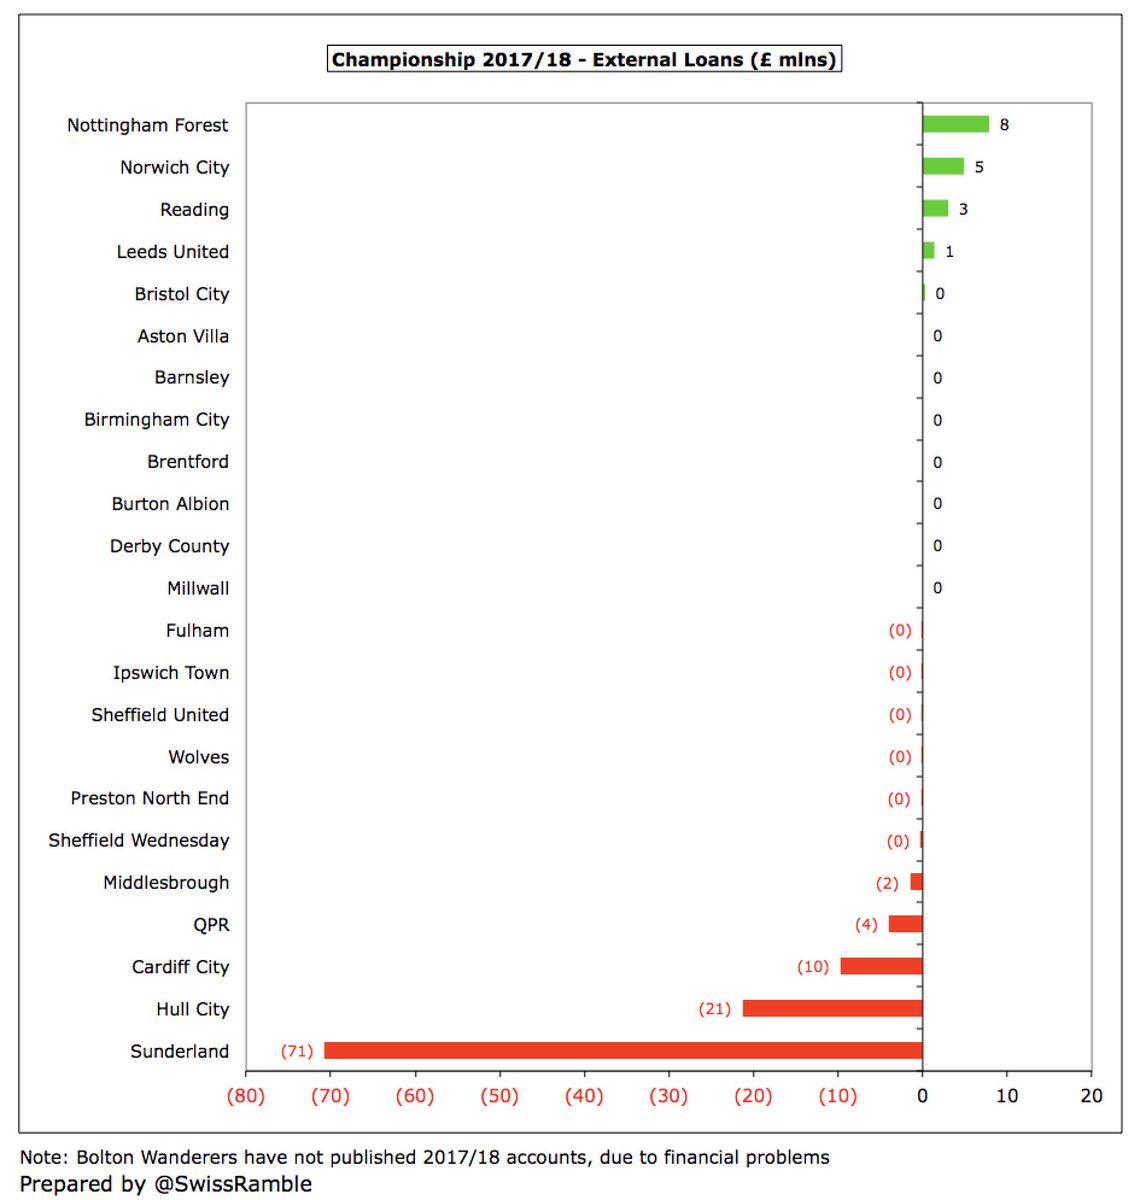
Very little funding was provided by the banks with the highest amount only £8m at #NFFC. Sizeable repayments made by #SAFC £71m (as part of Ellis Short sale of the club), #hcafc £21m and #CardiffCity £10m (Tormen Finance, where chairman Mehmet Dalman has a significant interest).

This has been quite technical, but those wishing to understand a football club’s finances and the impact these have on its strategy should, as always, follow the money. That means not just focusing on the P&L, but also looking into the mysterious world of the cash flow statement.
What is clear is that the Championship is a highly unprofitable division – and it is getting worse. Despite revenue growth of just £24m (3%) in 2017/18, wages shot up £113m, while player amortisation/impairment rose £64m, leading to operating losses widening from £400m to £572m.

Amongst other things, this analysis has shown that Championship clubs are only kept afloat by massive funding provided by their owners: £343m in 2017/18 alone. If we add £108m from stadium sales to the owners, they spent a cool £450m for the privilege of owning a football club.

Leaving aside any issues with the Championship’s Profitability and Sustainability regulations, a business model where the owner finances a football club’s losses can work fine – right up to the point when the owner stops providing funds for whatever reason. That’s the danger.