WTR 2/7
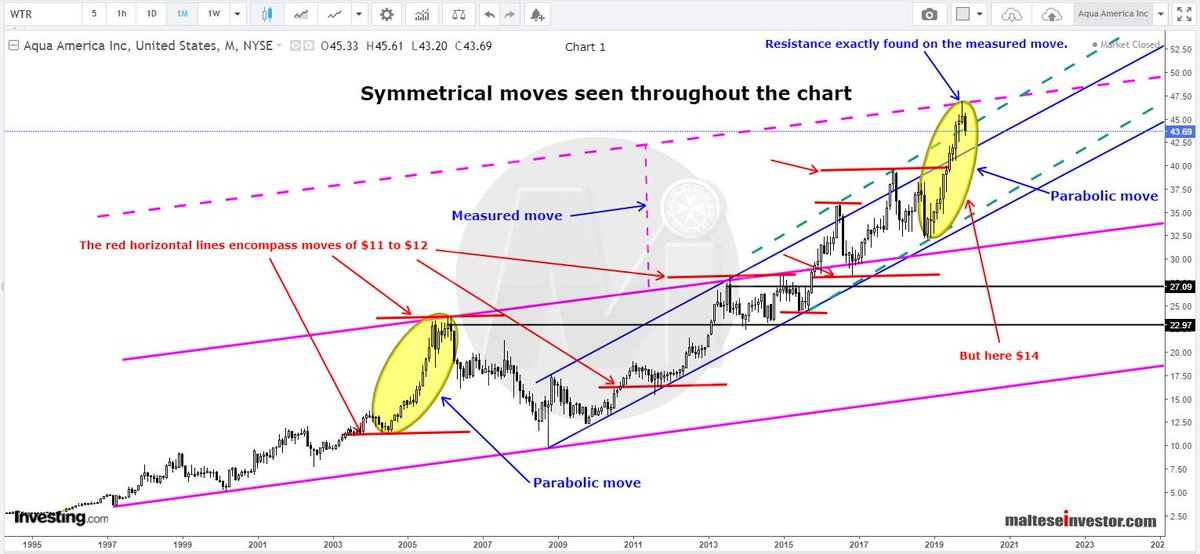
Monthly Chart: There have been 2 #parabolic moves and 2 semi-parabolic: Aug. 2004 - Feb. 2006, May 2012 - Aug. 2013, Sept. 2015 - July 2016, and Dec 2018 - Oct. 2019. The true parabolic moves are marked with an ellipse. ....
WTR 3/7
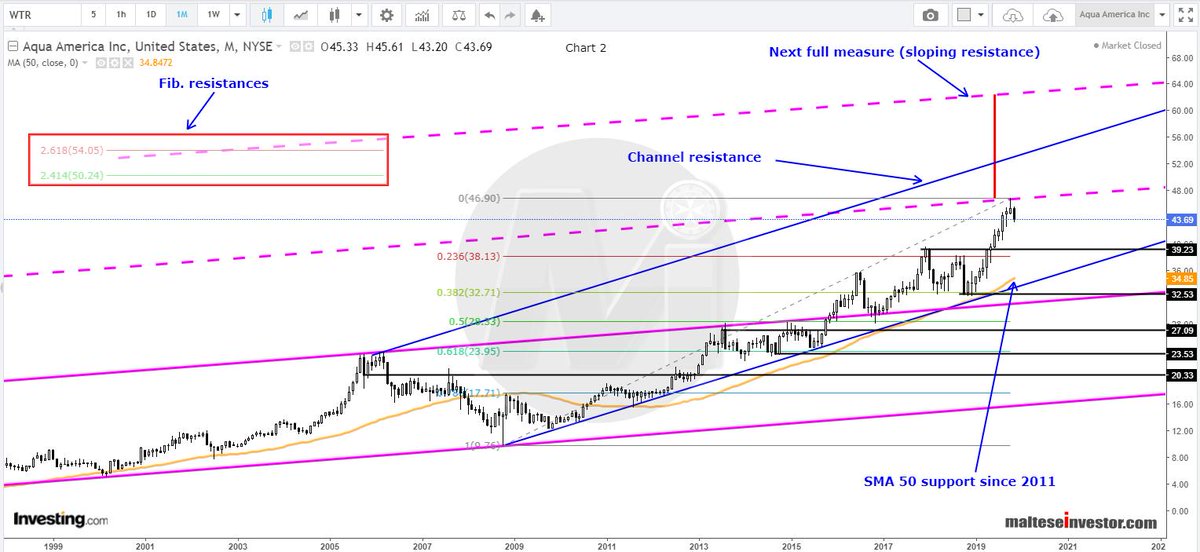
Monthly Chart: #Fib resistances calculated from the 1997 low to the swing high of 2006 (left of the chart). Channel resistance marked in blue and another measured move that sees this stock trading towards $63. The SMA 50 has supported the rising trend since 2011.
WTR 5/7

Weekly Chart: Multiple #strategies printed in the image.
The last marked "Risky Trade" is for day and short term traders and should be entirely avoided, especially if one is not savvy on how to cover his/her tracks quickly. ....
WTR 6/7


