A thread on an interesting report by Goldman Sachs' Peter Oppenheimer, the bank's chief global equity strategist. He points out that Goldman's "Bear Market Risk Indicator" is looking ominous. 
There are three factors that suggest that the recent stability could evaporate and that equities are "about to enter a sustained bear market", Oppenheimer says.
First is the fact that growth, inflation and interest rate outlook is unfriendly for equities.

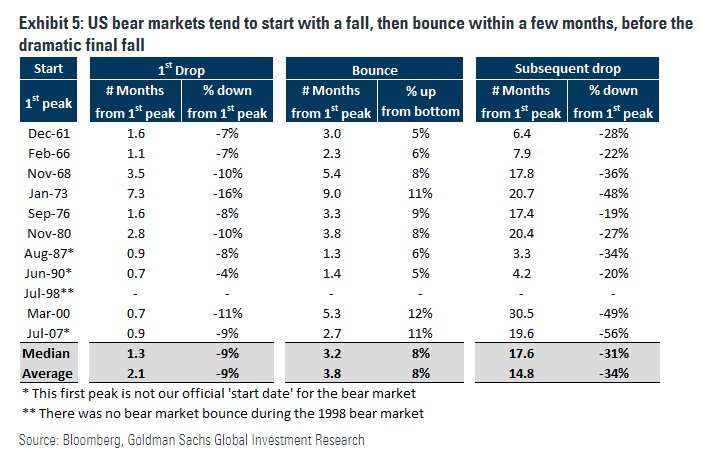
Second is that greater volatility, such as multiple corrections and new peaks (which we've seen in 2018) tend to presage a full bear market.
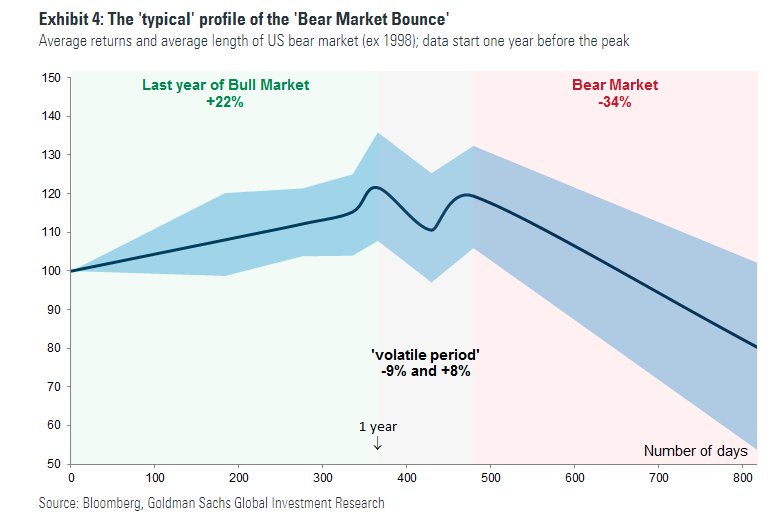
Here is Goldman's data showing how falls and bounces tend to come ahead of "the dramatic final fall".
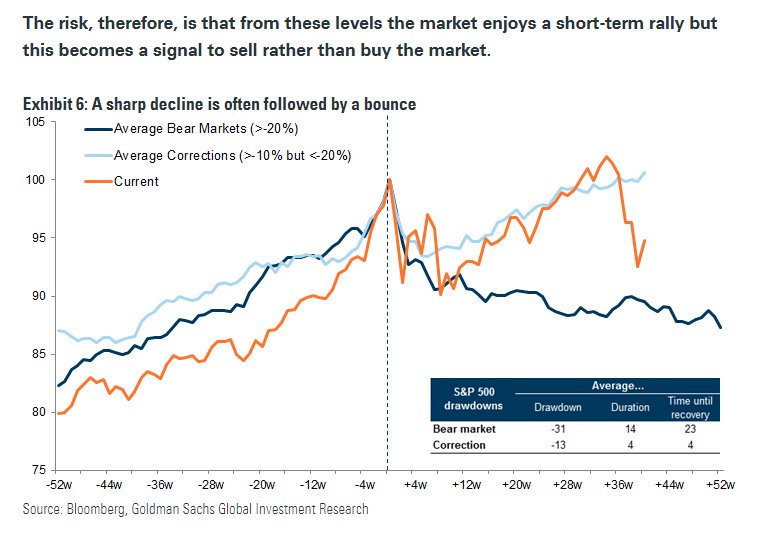
Oppenheimer: "The risk, therefore, is that from these levels the market enjoys a short-term rally but this becomes a signal to sell rather than buy the market."
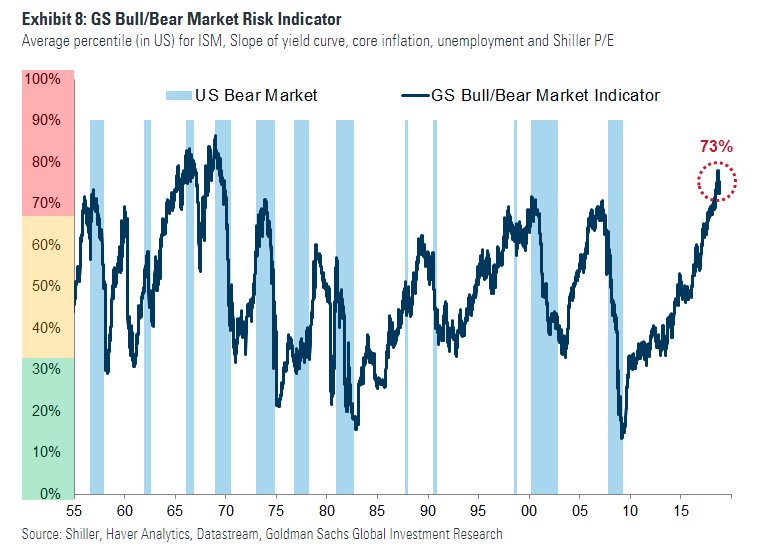
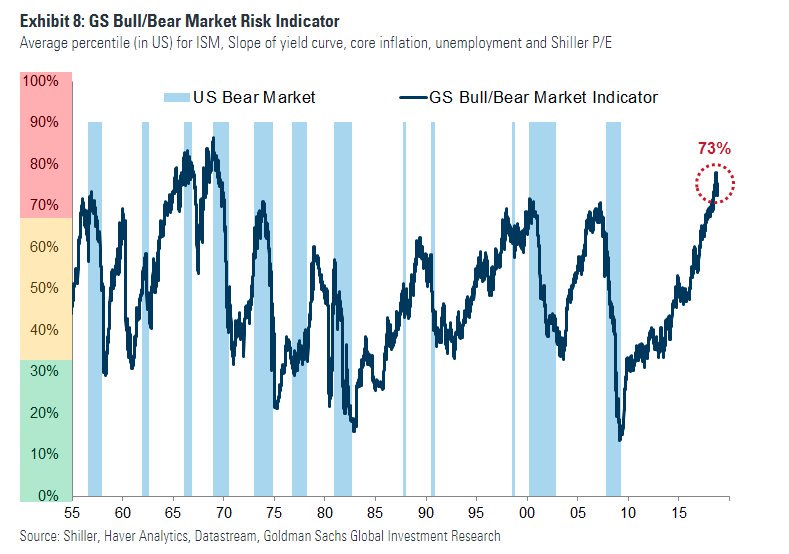
Oppenheimer's third reason to worry is Goldman's own bear market risk indicator (made from a mix of jobs data, inflation, yield curve and valuations). When it rises above 60% it has historically been a good time to turn cautious, and its currently at 73%.
However, on balance Goldman's Oppenheimer says a prolonged period of more subdued returns is more likely than an outright crash, mostly because valuations are now actually pretty modest after October's slump.
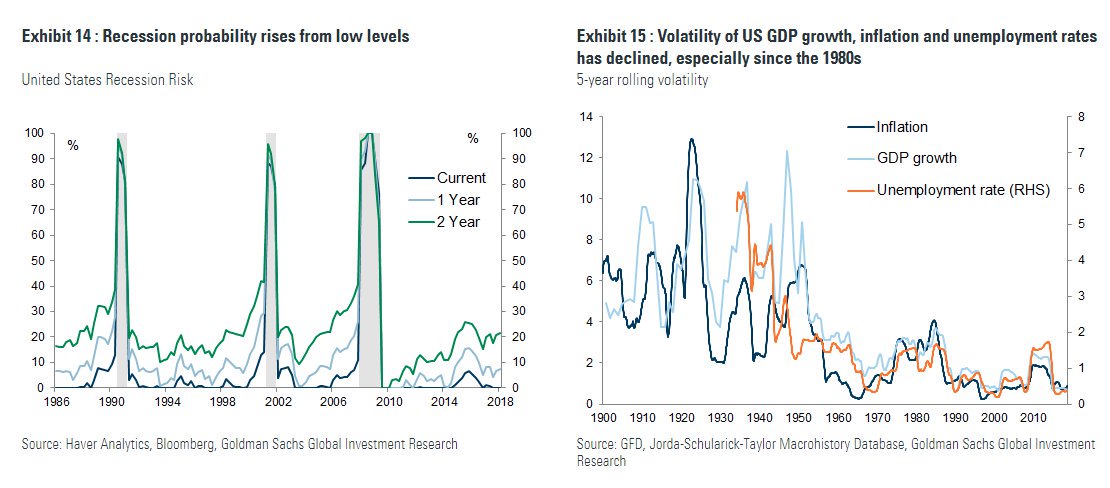
Goldman also reckons growth will slow but stay positive, points out the multi-decade trend towards less economic volatility. and doesn't see any major financial imbalances.
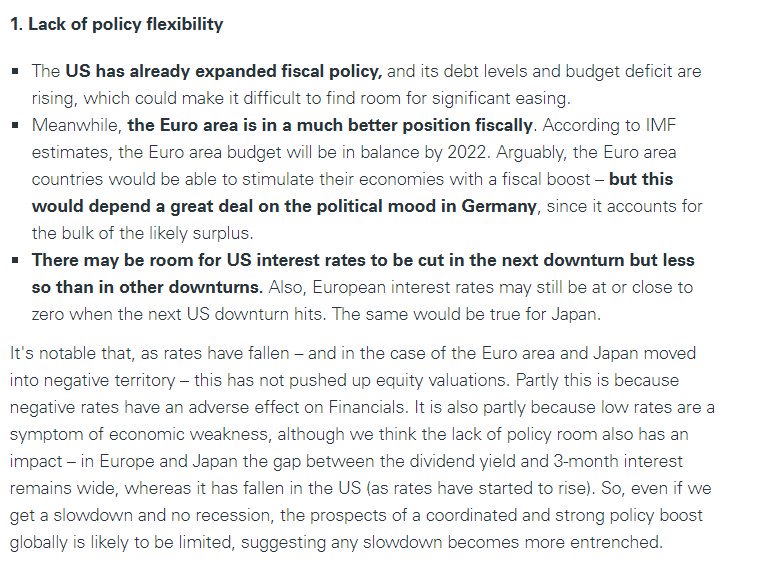
Against that, Goldman can see three causes for concern. 1. A lack of fiscal and monetary policy flexibility in the US, with budget deficit ballooning and interest rates still low compared to history.
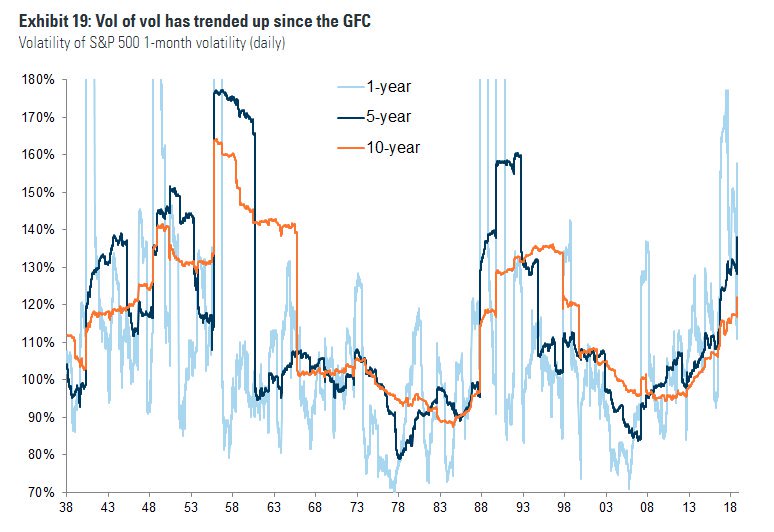
Secondly, (and a subject dear to my heart), the seismic shift towards more machine-driven markets, which seems to have lifted the volatility of market volatility, even as economic volatility has drooped lower.
Thirdly, Oppenheimer highlights concentrated flows, ETF explosion, positioning and crowding, which could lead to more exaggerated market moves in a downturn.

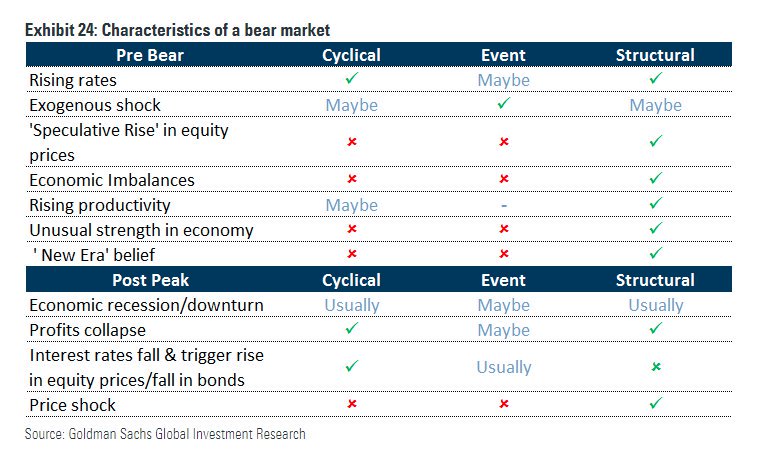
The report ends by examining the anatomy of different types of bear markets, categorizing them into the classic cyclical downturn, event-driven ones triggered by an external shock, and structural ones, driven by financial bubbles and imbalances.
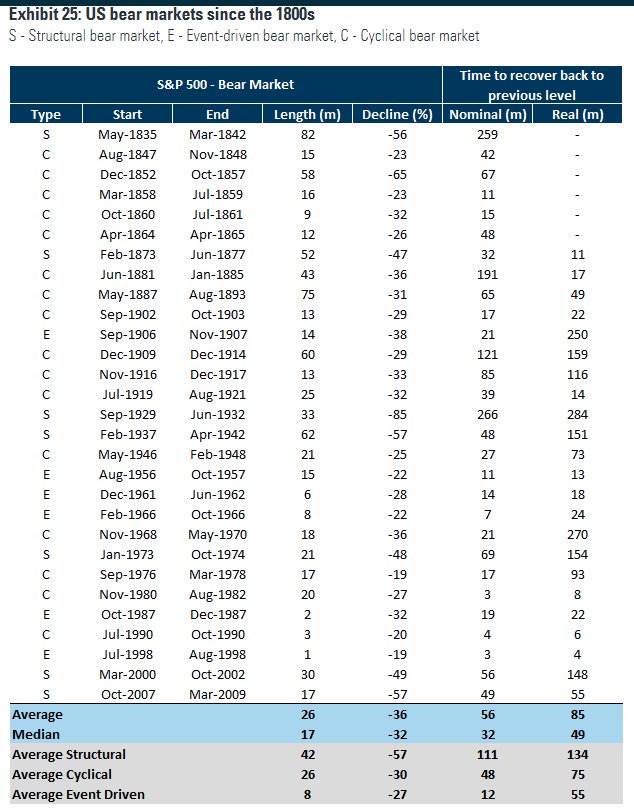
Here is a list of every US bear market since the 1800s, categorised according to type, and with how long they lasted and how long the recovery took.
FIN.