1/n
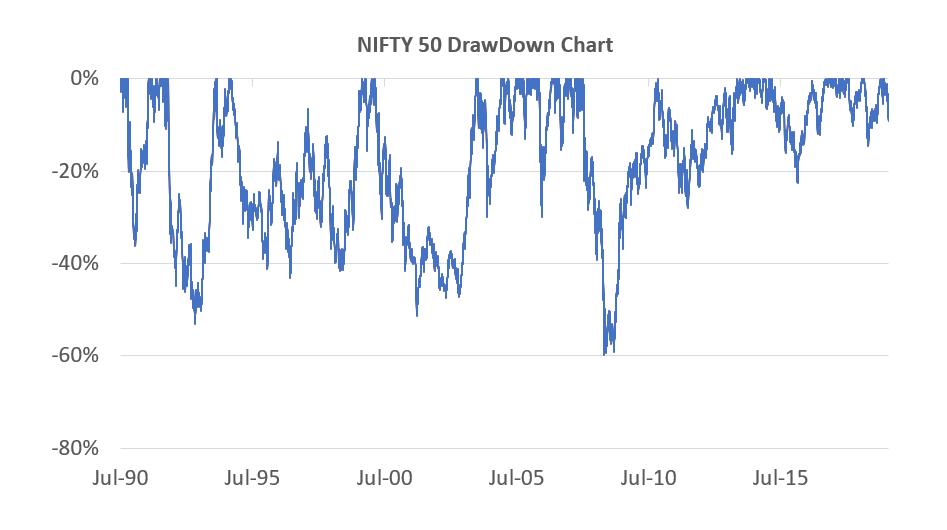
Drawdown - "A drawdown is a peak-to-trough decline during a specific period for an investment"
For eg. Nifty 50 went from 12,088 to 10,980 since early June or a Drawdown of ~10%.

The markets are almost always in a drawdown.
Only 6% of trading days since 1990 produced new market highs i.e for 94% of trading days the market was in a drawdown.
The average drawdown for NIFTY 50 over the past 29 years has been -18%!!
So what about a -10% drawdown.
Nifty 50 has been in a -10% or worse drawdown in 59% of the trading days since 1990.
Read the above sentence again.
#KnowYourMarketHistory
How about 1-years return after a -10% or worse drawdown?
There is a 68% chance that the 1-year return after a -10% drawdown will be positive.
The average 1-year return observed over the past 30 years post a -10% or worse draw is 21%.
If that sounds exciting, do know the downside too.
The worst 1-year return observed post a -10% or worse draw is -50%!! You can still lose half of what is left.
But, the best 1-year return observed post a -10% or worse draw is 312%.
#EquityIsVolatile
What if the market sinks another 10% for a drawdown of 20%?
39% of the time Nifty has been in a -20% or worse draw since 1990. Avg 1-year return is 27%, and you can still lose 44% from there in the worst recorded case.
So, there you go.
It is never as bad as it seems. The historical odds are good and the only requirement from the investor is to avoid the behaviour gap.
kuvera.in/blog/how-to-br…
#KeepYourSIPRunning
If you find this useful please retweet so other investors can get the data and context behind recent market moves and not look at them in isolation.


