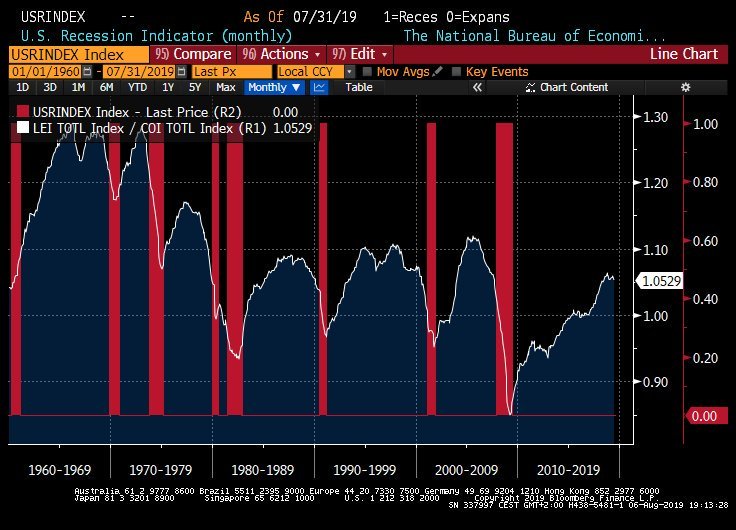
#USA Mid-cycle slowdown or outright recession? Let's review some forward-looking indicators.


#USA The ratio of the leading indicator and coincidence indicator has also started to roll over.
cc @Conferenceboard
cc @Conferenceboard
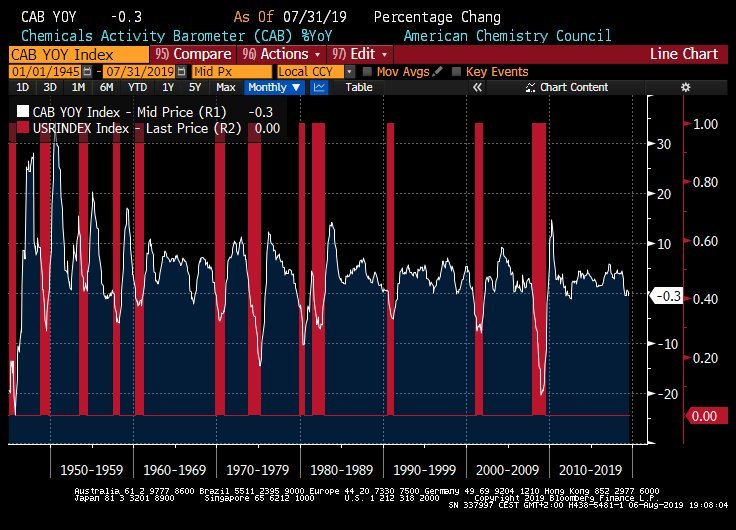
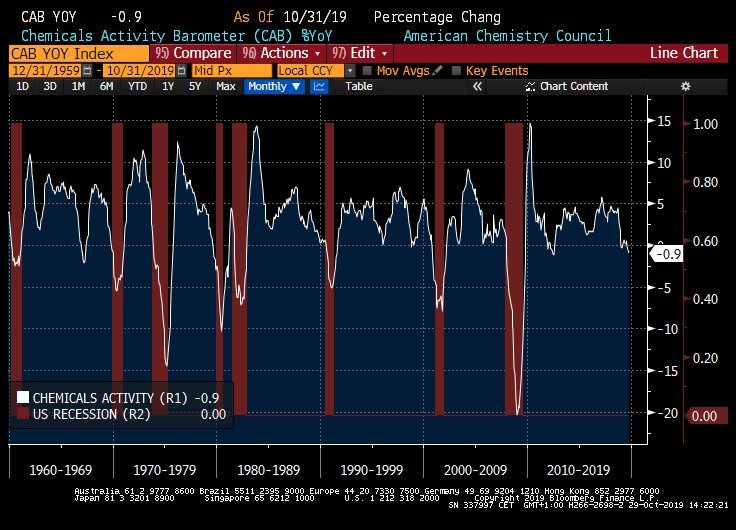
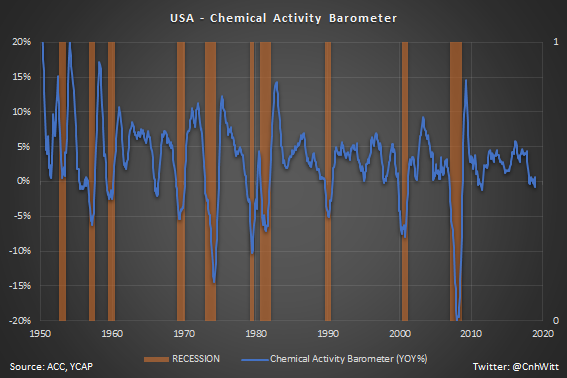
#USA The Chemical Activity Barometer, a leading indicator for the US chemical industry, is also negative year-on-year. Note that chemicals are used in so many products and processes that the chemical industry may be considered a bellwether of economic activity.
cc @DrTKSwift
cc @DrTKSwift
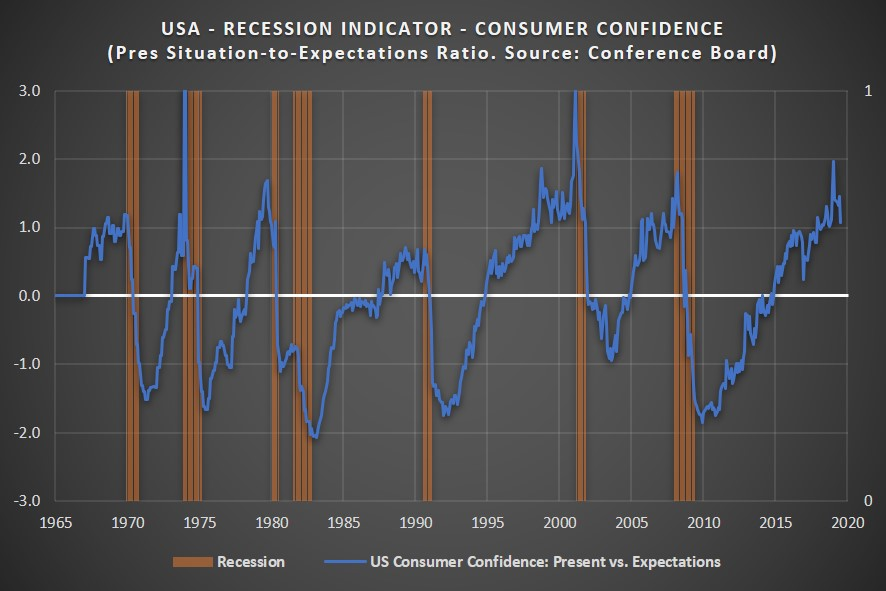
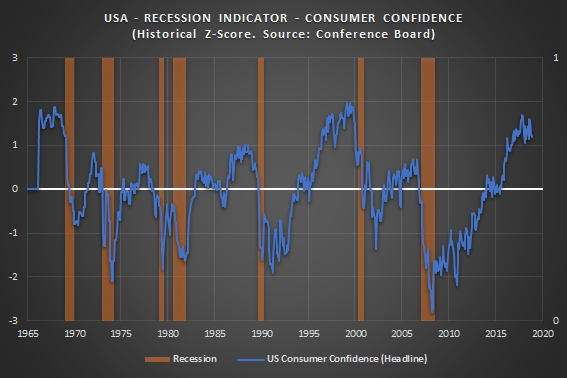
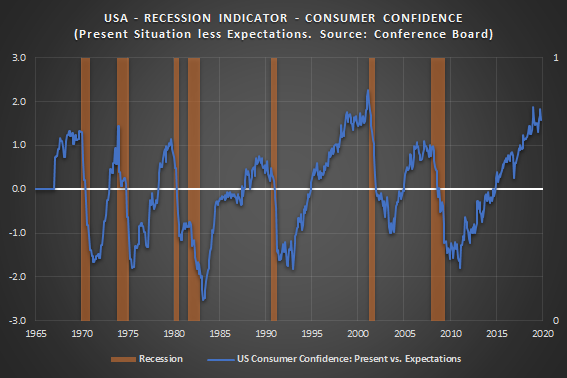
#USA Headline consumer confidence may look great, but consumers' current assessment has fallen relative to their expectations.
cc @EconguyRosie
cc @EconguyRosie
#USA Rather grim macro picture as many leading indicators have started losing momentum.
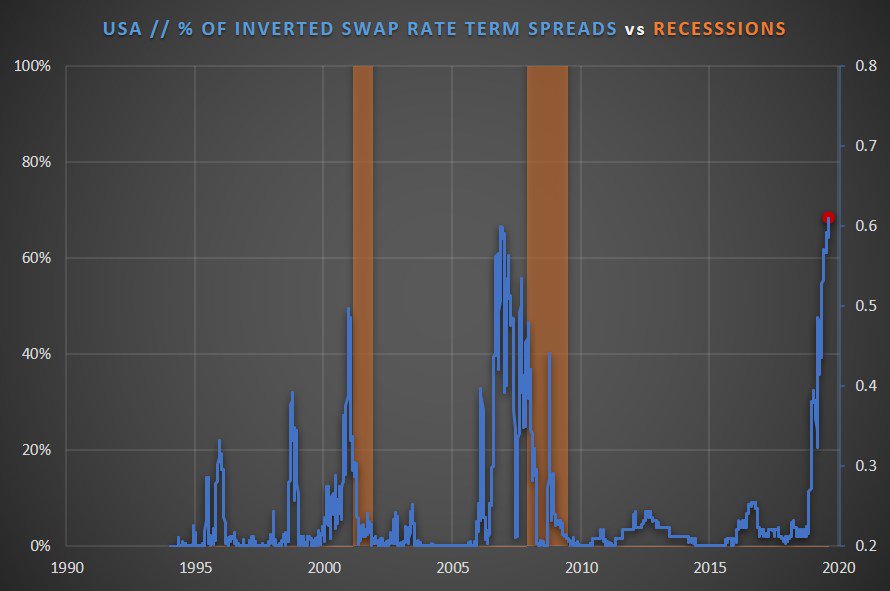
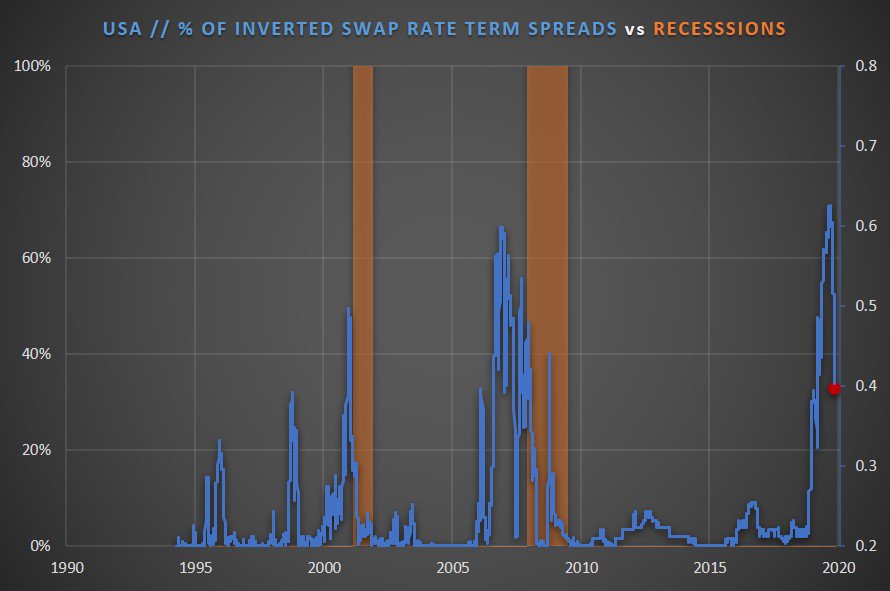
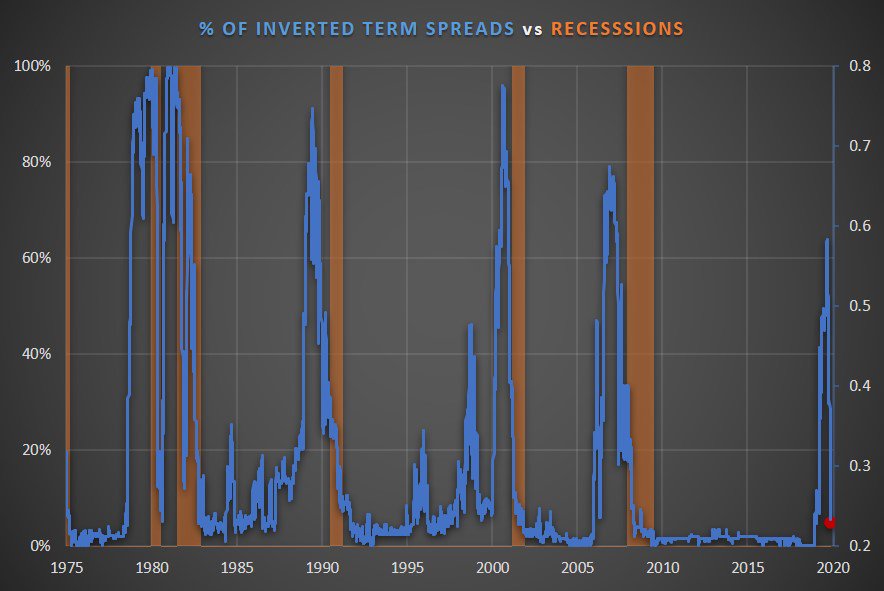
#USA Nearly 70% of the USD swap rate curve are now inverted. That's the highest share on record since 1994.
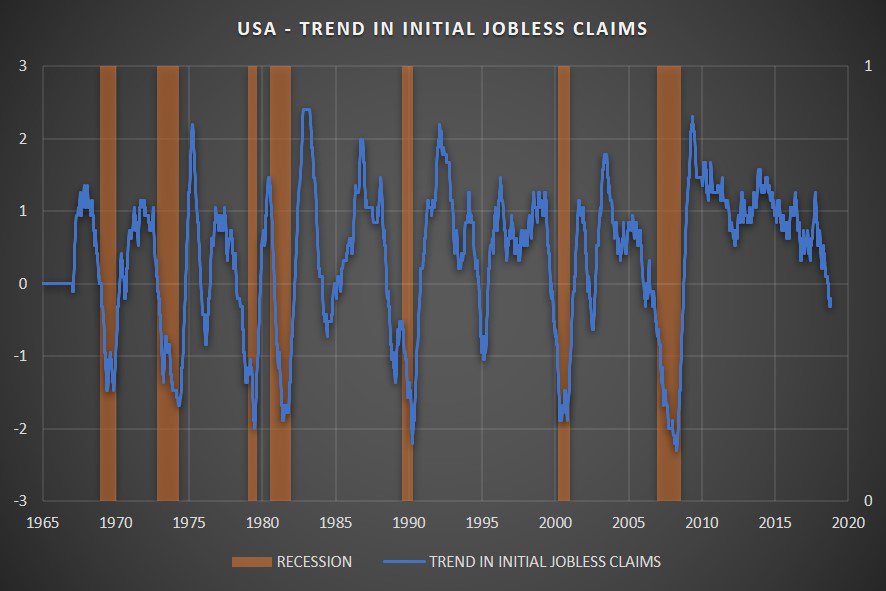
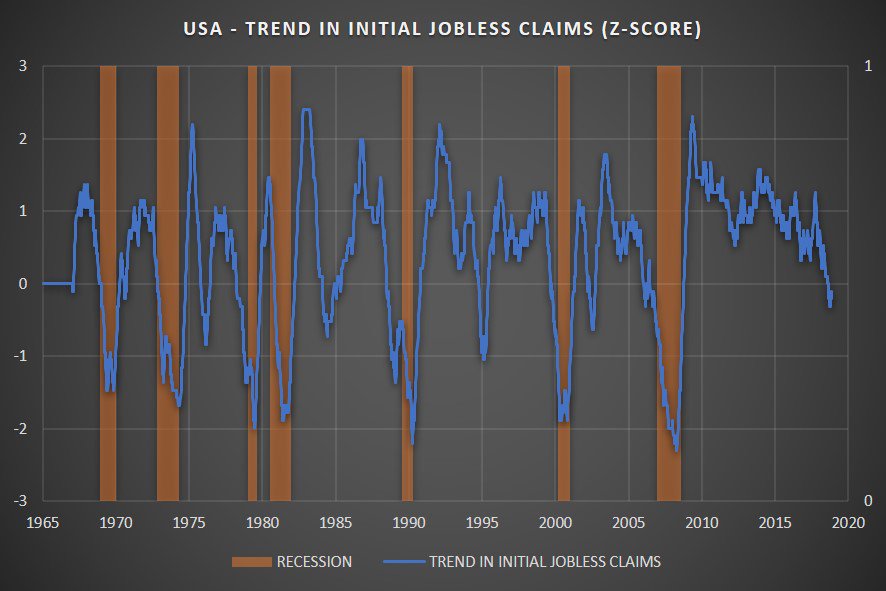
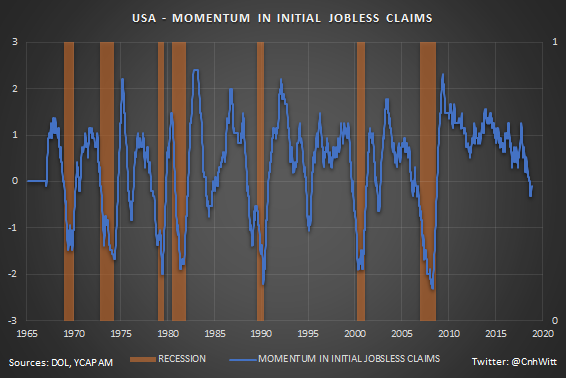
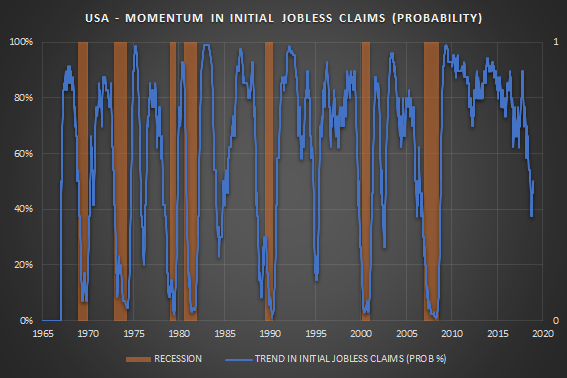
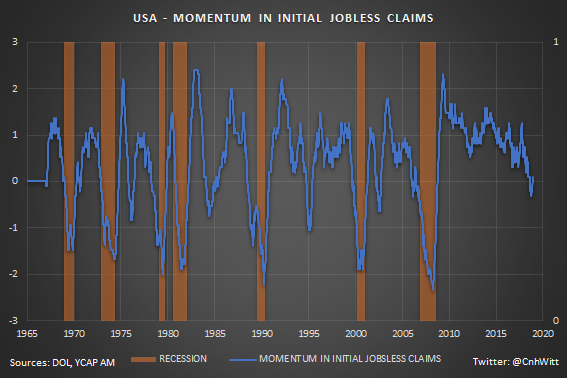
#USA Momentum in the labour market has slowed considerably over the last 12 months. Initial jobless claims show no trend at all. This is the lowest reading since the 2010 recovery.
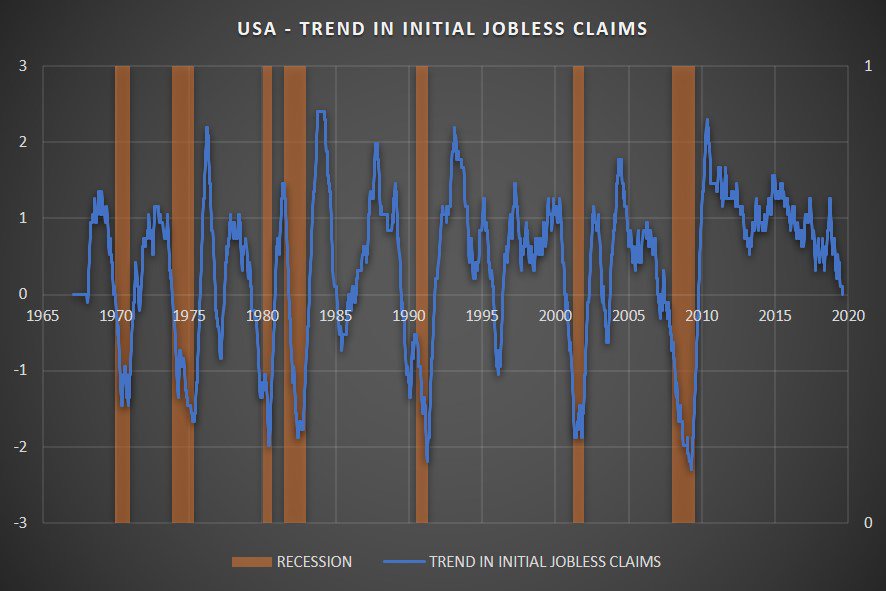
#USA Initial jobless claims point to a momentum reversal in the labor market. My trend indicator has turned negative for the first time since October 2009.
#USA Today's jobs report shows that weakness starts showing up in employment data. Over the last 12 months, the number of downward revisions exceeds upward revisions. Red flag.
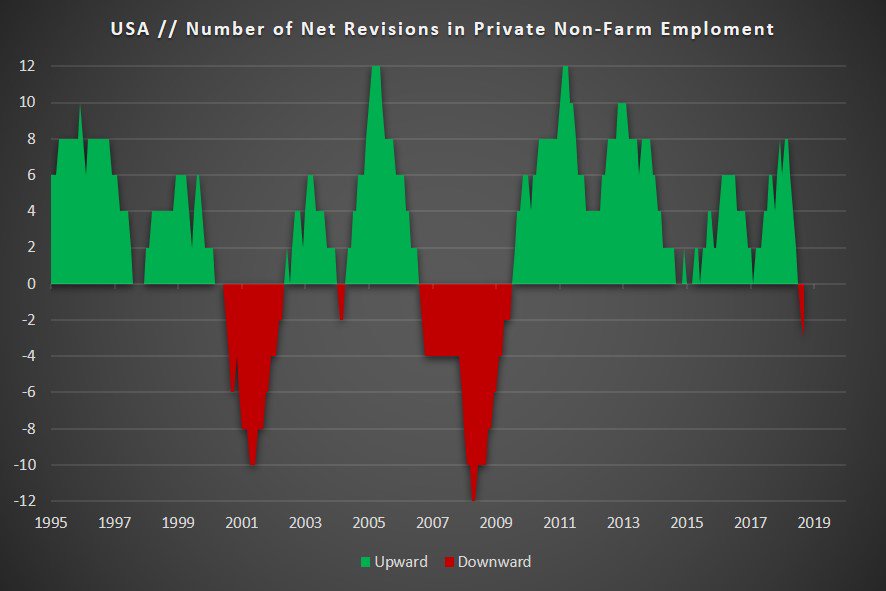
#USA Falling industrial metals + inverted yield curve + trend reversal in initial claims + rising downward revisions of employment data = economic weakness ahead
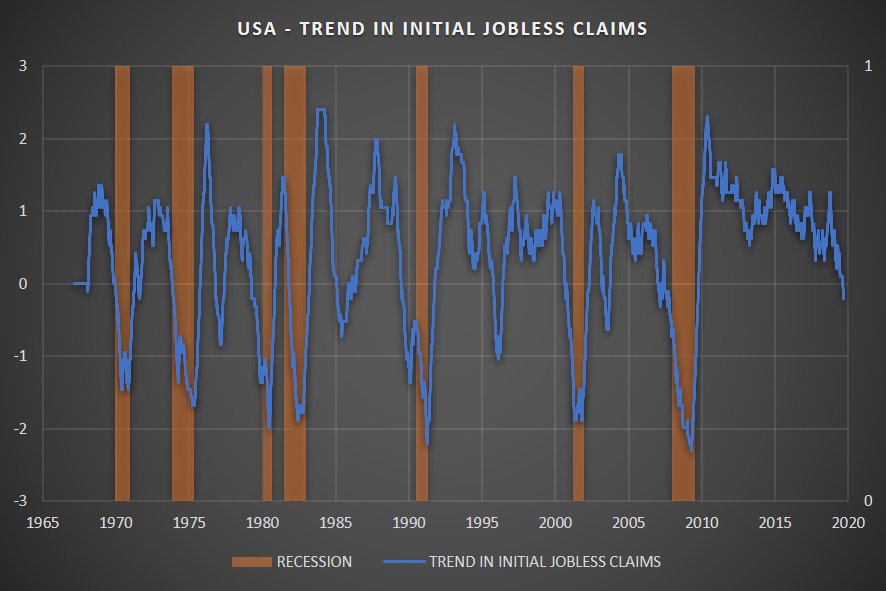
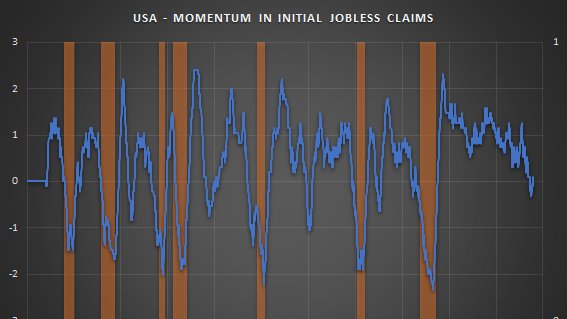
#USA Despite lower than expected initial claims, my trend indicator remains in negative territory. The labor market keeps slowing.

#USA Labor market dynamic continues to weaken. 1-year trend in initial claims remains negative.

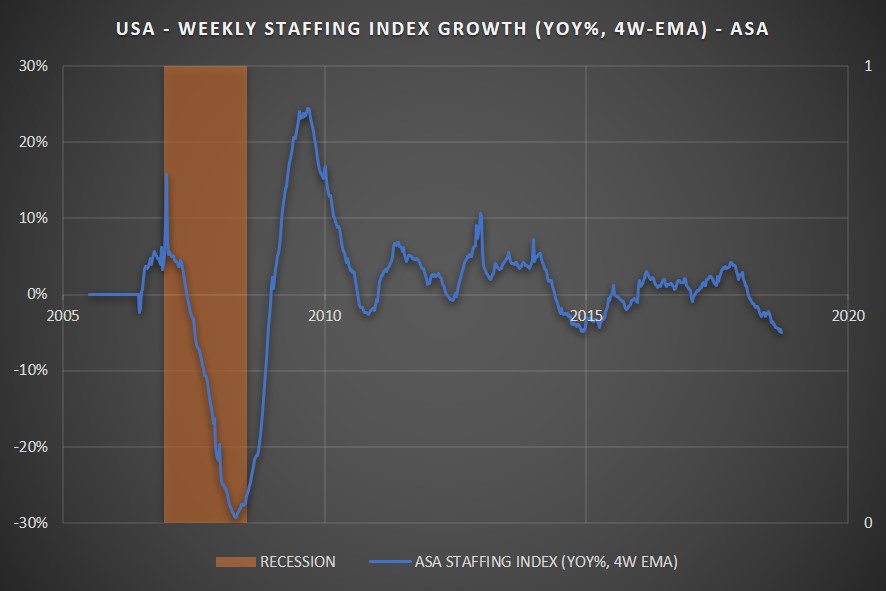
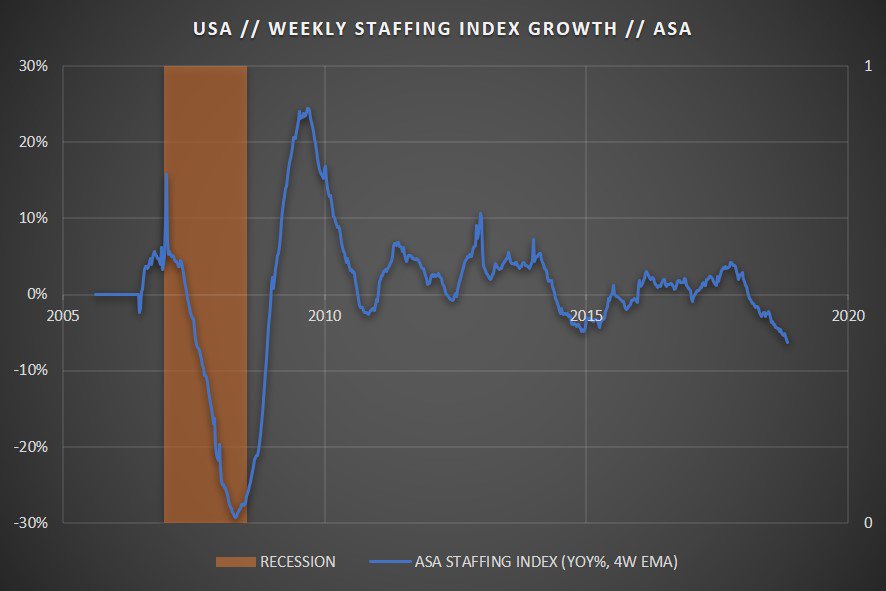
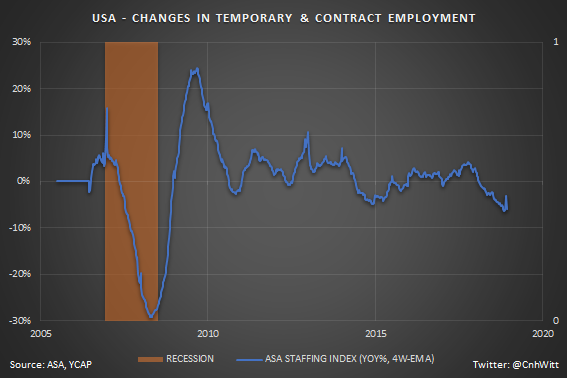
#USA Weekly data published by the American Staffing Association, also indicates that demand from staffing firms for employment has fallen from a year ago.

#USA Job market activity slows further as my indicator of initial jobless claims falls deeper into negative territory.

#USA In addition to initial jobless claims, data from the American Staffing Association indicates that staffing activity is down more than -5% from a year ago. Worse than 2015/16 slowdown.
#USA My job market trend indicator is still negative close to the lowest level since the Great Recession. I expect a modest improvement to neutral over coming weeks though.
#USA Staffing activity has fallen by -4.9% yoy, data from the American Staffing Association shows. This is close to the lowest level since the Great Depression.
CC @StaffingData
CC @StaffingData
@StaffingData #USA The ACC Chemicals Activity Barometer, an early leading indicator for US manufacturing activity, declined to -0.9% yoy in October. Historically, such a low growth rate has been dangerously close to recession.
CC @AmChemistry @DrTKSwift
CC @AmChemistry @DrTKSwift
@StaffingData @AmChemistry @DrTKSwift #USA Thursday is jobless claims day. And while initial jobless claims look a bit boring, I would like to point out that momentum has come to a halt...
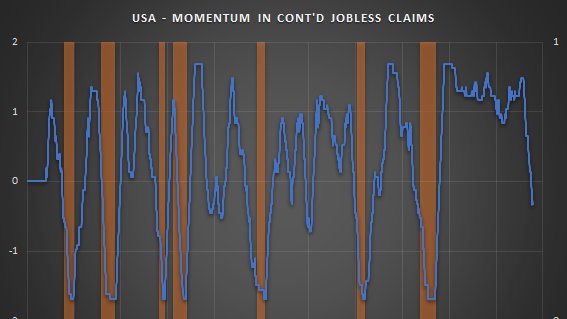
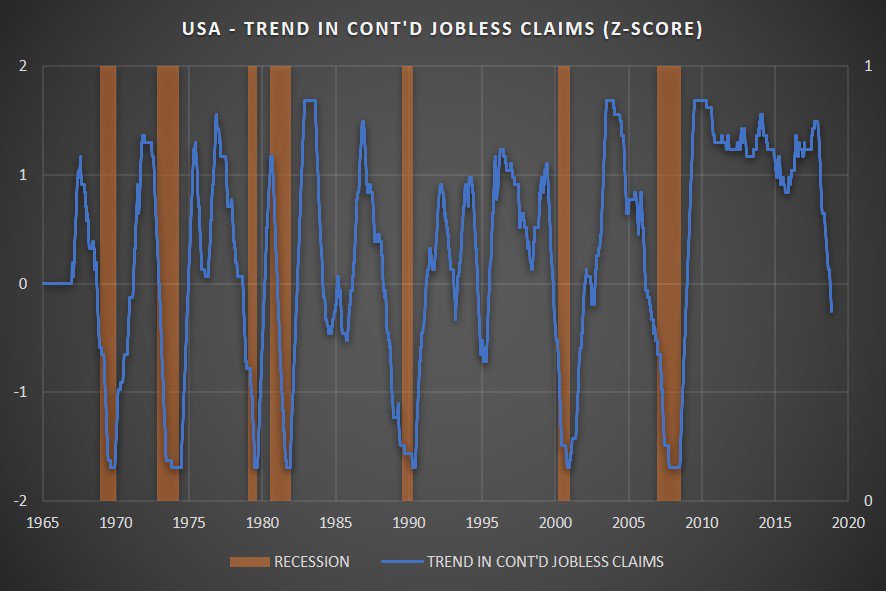
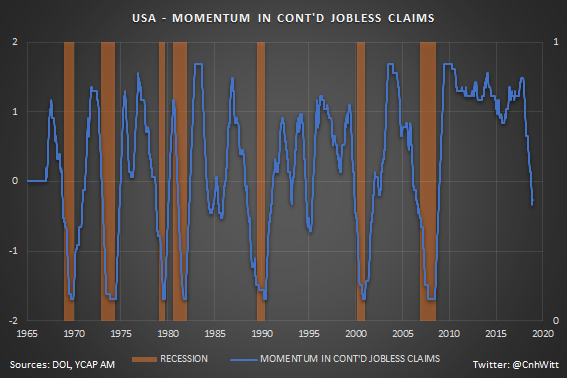
#USA ...while momentum in continued jobless claims is in negative territory and keeps deteriorating.
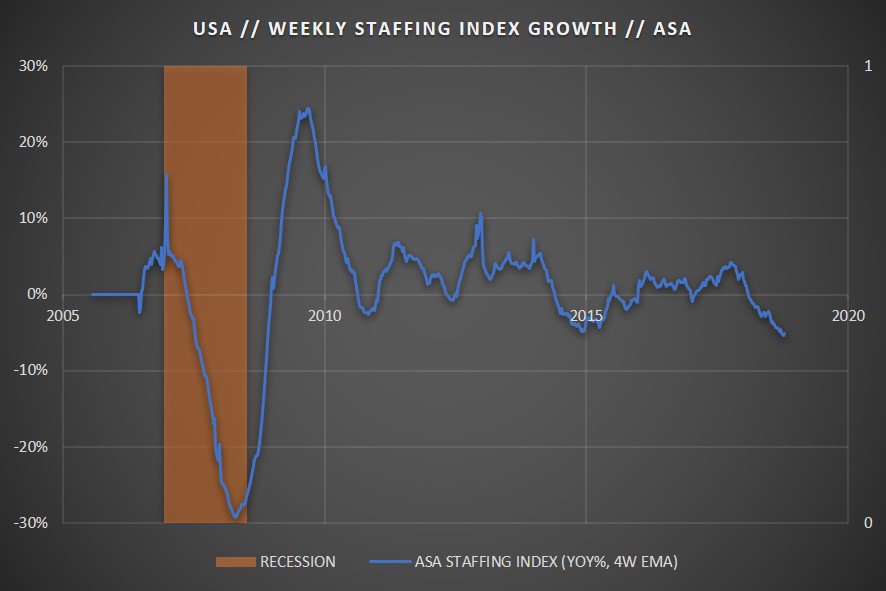
#USA Staffing data shows that temporary labor is in short demand. Worst reading since the recovery after the Great Recession.
cc @StaffingData
cc @StaffingData

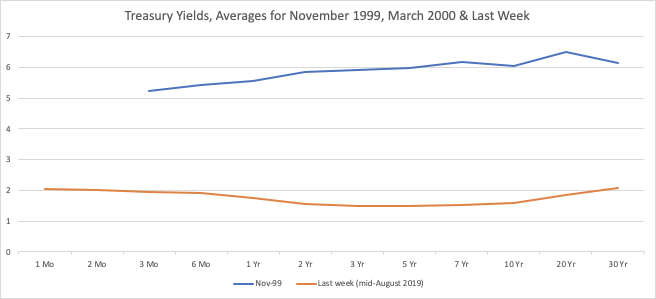
@StaffingData #USA The recent steepening of the *treasury* and *swap* curves strongly resembles early recession behavior. We'll know in a year from now.
@StaffingData #USA Temporary workers continue to be in short demand. The ASA Staffing Index keeps falling; now the lowest since the recovery in 2009/10. A sign of labor market weakness.
cc @StaffingData
cc @StaffingData
@StaffingData #USA Initial jobless claims (227k) failed to rebound from last week's very disappointing print. Momentum remains stuck in slightly negative territory.
#USA Continued jobless claims look to have bottomed. Accordingly, momentum has markedly fallen; now at the lowest since the Great Recession.

#USA Demand for temporary work and contract employment had another bad week, data from the ASA indicates.
cc @StaffingData
cc @StaffingData

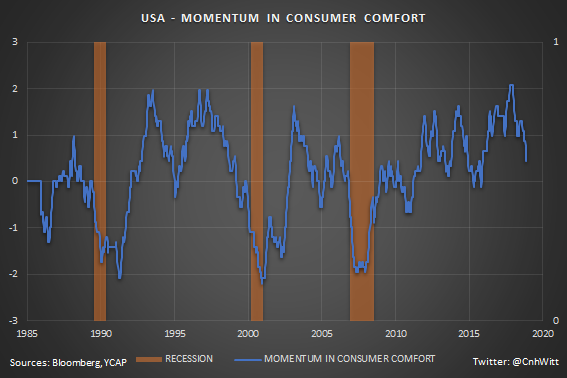
#USA Despite a modest pick-up in Bloomberg's consumer comfort index from a week ago, momentum continued to soften. Air-pocket or trend reversal?
cc @economics
cc @economics
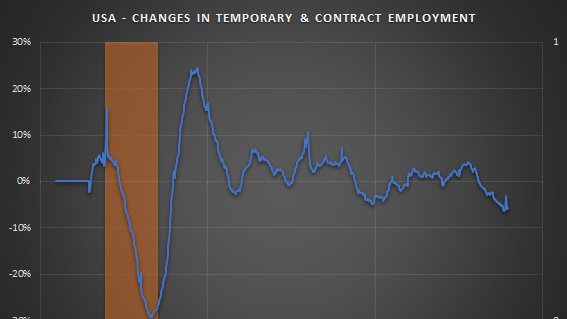
@economics #USA Changes in temporary & contract employment fall by -6.0% yoy (4W-EMA). Still no signs of improvement.
cc @StaffingData
cc @StaffingData

@economics @StaffingData #USA The Chemical Activity Barometer grew by +0.7% yoy. This was the first positive growth rate after three months of consecutive year-on-year declines.
@economics @StaffingData #USA The Conference Board consumer confidence shows growing number of indicators rolling over:
1) Headline consumer confidence 📉
2) Ratio of current situation to expectations 📉
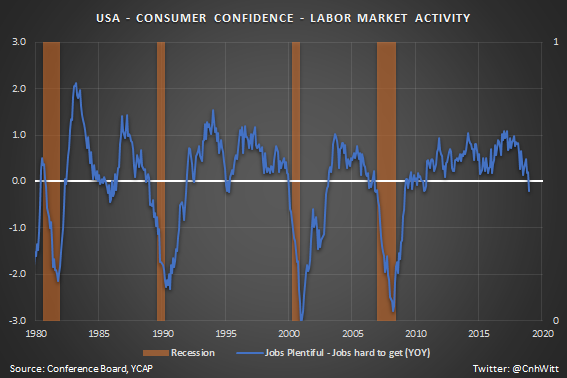
3) Labor market activity fading 📉
1) Headline consumer confidence 📉
2) Ratio of current situation to expectations 📉
3) Labor market activity fading 📉
#USA The Conference Board consumer confidence depicts rapidly fading momentum in labor market activity . Not good. Tomorrow's jobless claims report may provide more color.
#USA Initial claims fell to 213k. Momentum in initial jobless claims improved from modestly negative to neutral.
Initial jobless claims have so far been immune to the weakness in labor market conditions that surveys are showing (e.g. Conference Board consumer confidence, NFIB).
Initial jobless claims have so far been immune to the weakness in labor market conditions that surveys are showing (e.g. Conference Board consumer confidence, NFIB).
#USA Despite a decline in continued jobless claims (from 1,697k to 1,640k), my momentum indicator remains stuck near cycle-lows.
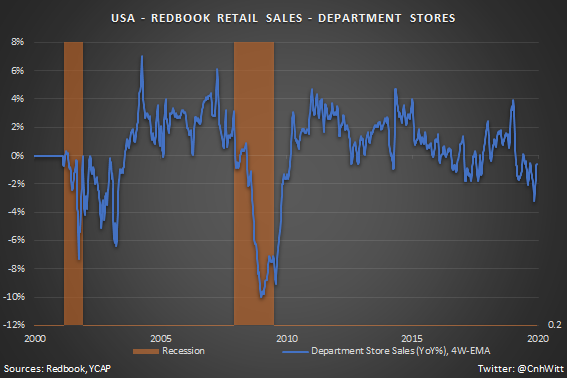
#USA The difference between department store sales and discount store sales indicates that consumers are under increasing pressure to making ends meet.

#USA Temporary and contract employment strongly improves this week week (-3.1% yoy; last -6.1% yoy). A first truly positive sign after months of continued slowing. Hope this is not a seasonal "Thanksgiving" one-off. Time will tell.
cc @StaffingData
cc @StaffingData

@StaffingData #USA Temporary and contract employment strongly declines in the wake of Thanksgiving (-5.9% yoy; last -3.1% yoy). Looks like last week's rebound was a mere seasonal blip. The downtrend continues.
cc @StaffingData
cc @StaffingData
@StaffingData 🇺🇸 #USA Redbook retail sales depict gradually deteriorating consumer health. Growth in retail sales (+5.3% yoy) is entirely driven by discount store sales (+8.5% yoy), while department store sales decline (-0.6% yoy).
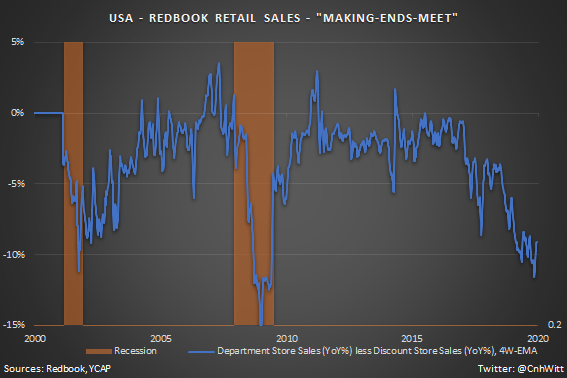
🇺🇸 #USA Redbook department store sales continue to decline from a year ago (-0.6% yoy). Department store sales tend to be a decent indicator of cyclical consumption pattern. Ugly picture.
🇺🇸 #USA Ugly jobless claims report today. Initial claims soared to a 2-year high (252k). My initial jobless claims momentum indicator fell back to neutral; the first decline in 8 weeks.
🇺🇸 #USA The momentum in continued jobless claims slightly improved, acc to my indicator. But it clearly remains in negative territory.

🇺🇸 #USA Temporary and contract employment declined by -5.7% yoy. This is in line with the continued downtrend that started off back in February 2019.
🇺🇸 #USA Initial jobless claims (234k) fell by -18k this week. However, jobless claims improved less than anticipated (225k) and remain well above the 4-week average (225.5k). Accordingly, my momentum indicator fell back into negative territory.
🇺🇸 #USA Continued jobless claims (1,722k act vs 1,676 exp, last: 1,671k) deteriorated further. My momentum indicator has now reached a level that is consistent with a recession (against 3 false alerts in 1985-1987, 1992, 1994). This is something to keep a close eye on.