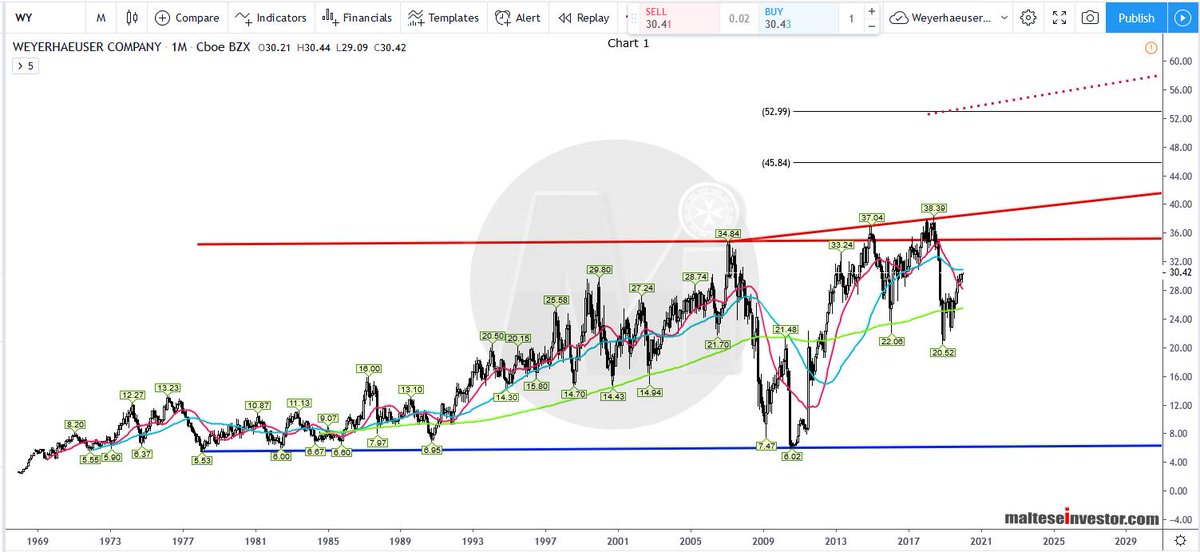
Chart 1
Monthly Chart: Synthetic #trendline pivots have been calculated over various peaks and troughs. A trendline and trendline #pivot mark the upper #resistance boundaries. Trendline #supports have also been added.
3/12
Monthly Chart: Synthetic #trendline pivots have been calculated over various peaks and troughs. A trendline and trendline #pivot mark the upper #resistance boundaries. Trendline #supports have also been added.
3/12
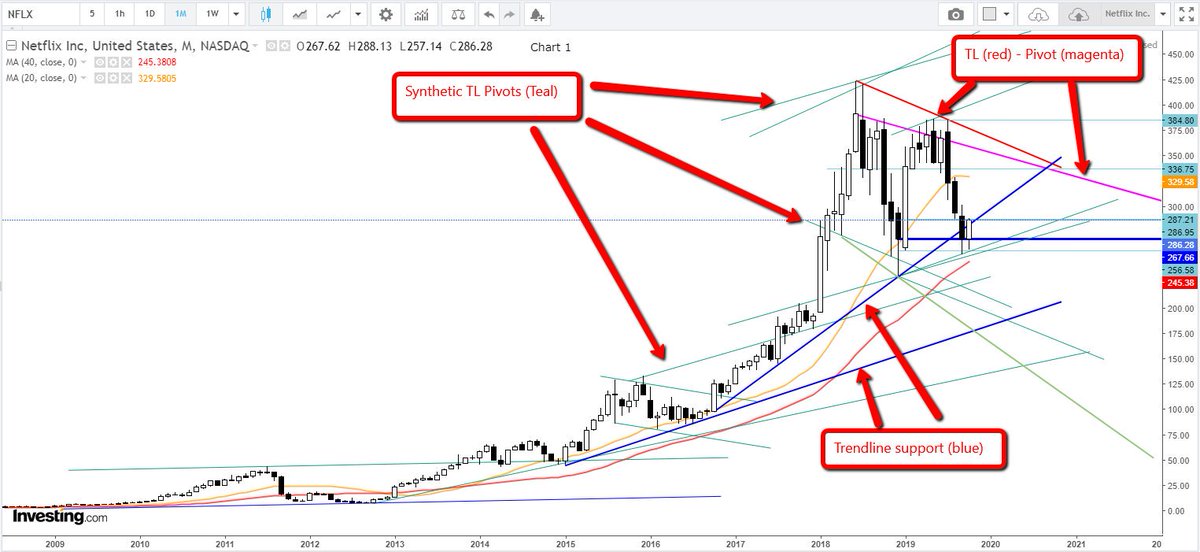
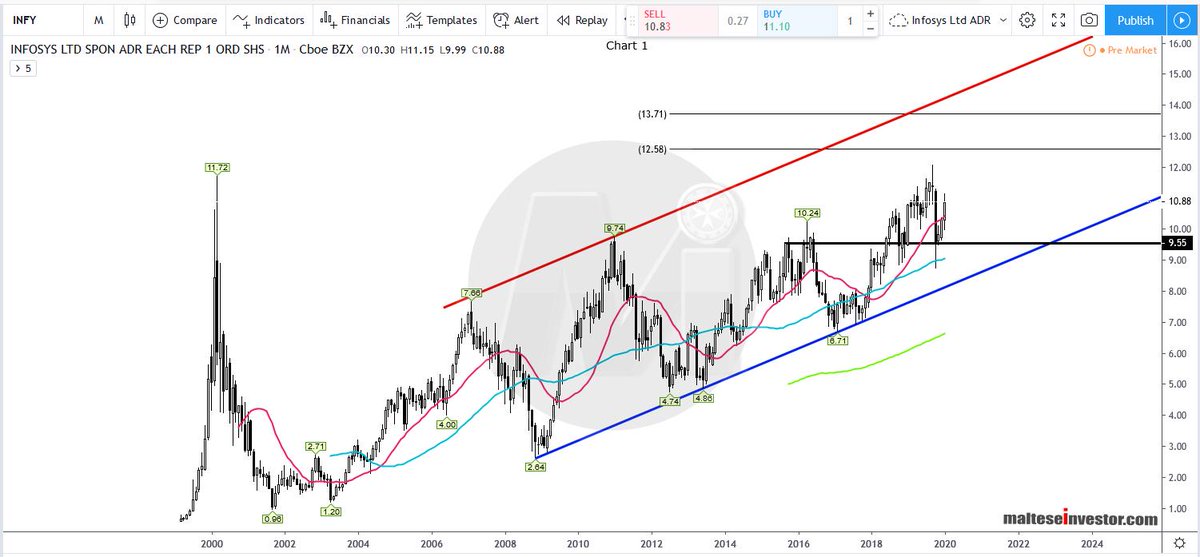
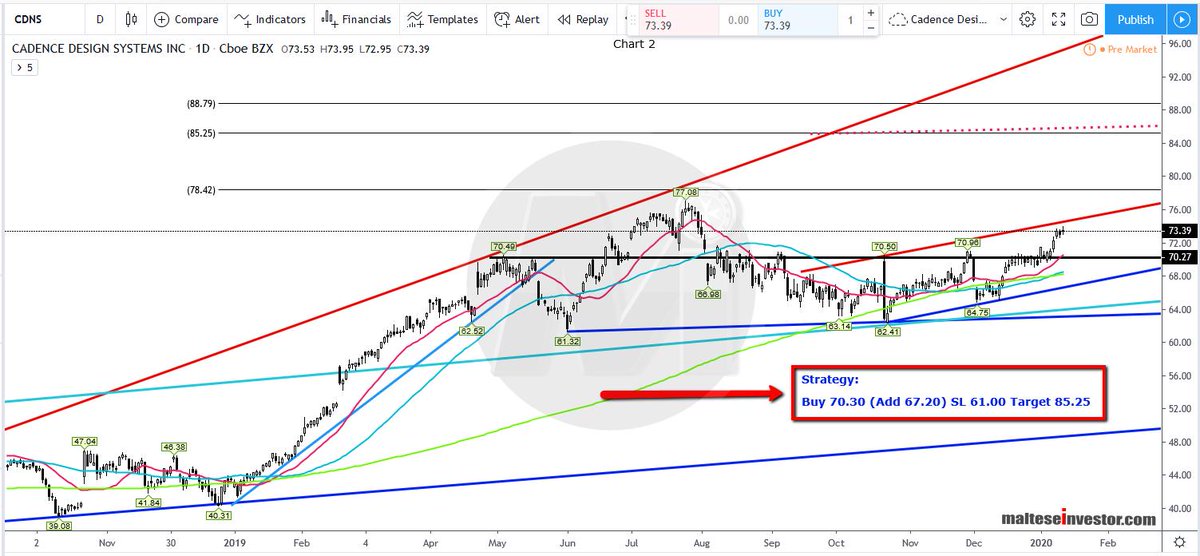
Chart 2
Monthly Chart: Fibs have been added from trendline support to the all time high @ $423.31. The 20 & 40 #SMAs have been added. Important observations: Price closed strongly below the 20 SMA in July 2019 and in August sellers took advantage. ....
4/12
Monthly Chart: Fibs have been added from trendline support to the all time high @ $423.31. The 20 & 40 #SMAs have been added. Important observations: Price closed strongly below the 20 SMA in July 2019 and in August sellers took advantage. ....
4/12
.... The last time this happened was back in September 2011. Price closed strongly below the 2 month bullish trendline. The market correction took it to slightly below the Fib 0.50%
5/12
5/12

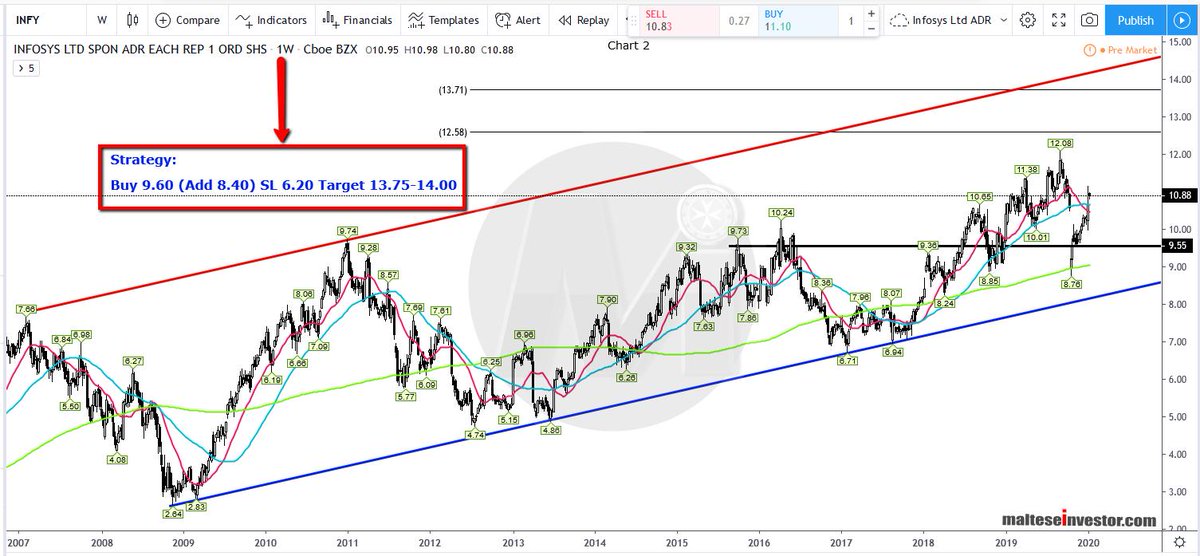
Chart 3
Weekly Chart: Price stalling at the Fib 0.50%. The SMA 40 has been removed and replaced by the 100 SMA. Multiple closes below the 100 SMA and the 20 SMA beginning to add to the bearishness.
6/12
Weekly Chart: Price stalling at the Fib 0.50%. The SMA 40 has been removed and replaced by the 100 SMA. Multiple closes below the 100 SMA and the 20 SMA beginning to add to the bearishness.
6/12

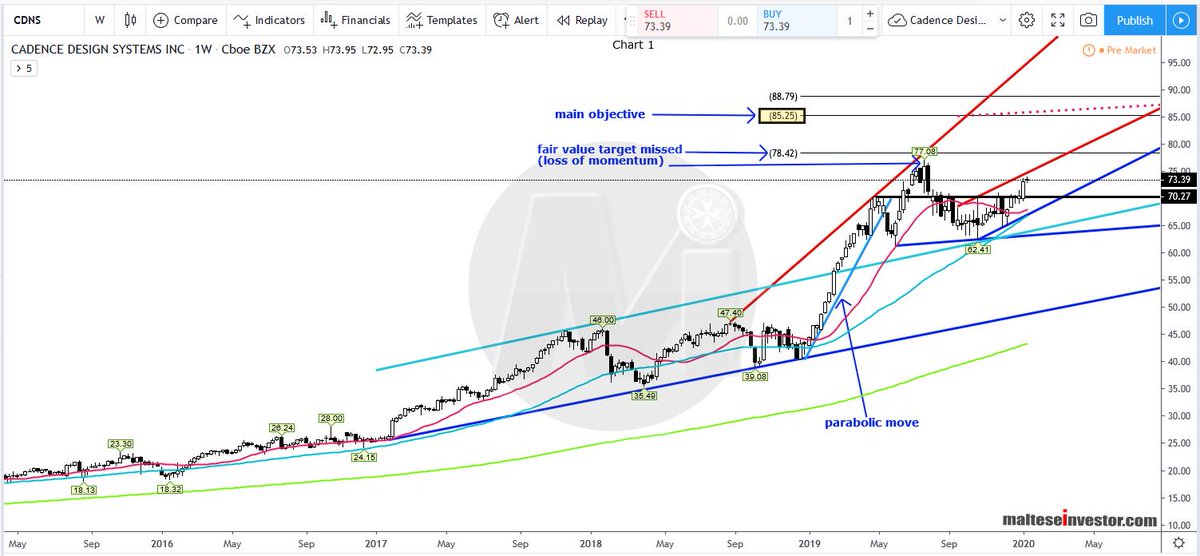
Chart 4
Weekly Chart: Fibs have been added on the last meaningful swing low. Immediate resistances lie between the 0.382% and 0.50% and both SMAs are right between the levels.
7/12
Weekly Chart: Fibs have been added on the last meaningful swing low. Immediate resistances lie between the 0.382% and 0.50% and both SMAs are right between the levels.
7/12

Chart 5
Weekly Chart: Pivot resistances are visible but before that there are many levels of resistance, especially at the synthetic trendline pivots located between $453.00-464.00. ....
8/12
Weekly Chart: Pivot resistances are visible but before that there are many levels of resistance, especially at the synthetic trendline pivots located between $453.00-464.00. ....
8/12
.... A lot of work is required to see new all time highs. Trendline supports are also visible. The broken TL is being reclaimed as price closes back above.
9/12
9/12

Chart 6
Daily Chart: Looking at the daily chart there are 2 gaps which have never been filled.
10/12
Daily Chart: Looking at the daily chart there are 2 gaps which have never been filled.
10/12


Chart 8
Weekly Chart: The strategy ----> see chart
12/12
Weekly Chart: The strategy ----> see chart
12/12