#inflation #bonds $TLT
Charts from last night Australian time. Not updated for most recent ISM number.
1/
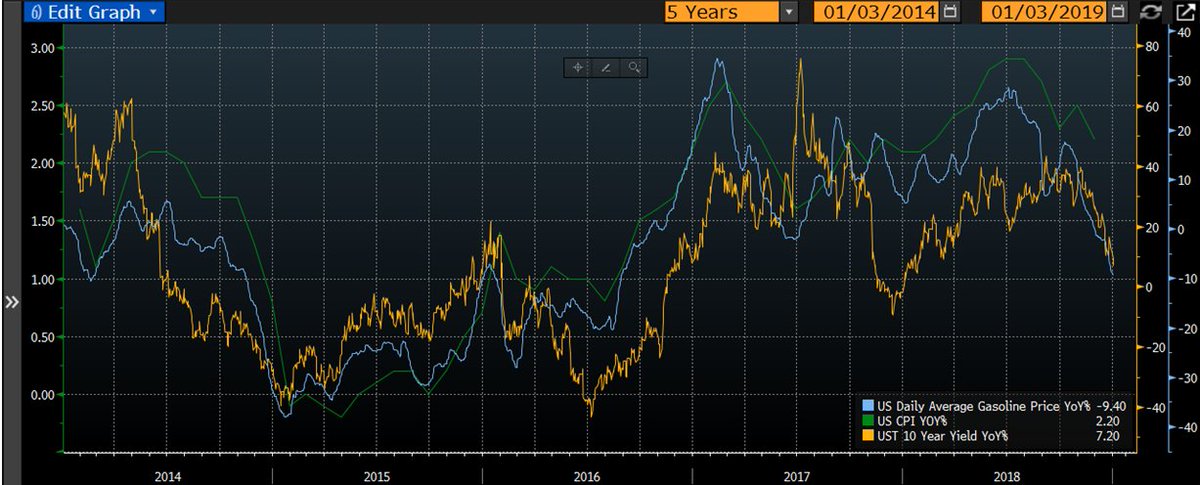
YoY% for average gasoline prices falling with the US 10 year yield YoY% and CPI YoY% following.
Charts from last night Australian time. Not updated for most recent ISM number.
1/
YoY% for average gasoline prices falling with the US 10 year yield YoY% and CPI YoY% following.
#USA #growthslowing
2/
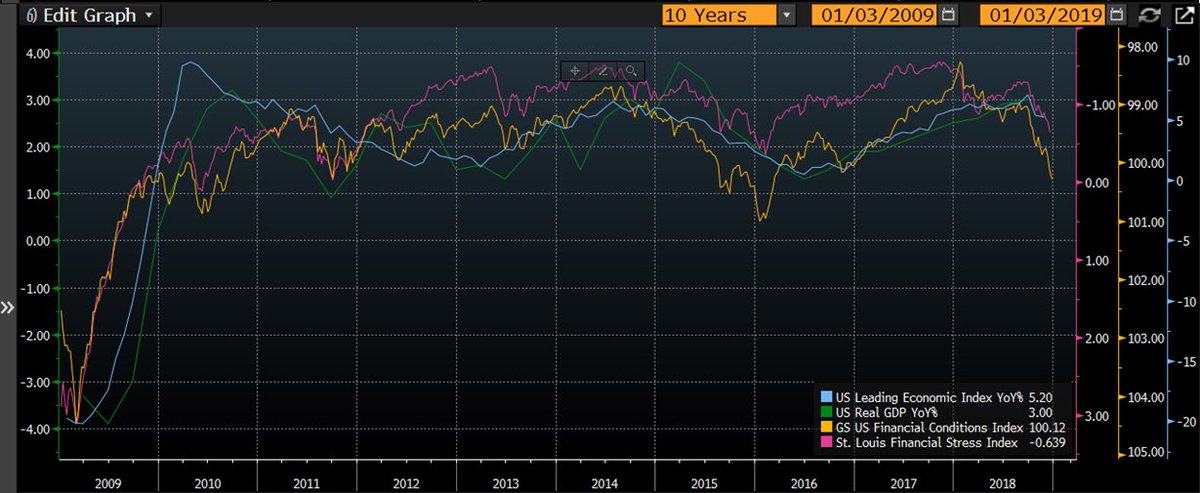
US leading economic index YoY%, GS US financial conditions, and the St. @stlouisfed financial stress index all pointing to lower real gdp numbers for the US economy.
2/
US leading economic index YoY%, GS US financial conditions, and the St. @stlouisfed financial stress index all pointing to lower real gdp numbers for the US economy.
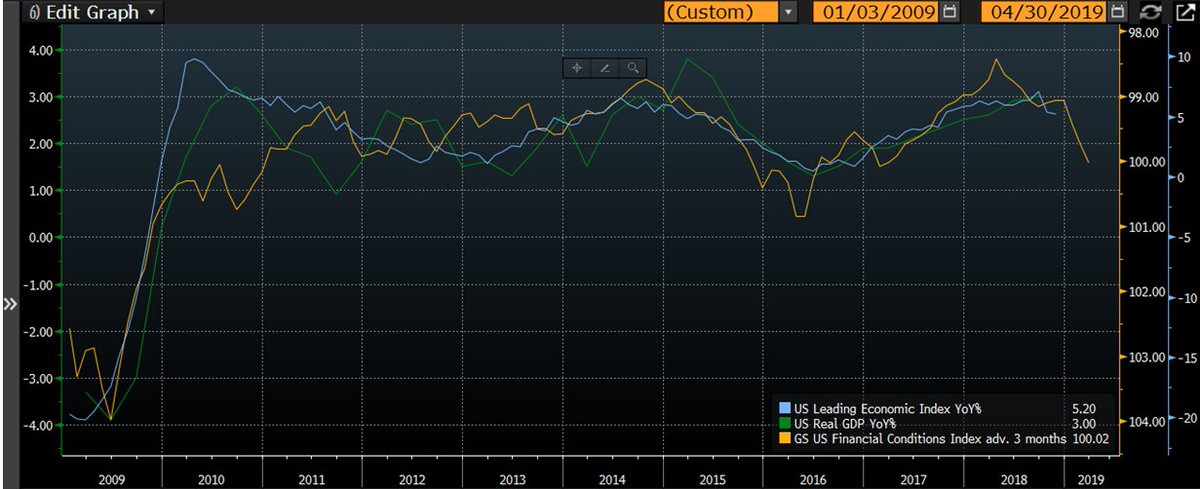
#USA #growthslowing
3/
If we advance GS financial conditions forward by 3 months it is likely that real GDP growth and leading economic indicators continue to track lower.
3/
If we advance GS financial conditions forward by 3 months it is likely that real GDP growth and leading economic indicators continue to track lower.
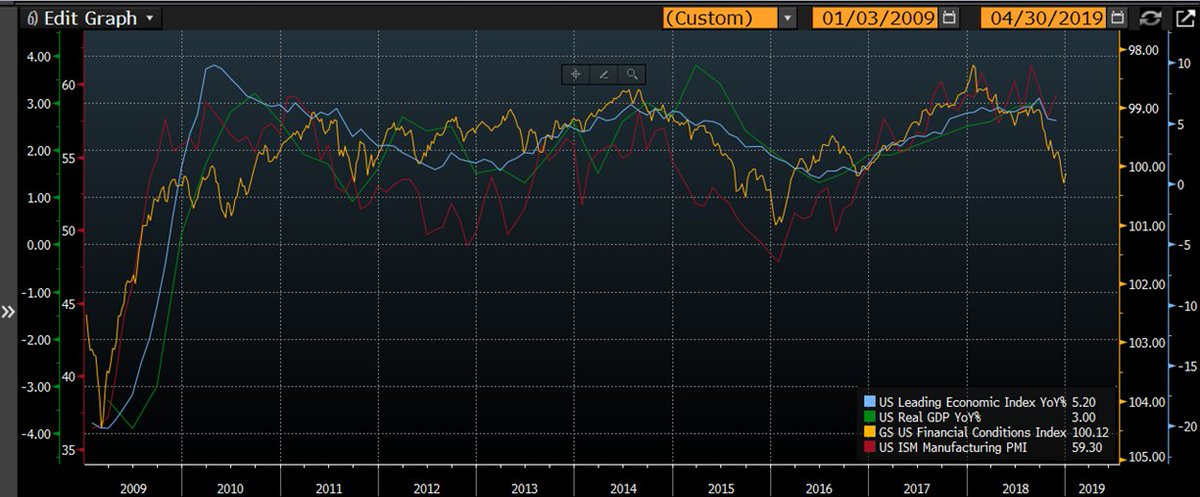
#USA #growthslowing
4/
So the fundamentals are catching up to the market. the ISM printed 54.10 down from 59.30. Consensus is still way too bullish it seems. Watch those forecasts come down.
4/
So the fundamentals are catching up to the market. the ISM printed 54.10 down from 59.30. Consensus is still way too bullish it seems. Watch those forecasts come down.
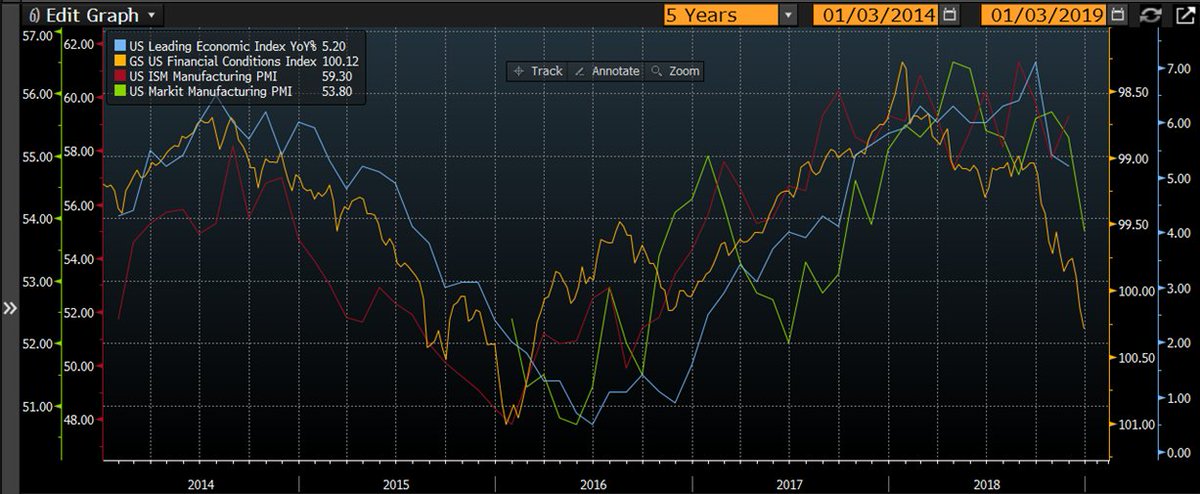
#USA #growthslowing
5/
Looking at a shorter time frame with the @IHSMarkitPMI for the US. ISM PMI & market PMI much closer together now.
5/
Looking at a shorter time frame with the @IHSMarkitPMI for the US. ISM PMI & market PMI much closer together now.
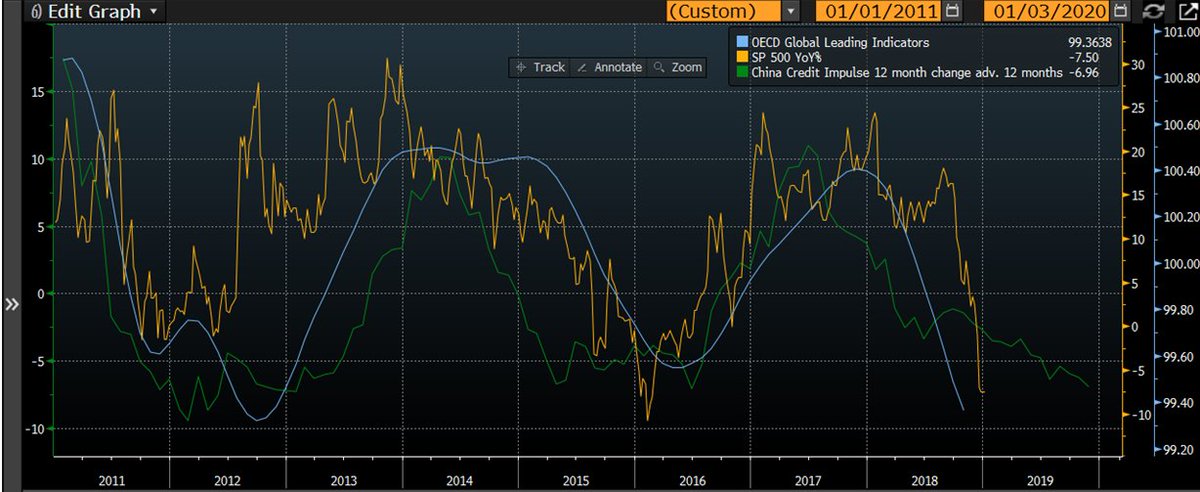
#growthslowing
6/
Looking globally we can see that the OECD Global Leading Indicators have rolled over hard. Previously at these levels we have some form of liquidity injection (QE/China stimulus). 🙃
6/
Looking globally we can see that the OECD Global Leading Indicators have rolled over hard. Previously at these levels we have some form of liquidity injection (QE/China stimulus). 🙃
#growthslowing #liquidity
7/
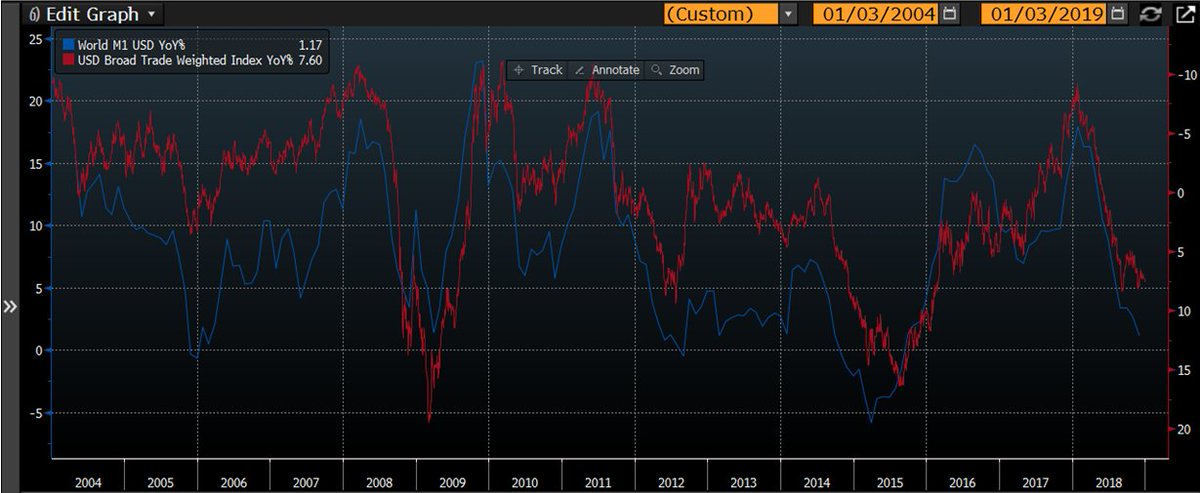
"focus on the movement of liquidity... most people in the market are looking for earnings and conventional measures. It's liquidity that moves markets."
S Druckenmiller
World M1 USD YoY% vs. USD Index Broad Trade Weighted
Still suggesting USD up!
7/
"focus on the movement of liquidity... most people in the market are looking for earnings and conventional measures. It's liquidity that moves markets."
S Druckenmiller
World M1 USD YoY% vs. USD Index Broad Trade Weighted
Still suggesting USD up!
#growthslowing #OOTT #liquidity
8/
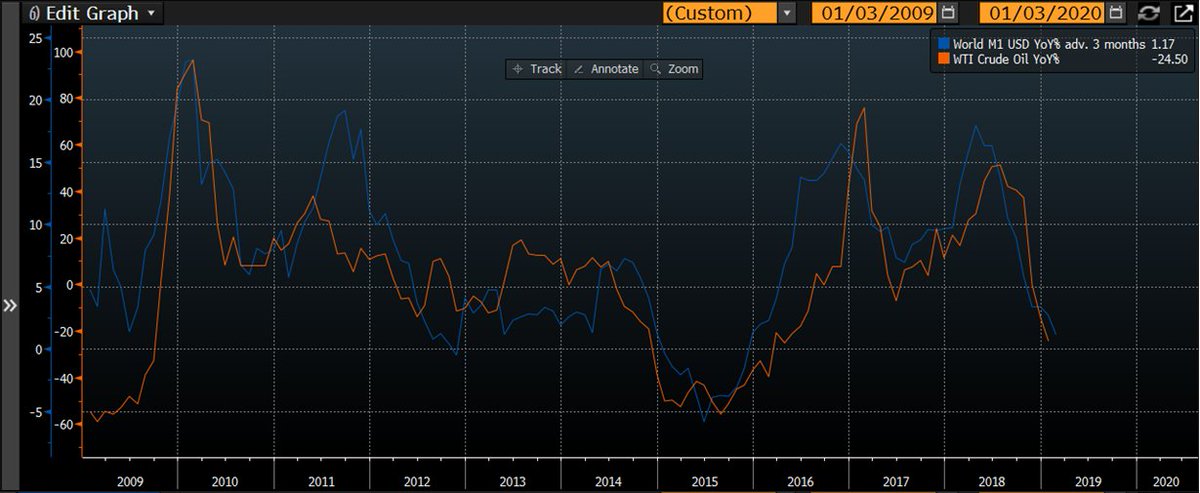
If we advance global M1 forward by 3 months we can see a close correlation with the YoY% in the WTI crude oil price.
8/
If we advance global M1 forward by 3 months we can see a close correlation with the YoY% in the WTI crude oil price.
#GrowthSlowing #ChinaSlowing $AUDUSD #Commodities
9/
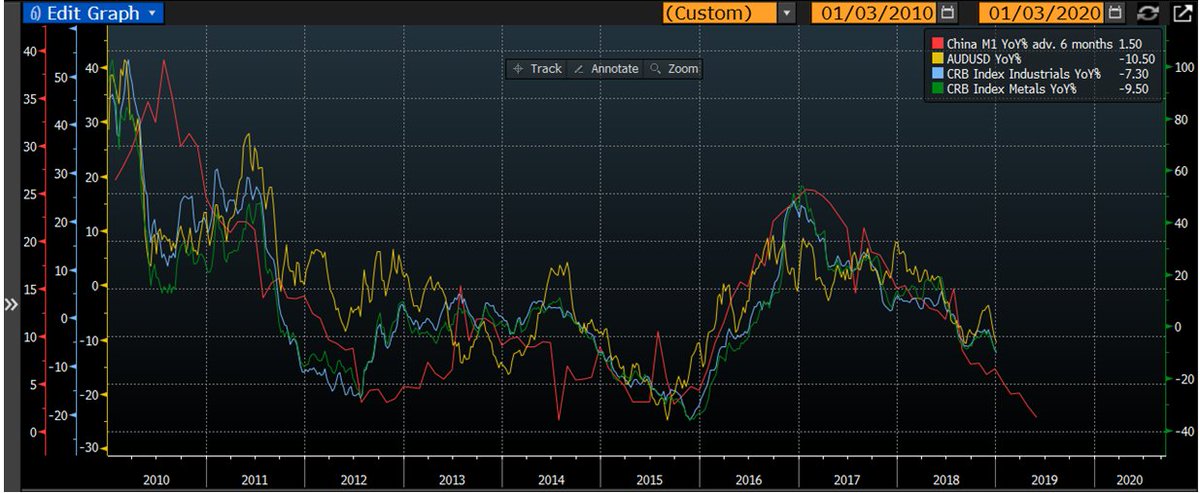
Not seeing much change in the outlook for industrial or metal commodities & therefore the outlook for the Australian Dollar. China M1 YoY% is advanced forward by 6 months. Waiting on December M1 data from China.
End
9/
Not seeing much change in the outlook for industrial or metal commodities & therefore the outlook for the Australian Dollar. China M1 YoY% is advanced forward by 6 months. Waiting on December M1 data from China.
End
#GrowthSlowing #trade
10/
I'm ending this thread! Some more charts as of yesterday.
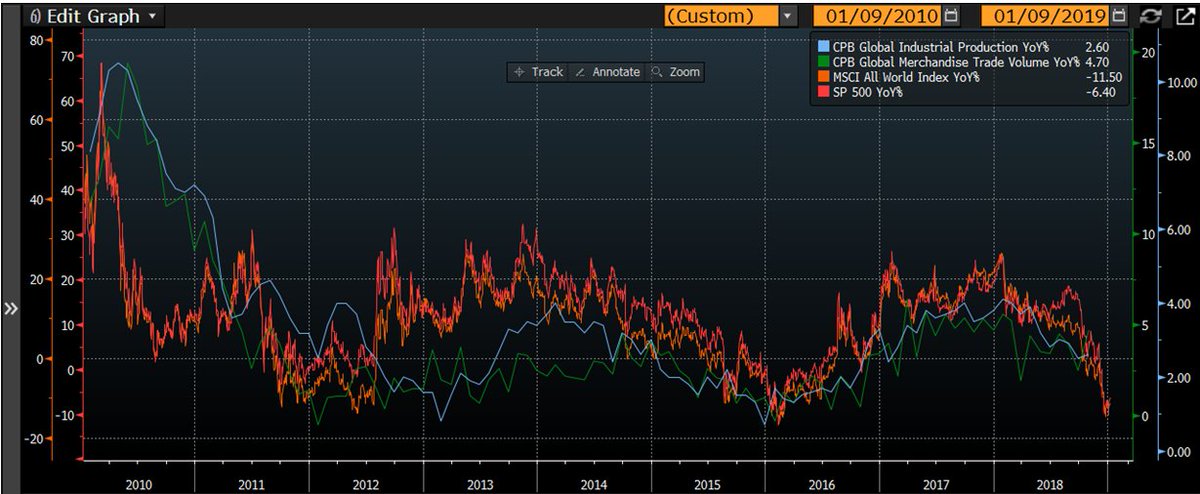
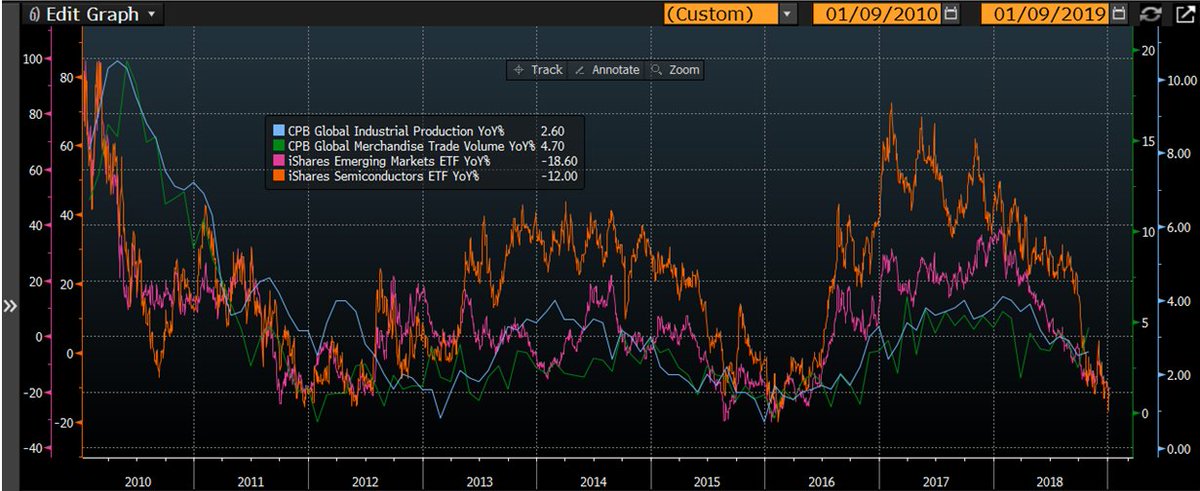
The markets are pricing in a serious slowdown in industrial production and trade. Has been made pretty obvious by recent data releases. See #Germany!
10/
I'm ending this thread! Some more charts as of yesterday.
The markets are pricing in a serious slowdown in industrial production and trade. Has been made pretty obvious by recent data releases. See #Germany!
#GrowthSlowing #trade #EmergingMarkets
11/
Looking at $EEM and $SOXX. Both are just high beta ways to play an acceleration or deceleration in industrial production and trade.
11/
Looking at $EEM and $SOXX. Both are just high beta ways to play an acceleration or deceleration in industrial production and trade.
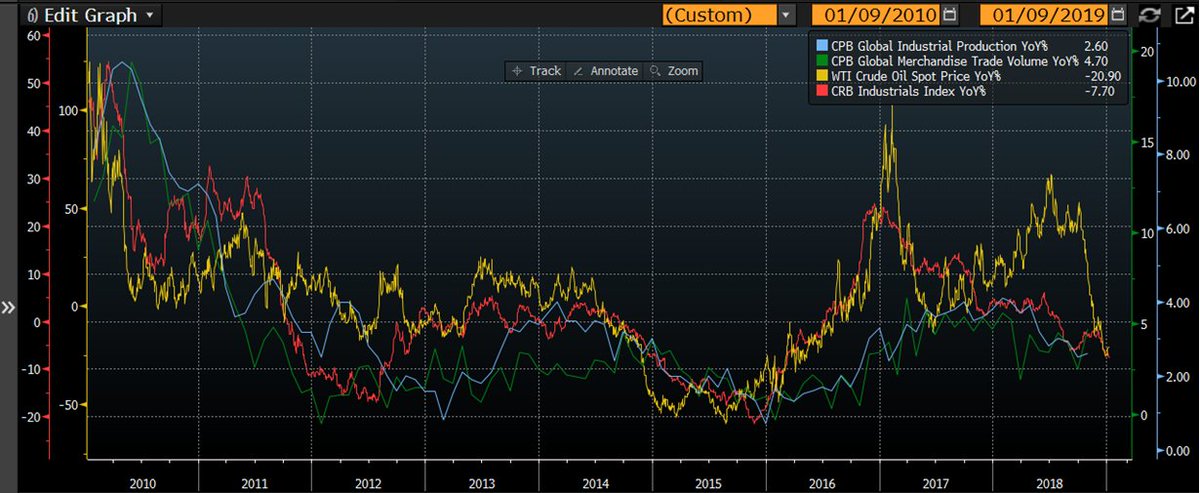
#GrowthSlowing #trade #Commodities
12/
Looking at oil and industrial metals we can see they also lead industrial production and global trade. Note the divergence in oil through 2017 & majority of 2018 then bang has caught down to industrial metals, industrial production & trade.
12/
Looking at oil and industrial metals we can see they also lead industrial production and global trade. Note the divergence in oil through 2017 & majority of 2018 then bang has caught down to industrial metals, industrial production & trade.