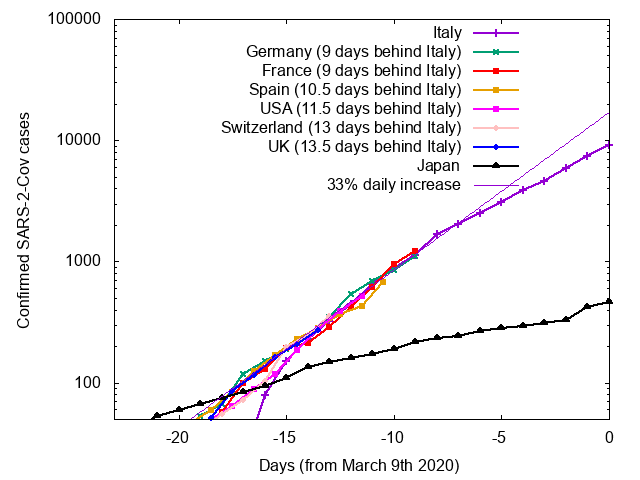
1/ #CoVID_19 Update 12th March. Confirmed cases in European countries still following 9-14 days behind Italy. Italy, France and perhaps Germany have reduced their increase rate to ~22% per day. The rest are still on 30%+ 
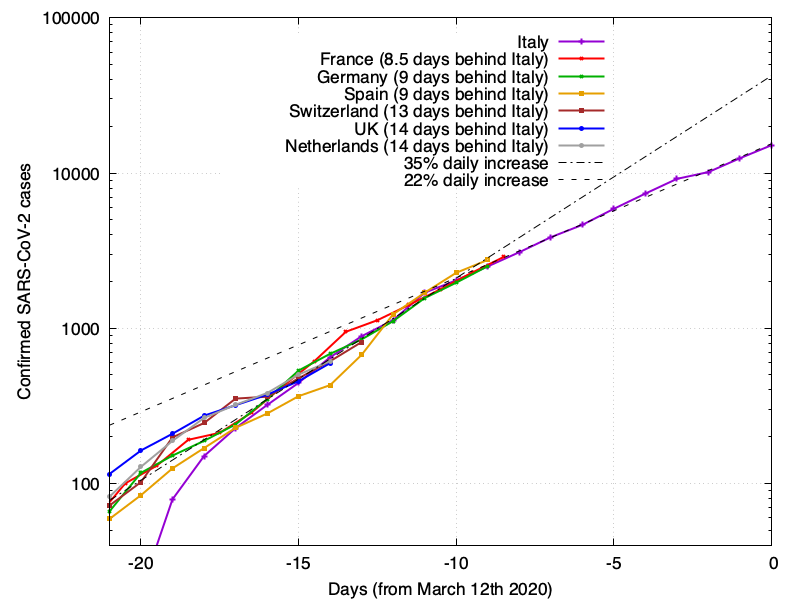
2/ UK dip seems to have finished, and we're back following Italy, but one day further behind now.
3/ Showing cases per million inhabitants rather than raw infection counts moves Switzerland less than a week behind Italy. Doesn't really change anything for the others.

4/ Scandinavia, showing cases per million inhabitants. Denmark managed to import a lot of cases, but reacted fast once the numbers were clear. Will be a week before we see the the effects of that reaction in the stats though.

5/ Iceland seems to be coping with their imported cases pretty well - relatively low increase rate there.
6/ I prefer log scale graphs because you can see the exponential growth rate clearly, but here's a linear graph for those that don't like log-linear graphs.

7/ Elsewhere in the world, there's more variability in response. US still following Italy. Korea coping well. If the data from Iran is correct, the increase rate there has slowed significantly. Japan is still an enigma.

8/ Showing cases per million inhabitants doesn't really change the picture. I've added Singapore to show how well they've coped, but a slight upwards trend in the daily increase rate here.

9/ Would love to know if warm weather has an effect on spreading rate. Warm places are still showing exponential increases, but there's a group that are growing at a lower (14%) rate. Brazil may be an exception, but not really enough data yet to tell.

10/ Many asked about humidity. At the moment only these four warm countries have enough cases to establish a clear trend. It's quite a strong cluster, but far from conclusive. Not enough cases in warm US states to establish a trend their either.
11/ Different countries are no doubt capturing different fractions of the underlying cases. This doesn't change the slope of the logscale graphs, so we can still see the spreading rates. It may change the time offsets by a few days, back or forwards.
12/ The stats lag behind new infections by 6-10 days, so don't wait before the data shows a problem. In 10 days, at 35% per day, infections will increase 20 fold. That's all for tonight!