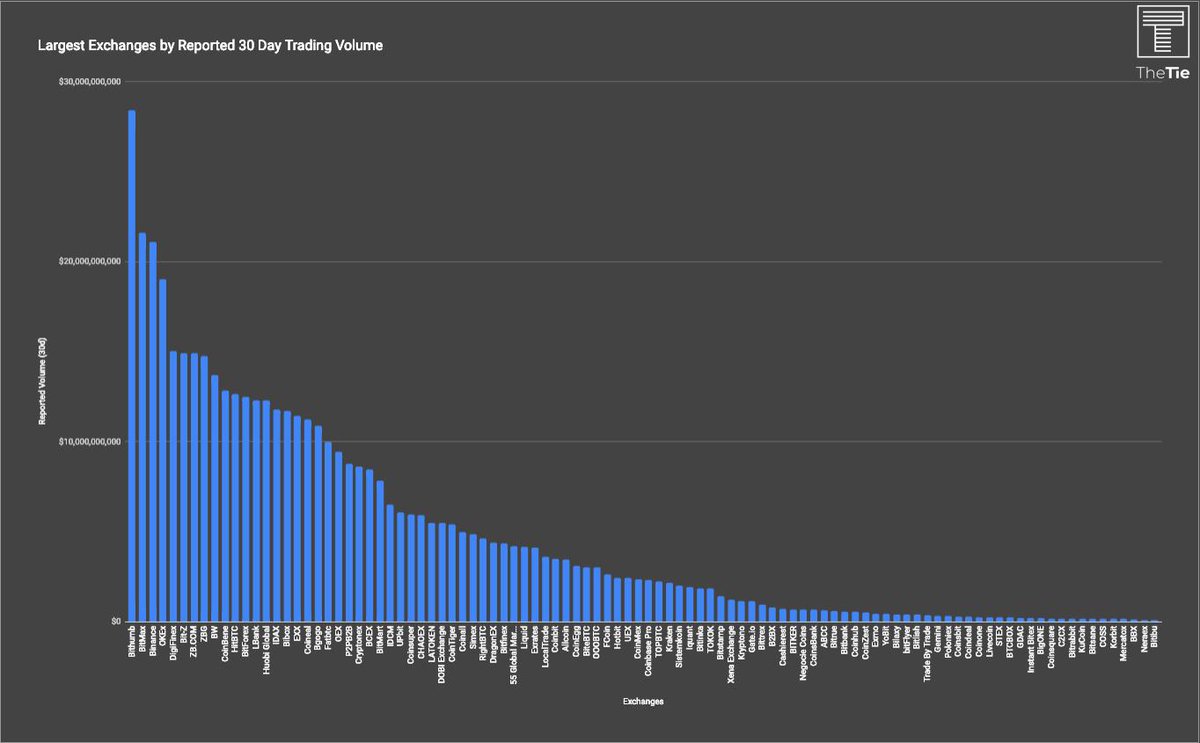
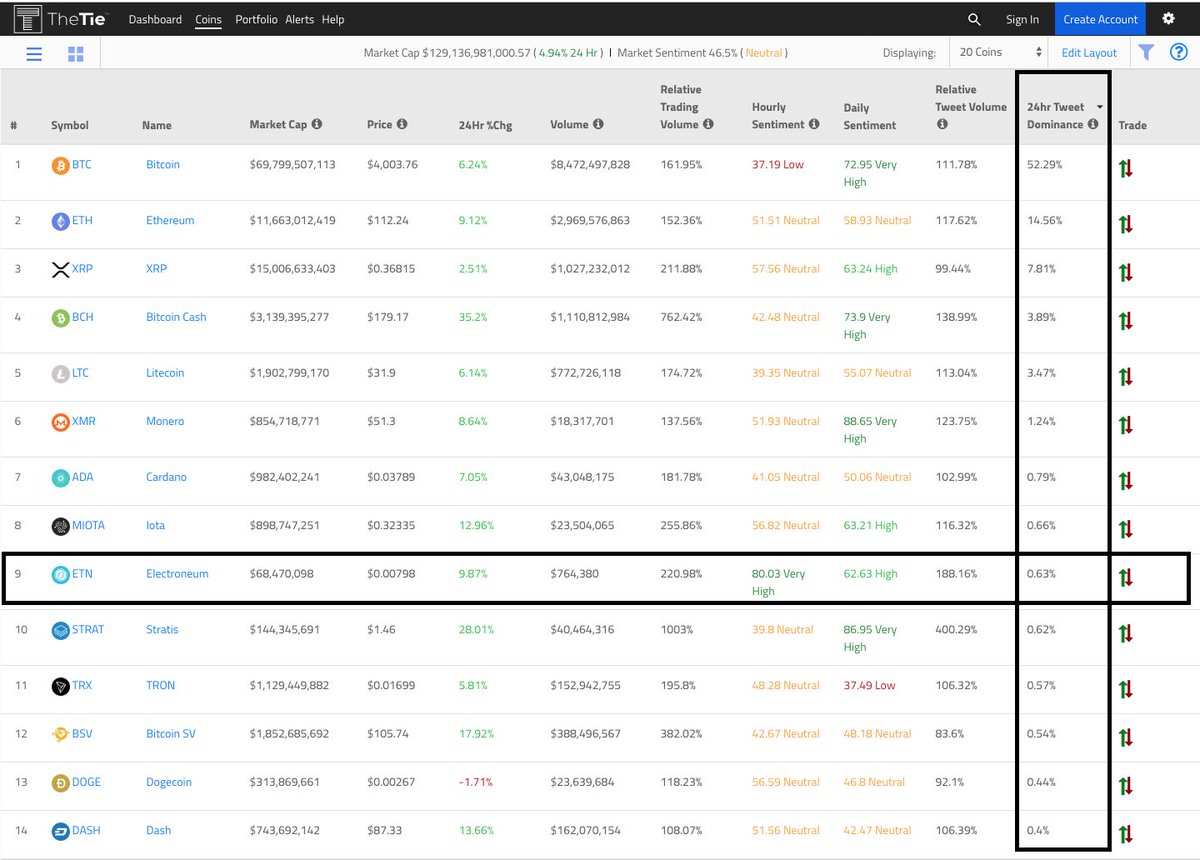
We created a metric called Hype-to-Activity Ratio, which measures the # of tweets each crypto has per $1M in trading volume. Across the 450 cryptos we investigated, there were an average of 1.02 tweets per $1M in volume.
We used 30-day averages for tweet and trading volumes.
Because these coins had low tweet volumes, we looked at any coin that averaged >25 tweets per day.
Tether is a stablecoin highly used in crypto trading, so it makes sense that the coin would have a relatively small number of conversations as compared to its trading volume.
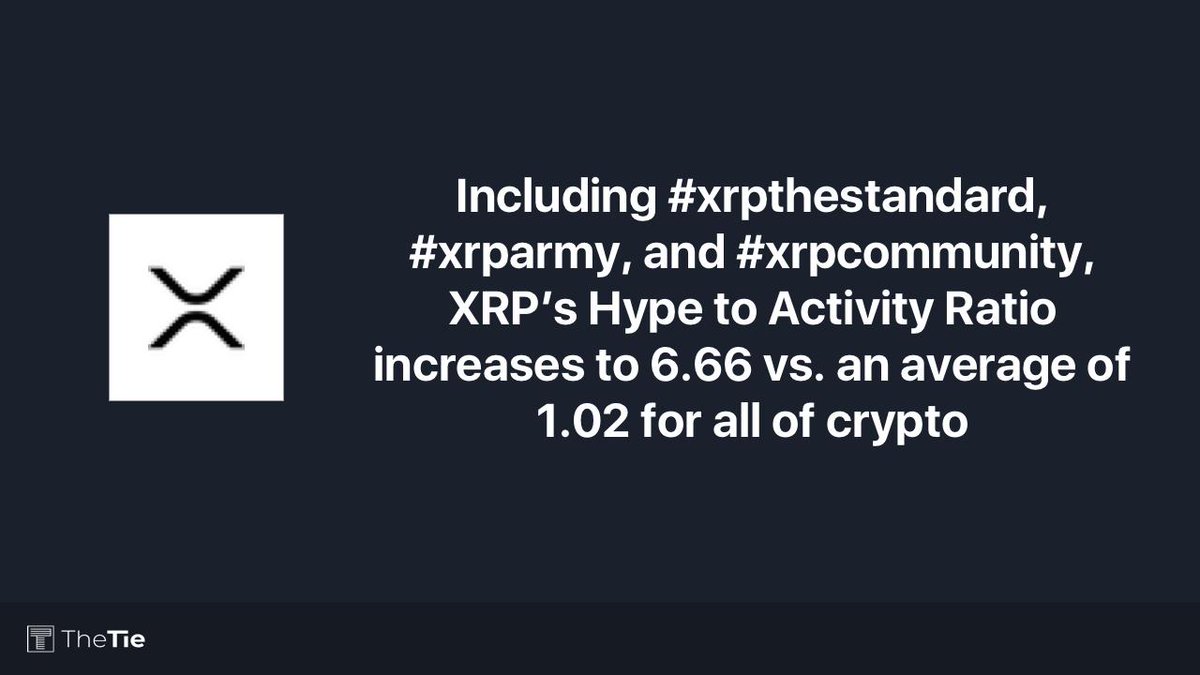
In the previous tweet we ignored the hashtags #XRPCommunity, #XRPTheStandard, and #XRPArmy, but if we include them the hype to activity ratio of XRP spikes to 6.66.
>33% of all XRP tweets use those hashtags and XRP accounts for 6x more tweets/trading than the average coin.
So what does this hype without activity look like?
Just like trading volume manipulation, many of these coins are similarly being manipulated on Twitter by hoards of bot accounts, fake followers, and manipulated engagement.
Frequently cryptos with artificially high levels of conversations on Twitter will also have similarly high numbers of Twitter followers.
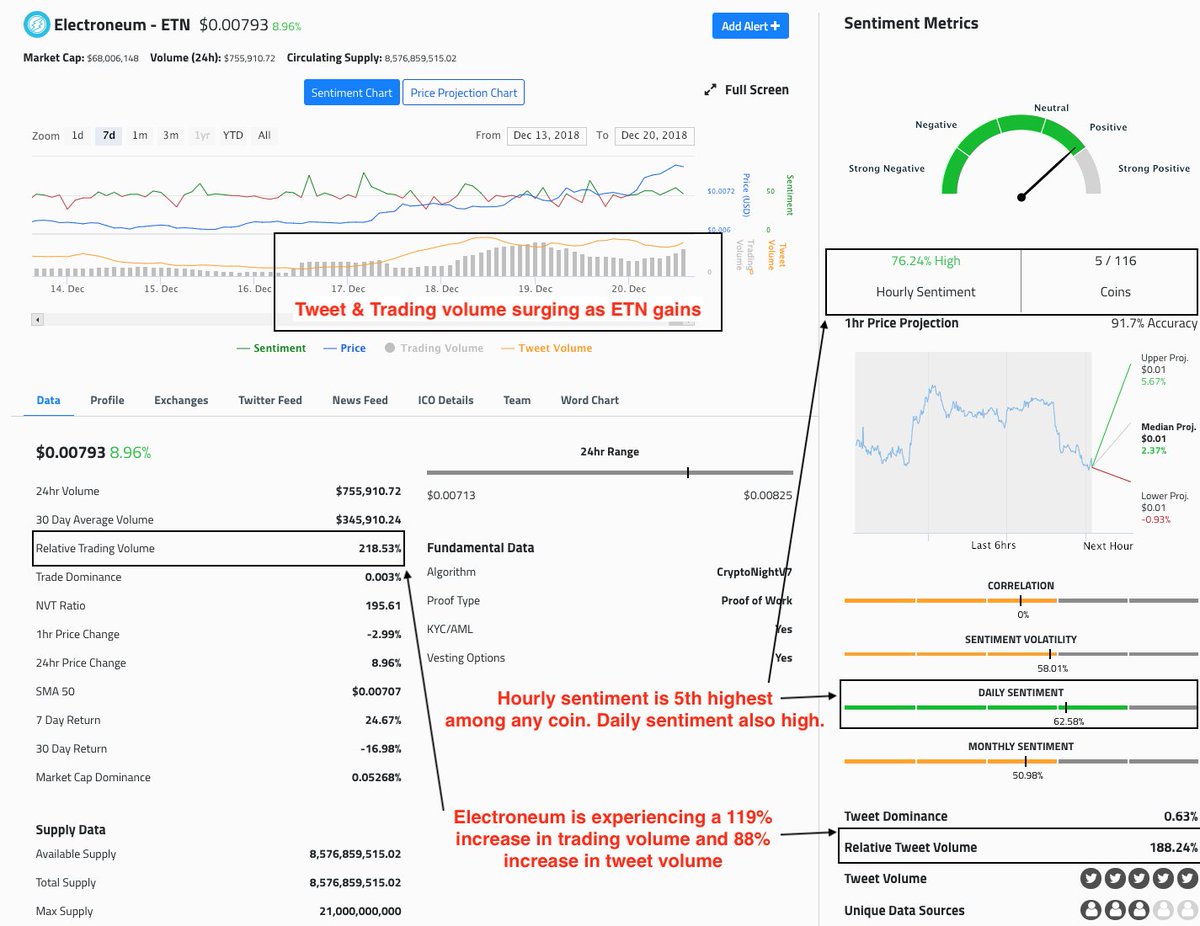
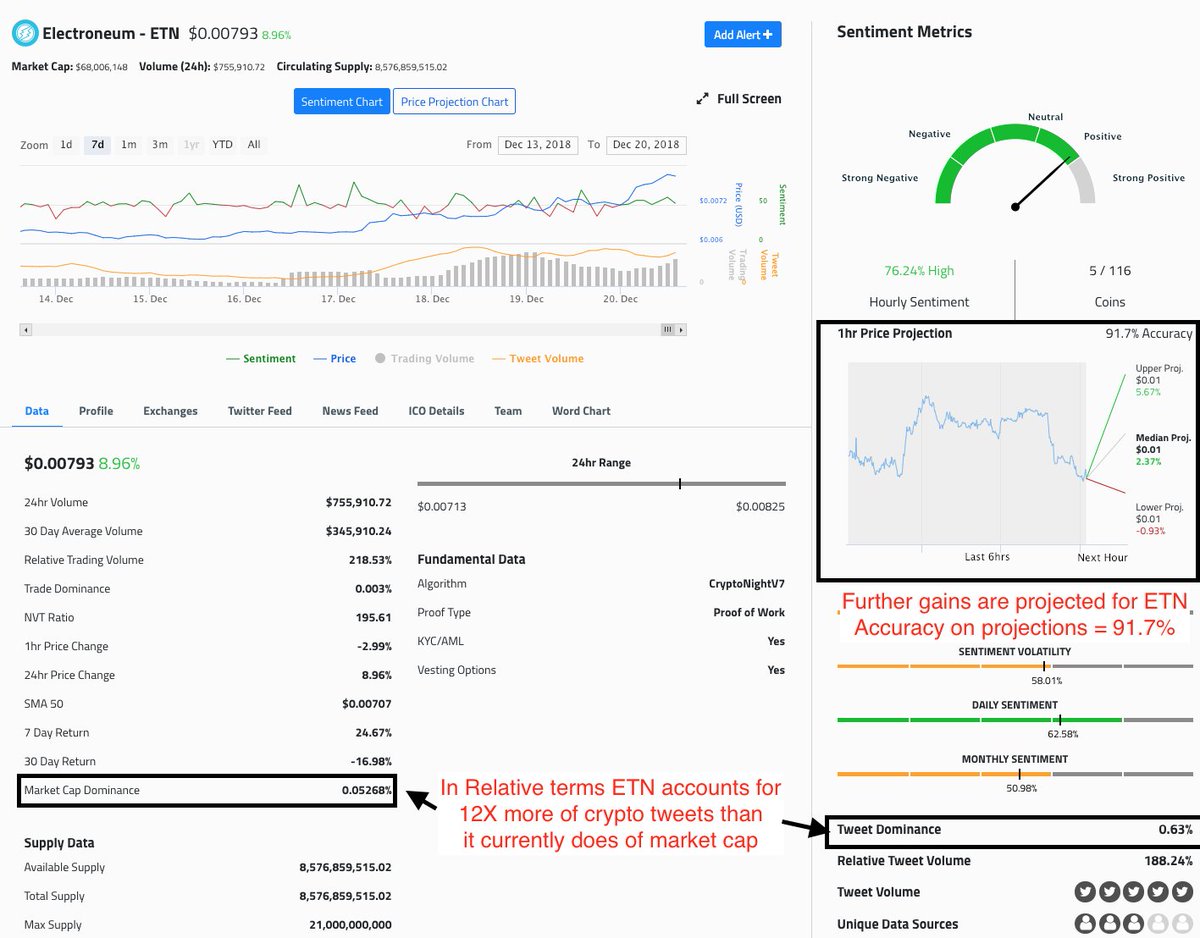
In many cases these cryptos will buy fake followers to try to establish legitimacy. Example, Electroneum 127K vs. BitMEX only 65K.
While significant efforts are being made to improve cryptos legitimacy, the industry remains very much the wild west.
Although many within crypto can easily detect manipulative practices, this deception is aimed at new entrants into crypto who are often less informed.
While this metric is not perfect, we think its a good tool for identifying massive outliers.
As always, we have made the data available for free in a Google Sheet.
Note: Lowest ones have minimum of 25 tweets, highest have minimum of 50 tweets.
docs.google.com/spreadsheets/d…


