THREAD
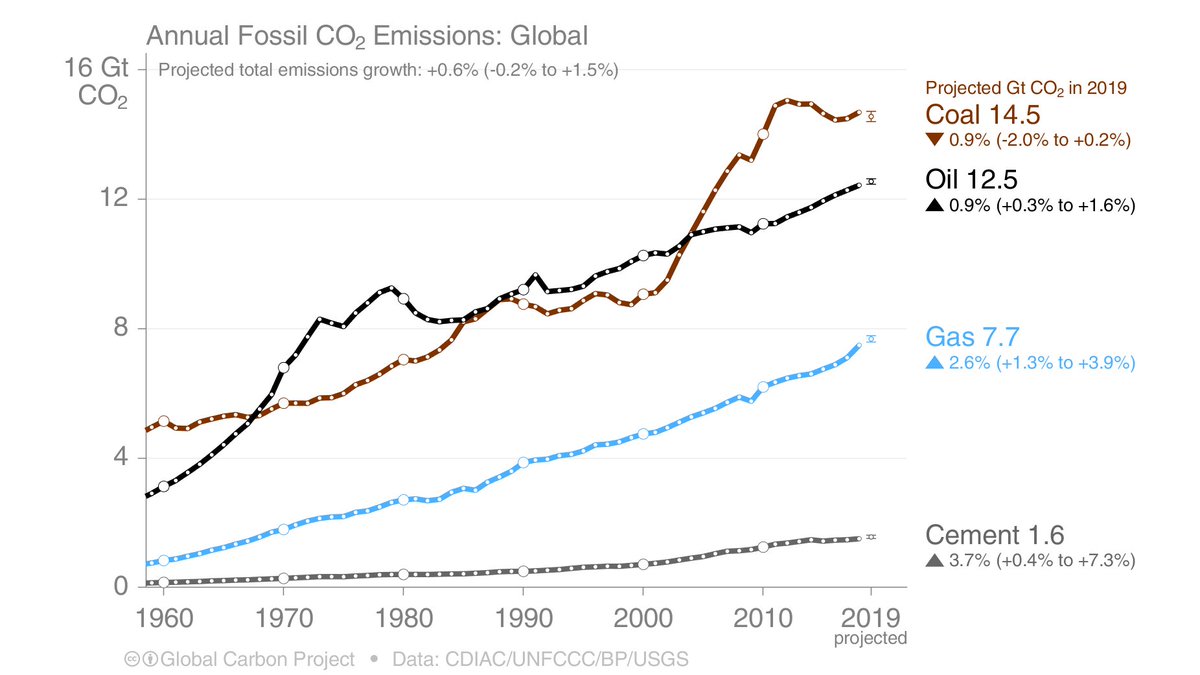
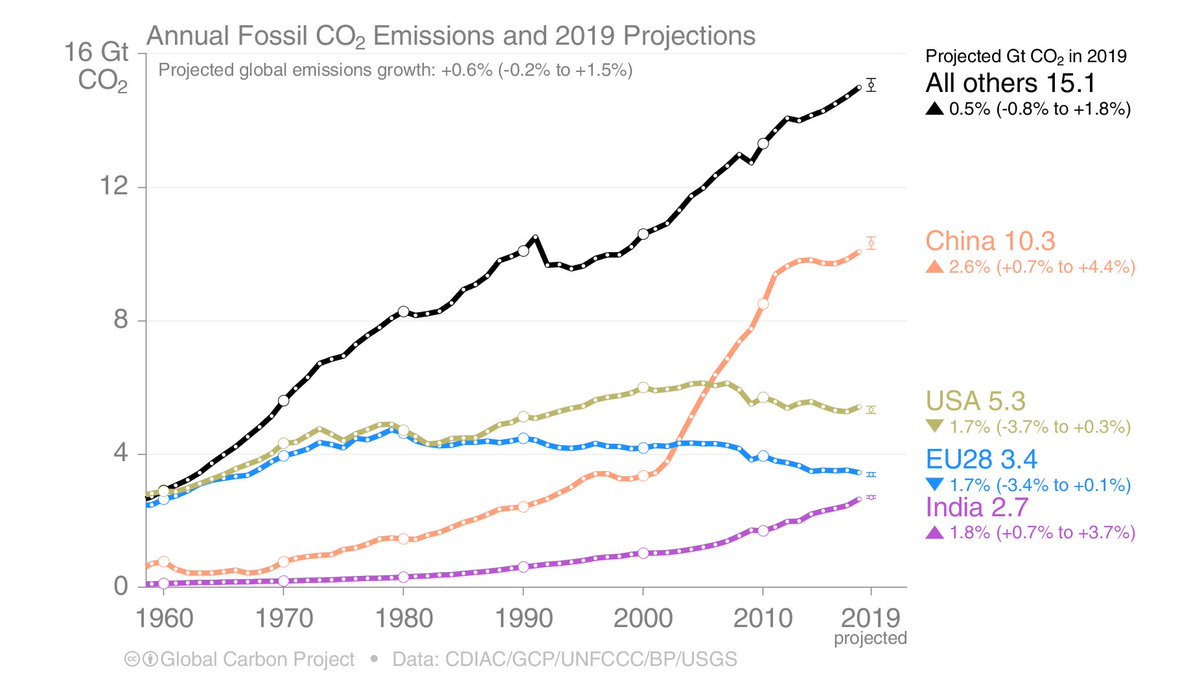
Global fossil CO₂ emissions set to grow a slow 0.6% in 2019 [range: -0.2% to +1.5%] with robust growth in oil & natural gas, but a slight decline in coal.
#CarbonBudget #COP25 #ClimateAction globalcarbonproject.org/carbonbudget/i…
1/
Global fossil CO₂ emissions set to grow a slow 0.6% in 2019 [range: -0.2% to +1.5%] with robust growth in oil & natural gas, but a slight decline in coal.
#CarbonBudget #COP25 #ClimateAction globalcarbonproject.org/carbonbudget/i…
1/
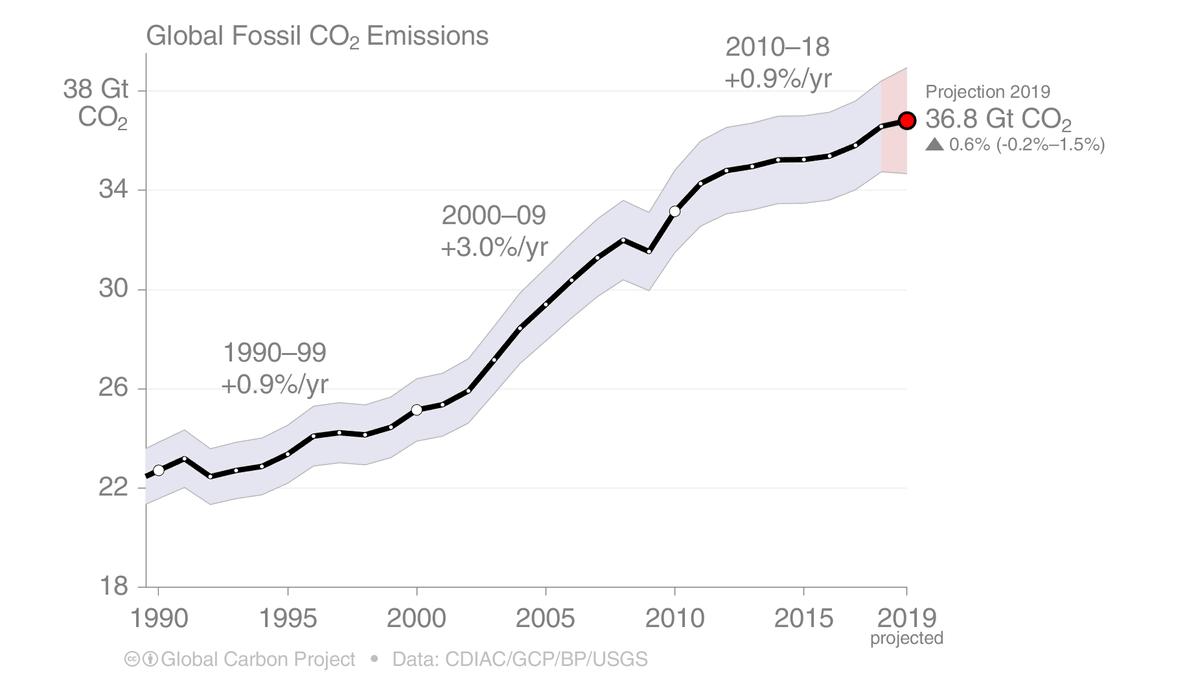
We project global coal, oil, & gas emissions for 2019
* Natural gas up 2.6% [+1.3% to +3.9%], driving >50% of growth since 2012
* Oil up 0.9% [+1.3% to +3.9%] continuing trends
* Coal down -0.9% [-2.0% to +0.2%] continuing its woes
#CarbonBudget #COP25 rdcu.be/bYf1O
2/
* Natural gas up 2.6% [+1.3% to +3.9%], driving >50% of growth since 2012
* Oil up 0.9% [+1.3% to +3.9%] continuing trends
* Coal down -0.9% [-2.0% to +0.2%] continuing its woes
#CarbonBudget #COP25 rdcu.be/bYf1O
2/
By region
* China +2.6% [+0.7% to +4.4%], GDP vs stimulus
* USA -1.7% [-3.7% to +0.3%], coal -10%
* EU28 -1.7% [-3.4% to +0.1%], coal -10%
* India +1.8% [+0.7% to +3.7%], big monsoon, weak economy
* Others +0.5% [-0.8% to +1.8%], weak economy
#COP25 rdcu.be/bYf1O
3/
* China +2.6% [+0.7% to +4.4%], GDP vs stimulus
* USA -1.7% [-3.7% to +0.3%], coal -10%
* EU28 -1.7% [-3.4% to +0.1%], coal -10%
* India +1.8% [+0.7% to +3.7%], big monsoon, weak economy
* Others +0.5% [-0.8% to +1.8%], weak economy
#COP25 rdcu.be/bYf1O
3/
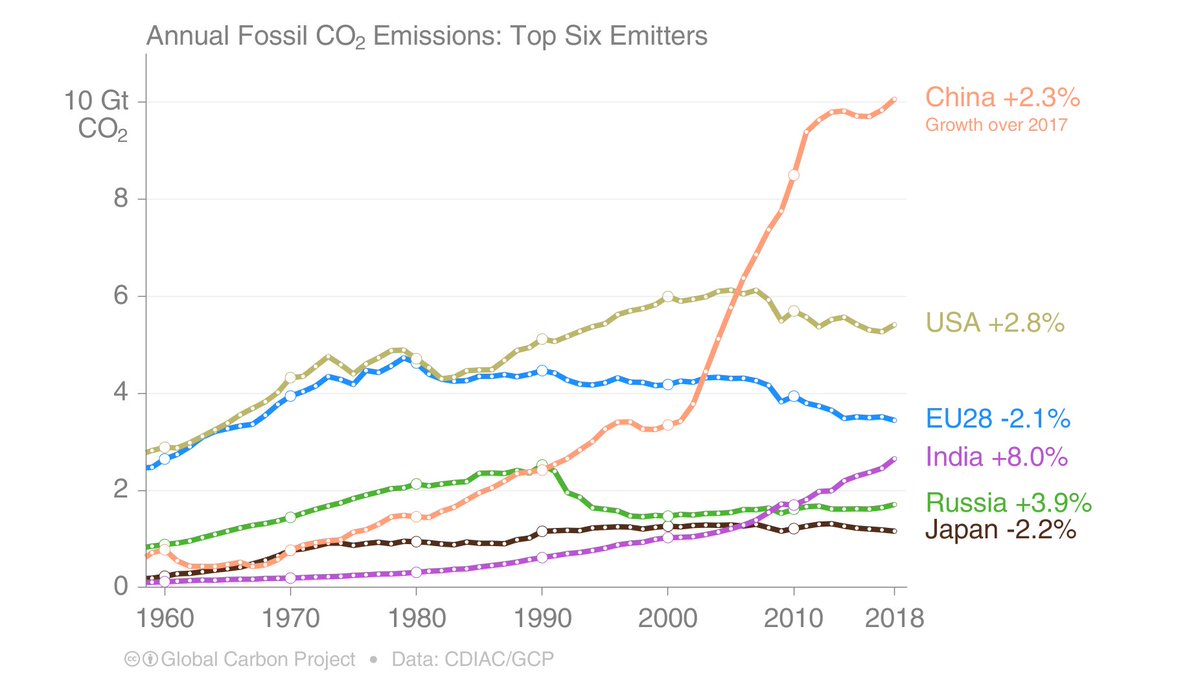
The top six emitters in 2018 covered 67% of global emissions
* China 28%
* United States 15%
* EU28 9%
* India 7%
* Russia 5%
* Japan 3%
All countries, small & big, must mitigate
#CarbonBudget #COP25 globalcarbonproject.org/carbonbudget/i…
4/
* China 28%
* United States 15%
* EU28 9%
* India 7%
* Russia 5%
* Japan 3%
All countries, small & big, must mitigate
#CarbonBudget #COP25 globalcarbonproject.org/carbonbudget/i…
4/
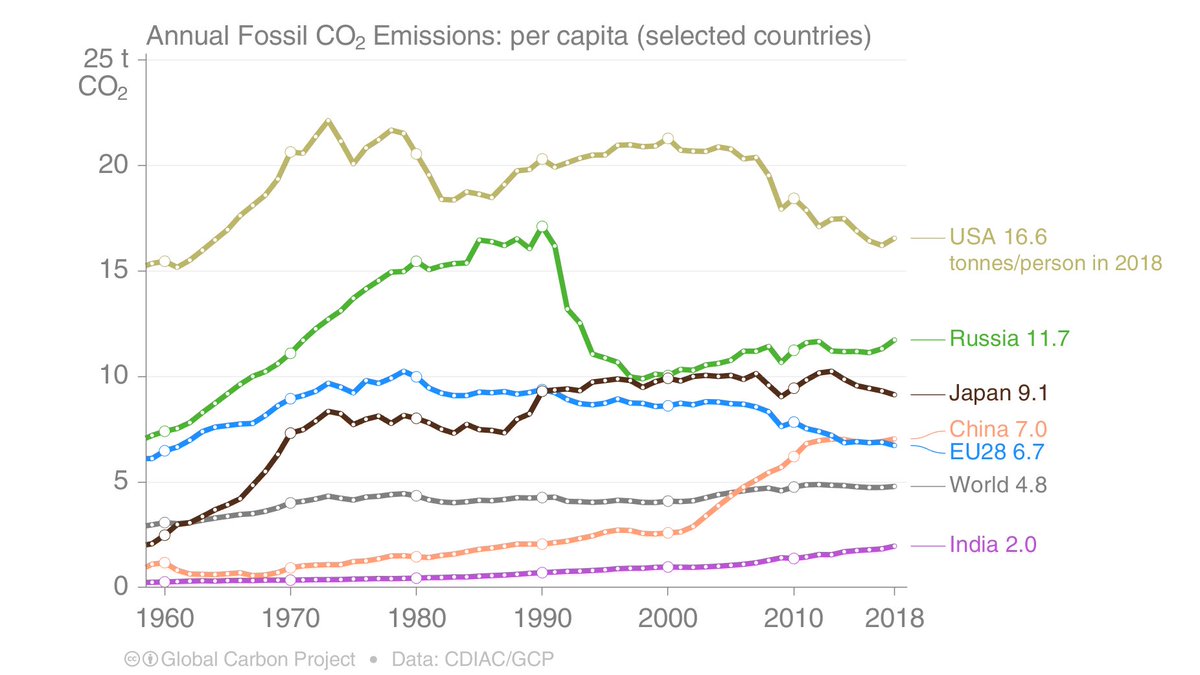
There is a broad spread of per capita emissions, but all countries need to mitigate (albeit at different rates)
* US 3.5x global average
* EU28 & China similar level, ~40% above global average
* India less than half global average
#CarbonBudget #COP25 globalcarbonproject.org/carbonbudget/i…
5/
* US 3.5x global average
* EU28 & China similar level, ~40% above global average
* India less than half global average
#CarbonBudget #COP25 globalcarbonproject.org/carbonbudget/i…
5/
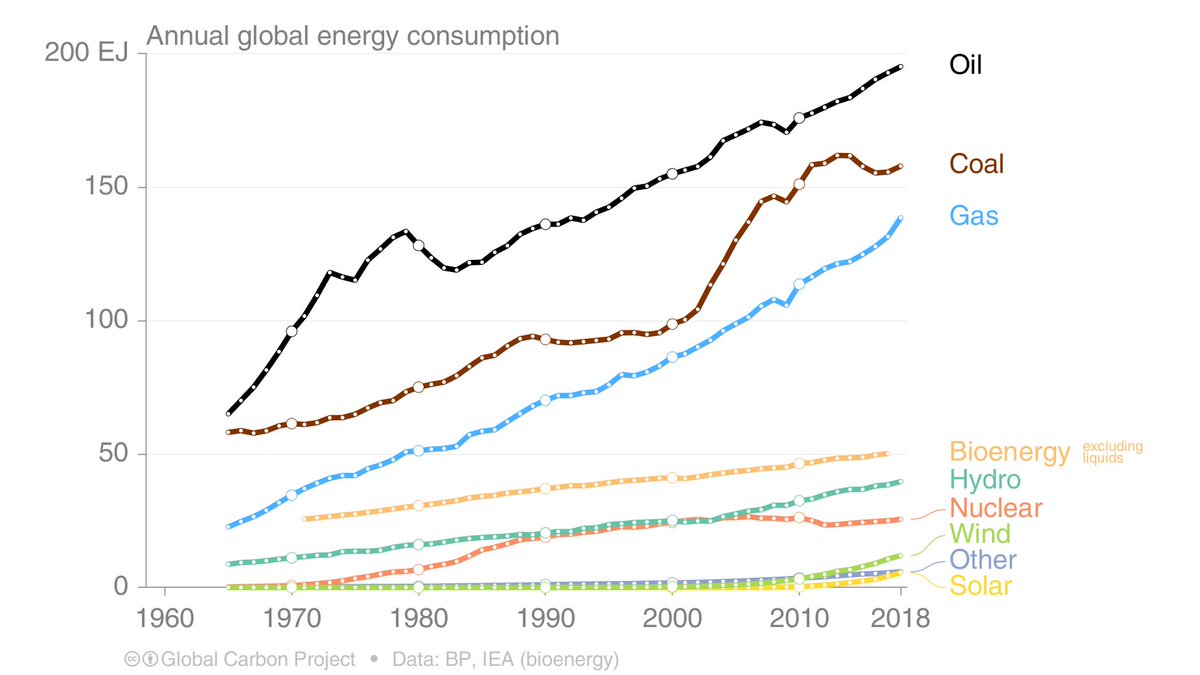
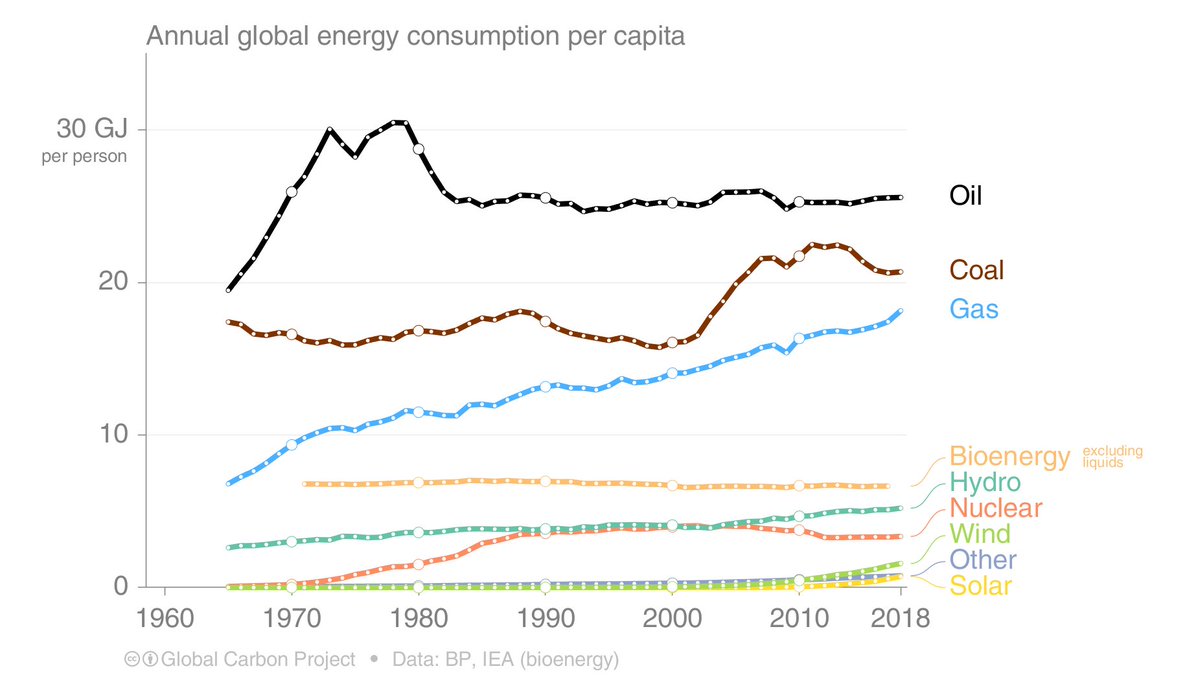
Global energy use is dominated by fossils
* Oil & natural gas growing on trend
* Coal showing signs of peaking, but still uncertain
* Bio & hydro growing at low rates
* Nuclear tinkering
* Wind & solar growing fast, from low levels
#CarbonBudget #COP25 globalcarbonproject.org/carbonbudget/i…
6/
* Oil & natural gas growing on trend
* Coal showing signs of peaking, but still uncertain
* Bio & hydro growing at low rates
* Nuclear tinkering
* Wind & solar growing fast, from low levels
#CarbonBudget #COP25 globalcarbonproject.org/carbonbudget/i…
6/
Per capita energy use indicates how energy sources grow relative to population
Growth rates:
* Faster than population: natural gas, renewables
* Same as population: coal (ex 2000s), oil, bioenergy
* Slower than population: nuclear
#CarbonBudget #COP25 globalcarbonproject.org/carbonbudget/i…
7/
Growth rates:
* Faster than population: natural gas, renewables
* Same as population: coal (ex 2000s), oil, bioenergy
* Slower than population: nuclear
#CarbonBudget #COP25 globalcarbonproject.org/carbonbudget/i…
7/
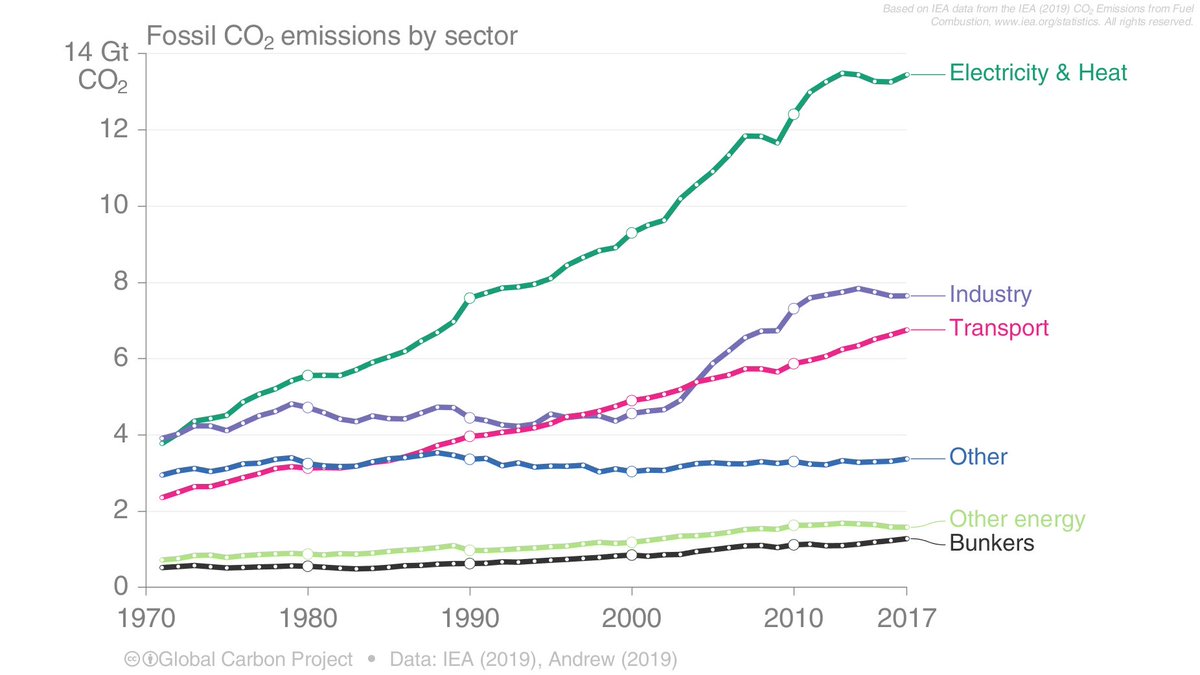
For the first time we use @IEA for sectors
* 45% share, no growth: Electricity, heat, energy
* 23%, no growth: industry (+ cement)
* 19%, growing: domestic transport
* 3.5%, growing: international transport
* 10%, no growth: others
#CarbonBudget #COP25 rdcu.be/bYf1O
8/
* 45% share, no growth: Electricity, heat, energy
* 23%, no growth: industry (+ cement)
* 19%, growing: domestic transport
* 3.5%, growing: international transport
* 10%, no growth: others
#CarbonBudget #COP25 rdcu.be/bYf1O
8/
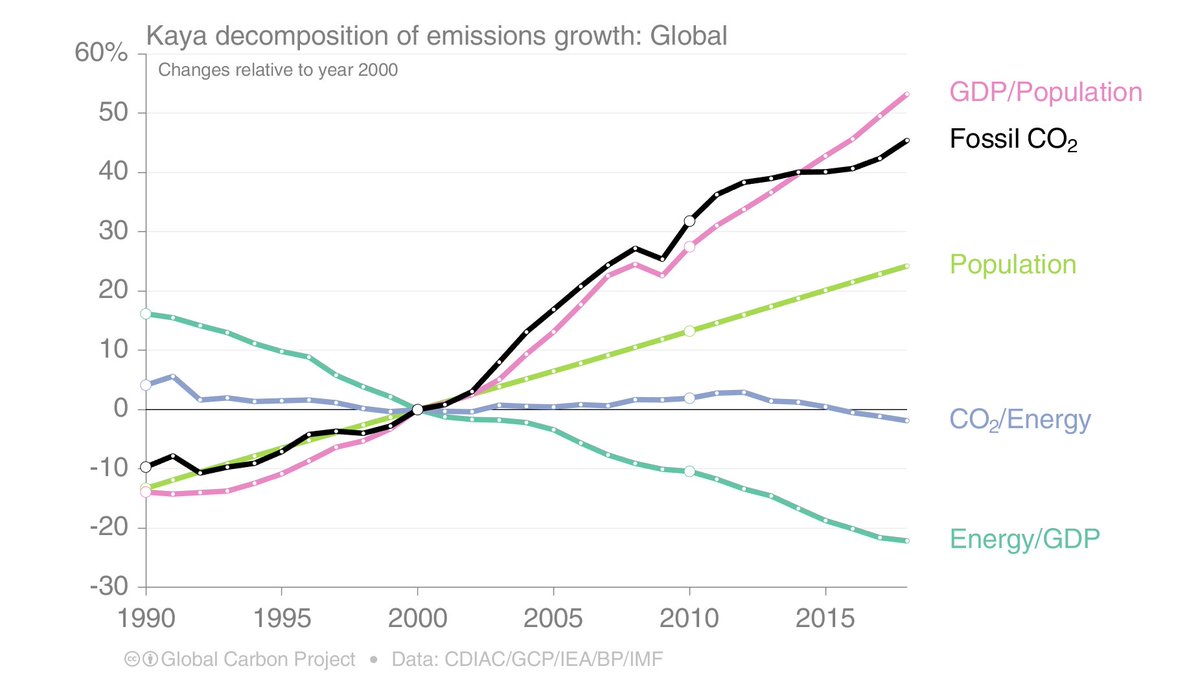
What drives growth in global fossil CO₂ emissions?
* Population & economic growth pushing emissions up
* More effective use of energy & restructuring pushing emissions down
* Decarbonisation only showing small gains recently
#CarbonBudget #COP25 globalcarbonproject.org/carbonbudget/i…
9/
* Population & economic growth pushing emissions up
* More effective use of energy & restructuring pushing emissions down
* Decarbonisation only showing small gains recently
#CarbonBudget #COP25 globalcarbonproject.org/carbonbudget/i…
9/
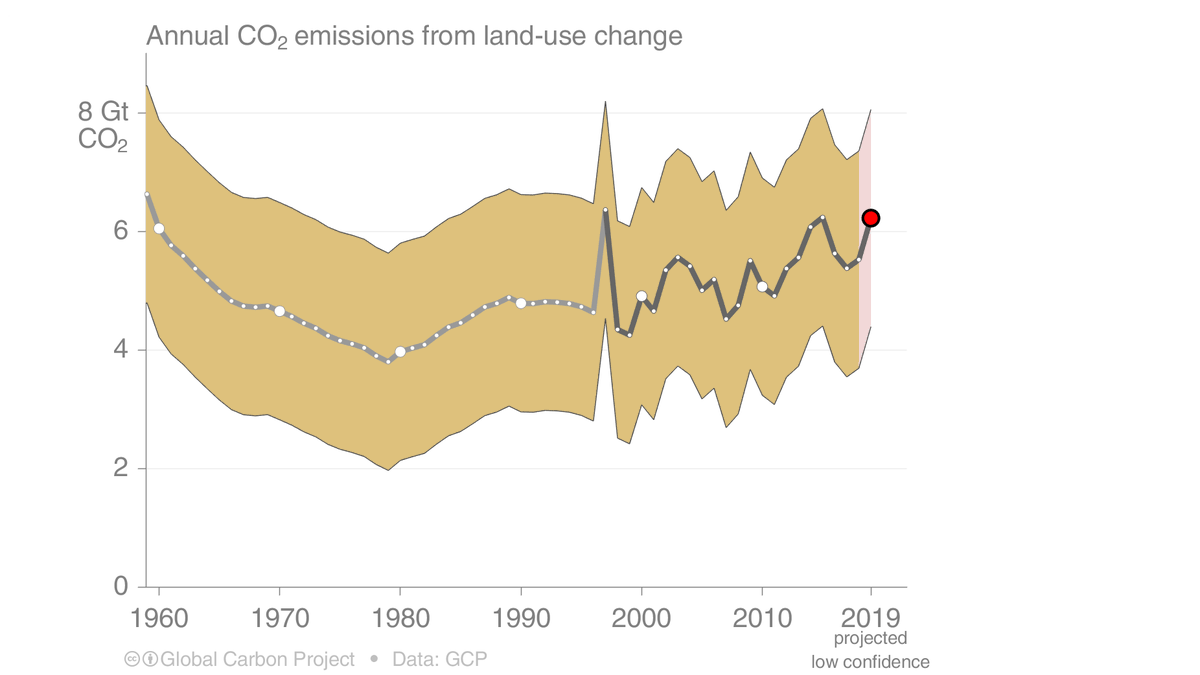
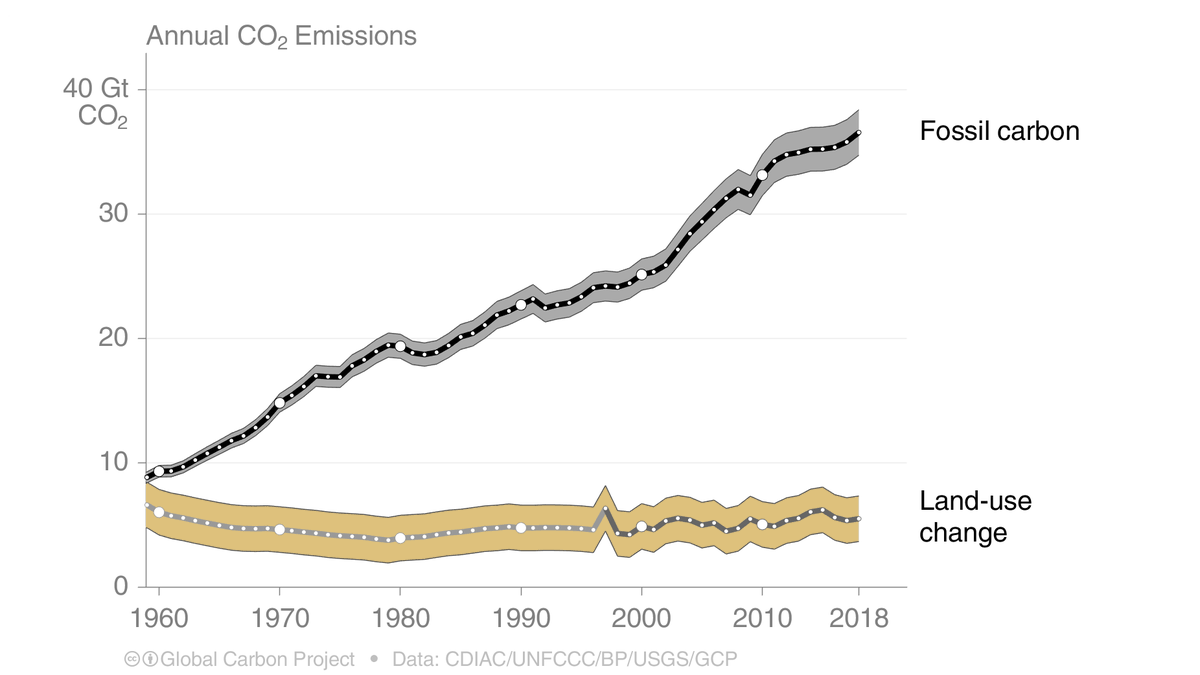
Land-use change (deforestation less afforestation) had an increase of 0.8GtCO₂ in 2019, with large uncertainty, estimated by fires in deforestation areas.
Slight upwards trend in the last decade, noting the high uncertainties.
#CarbonBudget #COP25 globalcarbonproject.org/carbonbudget/i…
10/
Slight upwards trend in the last decade, noting the high uncertainties.
#CarbonBudget #COP25 globalcarbonproject.org/carbonbudget/i…
10/
Fossil CO₂ emissions dominated over land-use change, land-use change 14% of total emissions from 2009-2018
Total global emissions:
* 42.1 ± 2.8 GtCO₂ in 2018
* 43.1 ± 2.8 GtCO₂ in 2019 (not shown), 57% over 1990
#CarbonBudget #COP25 globalcarbonproject.org/carbonbudget/i…
11/
Total global emissions:
* 42.1 ± 2.8 GtCO₂ in 2018
* 43.1 ± 2.8 GtCO₂ in 2019 (not shown), 57% over 1990
#CarbonBudget #COP25 globalcarbonproject.org/carbonbudget/i…
11/
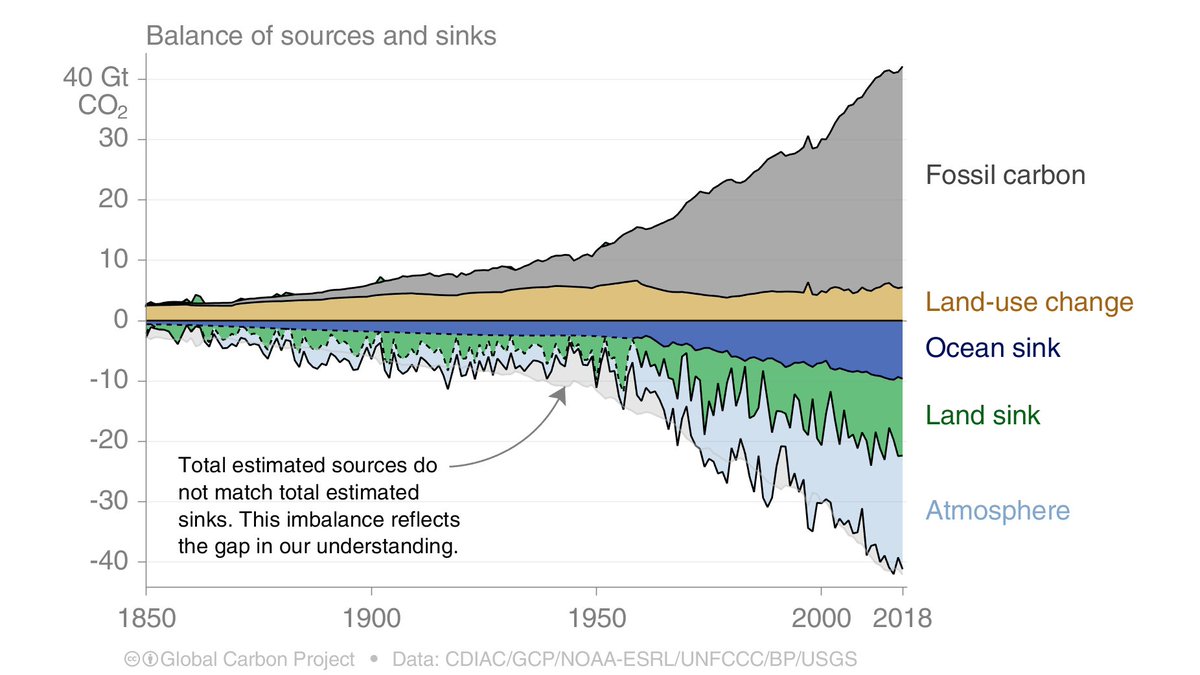
Of the CO₂ we put in the atmosphere
* 86% from fossil sources
* 14% from land-use change
But, only 44% stays in the atmosphere!
* 29% taken up by the land
* 23% taken up by the ocean
* 4% we are unsure!
(% for 2009-2018)
#CarbonBudget #COP25 globalcarbonproject.org/carbonbudget/i…
12/
* 86% from fossil sources
* 14% from land-use change
But, only 44% stays in the atmosphere!
* 29% taken up by the land
* 23% taken up by the ocean
* 4% we are unsure!
(% for 2009-2018)
#CarbonBudget #COP25 globalcarbonproject.org/carbonbudget/i…
12/
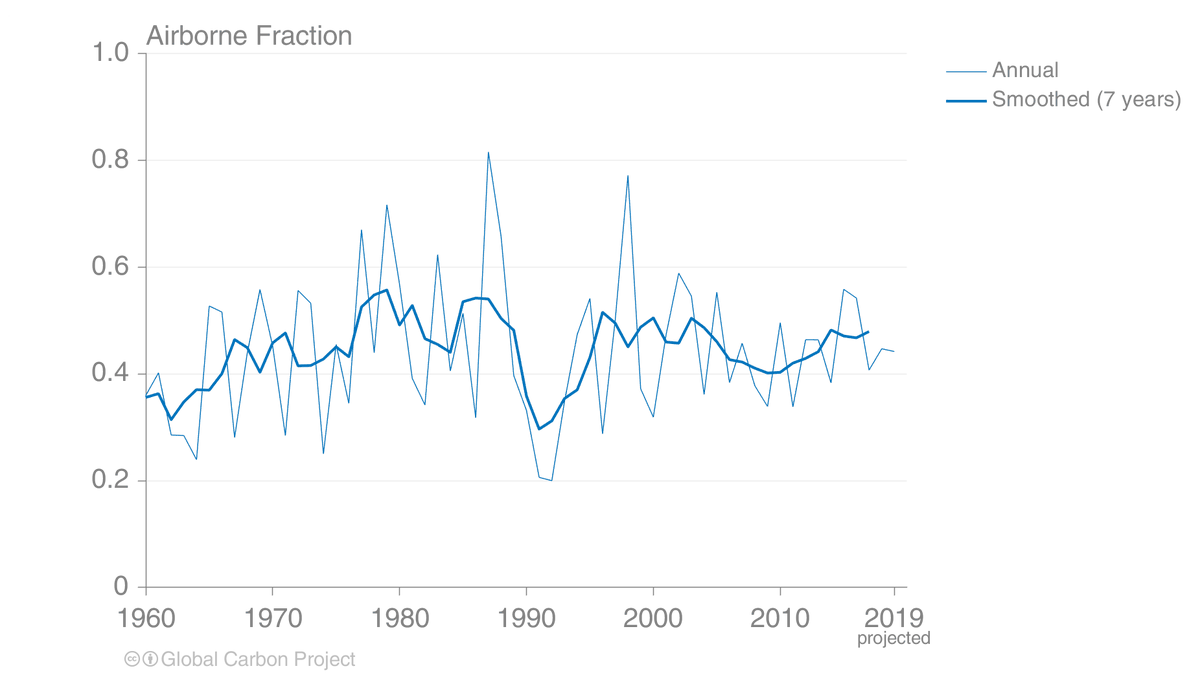
The airborne fraction, the share of the total emissions remaining in the atmosphere, has remained remarkably stable over the last 50 years at ~45%
No sign of bad feedbacks or tipping points at the global level (yet)...
#CarbonBudget #COP25 globalcarbonproject.org/carbonbudget/i…
13/
No sign of bad feedbacks or tipping points at the global level (yet)...
#CarbonBudget #COP25 globalcarbonproject.org/carbonbudget/i…
13/
The cumulative contributions to the global carbon budget from 1850, showing the relative proportion from different sources & sinks
The difference between sources & sinks is the increase in atmospheric CO₂ concentrations
#CarbonBudget #COP25 globalcarbonproject.org/carbonbudget/i…
14/
The difference between sources & sinks is the increase in atmospheric CO₂ concentrations
#CarbonBudget #COP25 globalcarbonproject.org/carbonbudget/i…
14/
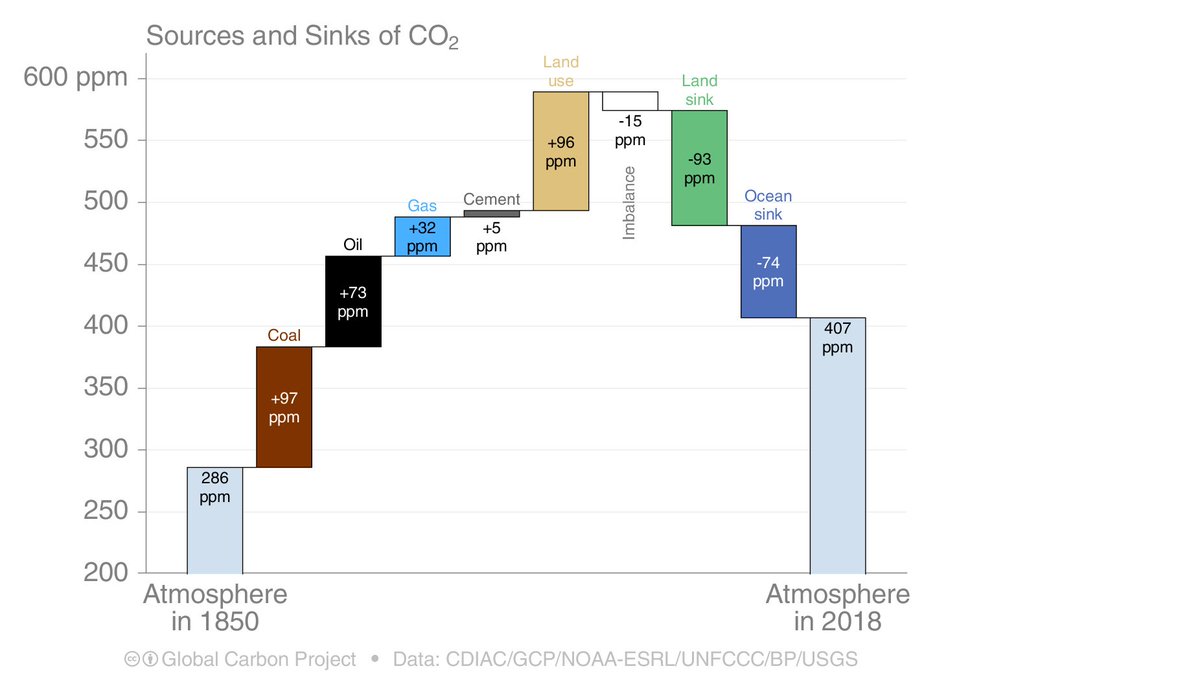
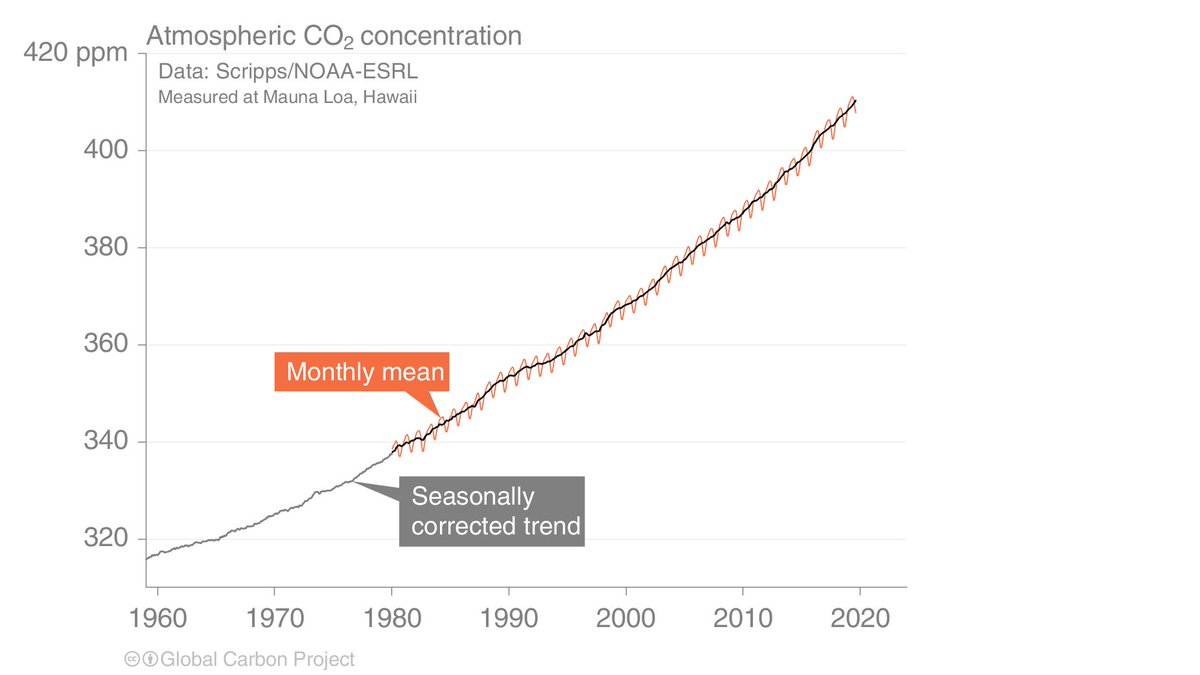
The global CO₂ concentration increased from ~277ppm in 1750 to 407ppm in 2018, an extra 2.2ppm in 2019 to reach an expected 410ppm.
It is this CO₂ that stays in the atmosphere that is currently cooking the planet...
#CarbonBudget #COP25 globalcarbonproject.org/carbonbudget/i…
15/
It is this CO₂ that stays in the atmosphere that is currently cooking the planet...
#CarbonBudget #COP25 globalcarbonproject.org/carbonbudget/i…
15/
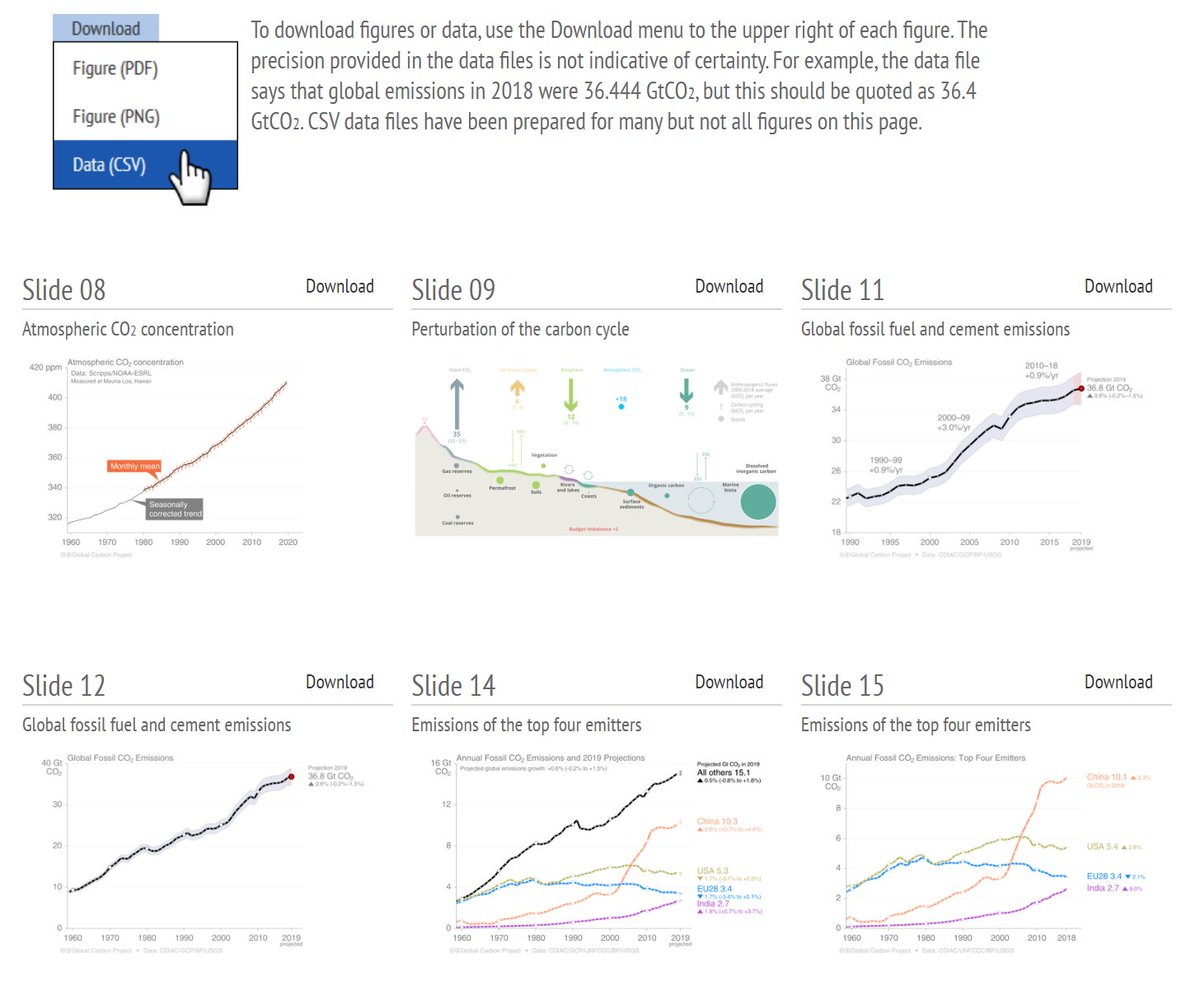
Grab all the data & figures from the tweets via the amazing @Robbie_Andrew (folk.uio.no/roberan/GCB201…) or the full budget material from @gcarbonbudget globalcarbonproject.org/carbonbudget/i…
* Papers
* Slides
* Figures
* Data
* Summaries
#CarbonBudget #COP25
16/
* Papers
* Slides
* Figures
* Data
* Summaries
#CarbonBudget #COP25
16/
Another monumental effort by the team, this year led by @PFriedling.
Thank you all...
doi.org/10.5194/essd-1…
#CarbonBudget #COP25
17/17
Thank you all...
doi.org/10.5194/essd-1…
#CarbonBudget #COP25
17/17