Q C30.
The Amazing Yuripridio wants me to think my statin is making me sleepy.
Which of these can he do?
(A) *Make me sleepy* by suggestion after I take my statin.
(B) Wait for me to be sleepy, and then point out I'm on a statin.
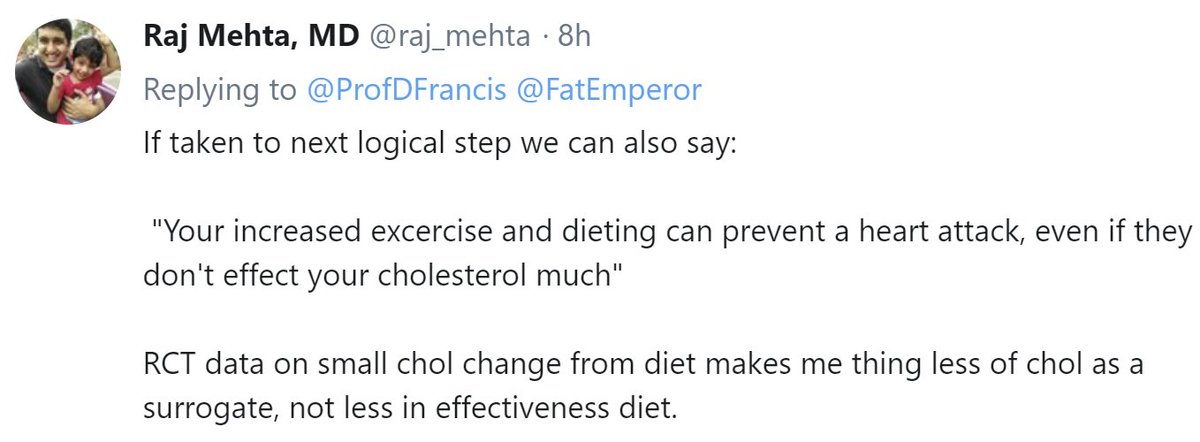
Raj Mehta points out that there is much more benefit diet and exercise than merely cholesterol reduction.
Q C31
Since I genuinely believe in diet & exercise, why don't I tell patients to use them *to lower cholesterol*?
All my above rambling was about primary prevention, i.e. for people who appear perfectly healthy: never had angina or a heart attack
Secondary prevention seems different. But is it a different disease, or the same with higher stakes?

Imagine you are a bit of plaque in some dude, waiting to chip off, expose the plaque interior to platelets and cause an MI.
Do you have any way to find out if any of your colleague bits of plaque have *ever* done the same, in the patient's lifetime so far?
Olly is a plaque in a patient with a previous MI.
Paul is a plaque in a patient with no previous MI (but similar amount of atheroma)
Roughly speaking, how will Olly and Paul respond to (say) statins?
Let's suppose we don't know how statins work (I certainly don't)
Reminder:
Olly is in person with Old MI
Paul is in person without
Taking about 1000 Ollies, and 1000 Pauls, in patients with similar atheroma quantities, given the history of events, which are more likely to have an event in years to come?
(Assume NO treatment)
Plaques can't talk to each other reliably, and even if they could they can never tell if the patient has (or had!) *symptomatic* angina.
They are therefore *unable* to respond differently in primary and secondary situations.
Here's table 3 from:
ndph.ox.ac.uk/files/forms/eu…
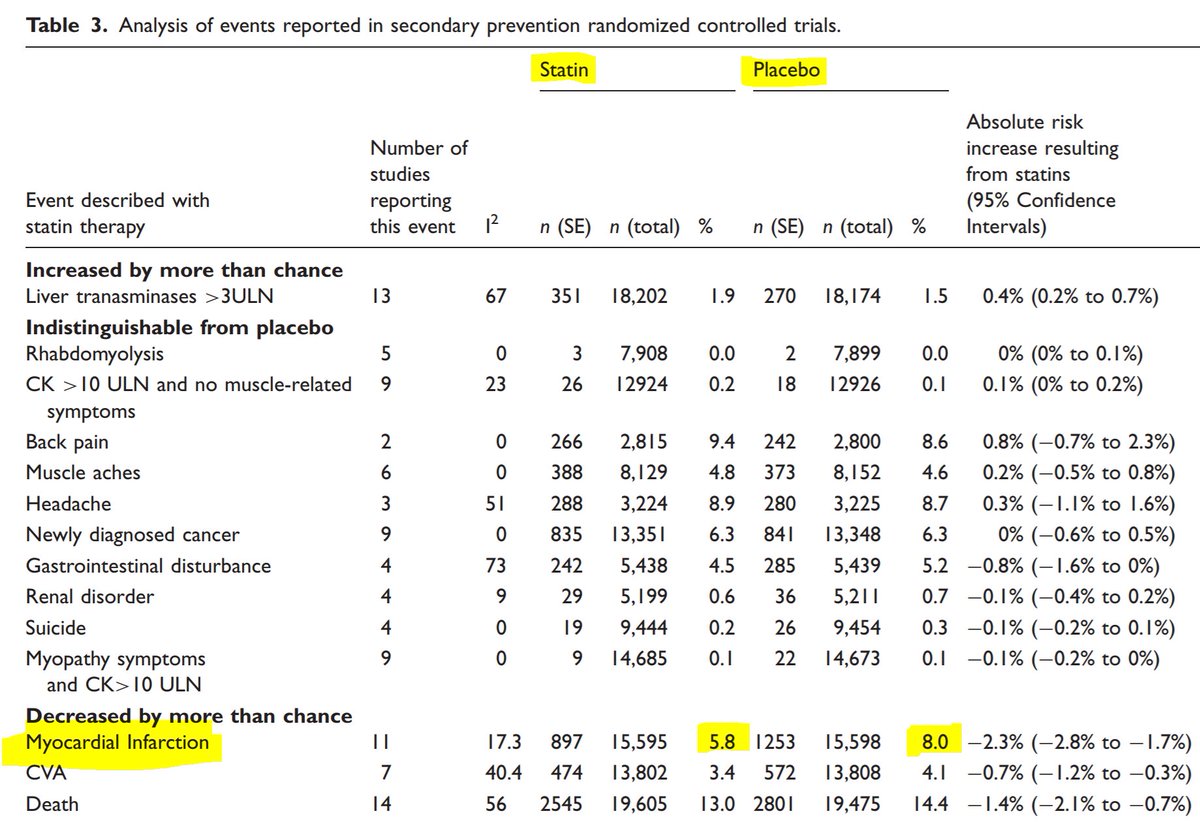
In Judy Finegold's above meta-analysis table of SECONDARY prevention by statin-versus-placebo, roughly what proportion of MI's are prevented by statins?
(This is asking about RELATIVE risk reduction; we will discuss absolute later)
Again please find the RELATIVE risk reduction of MI's.
That is to say, of the MI's that would have happened on placebo, what percentage were prevented in the statin arm?
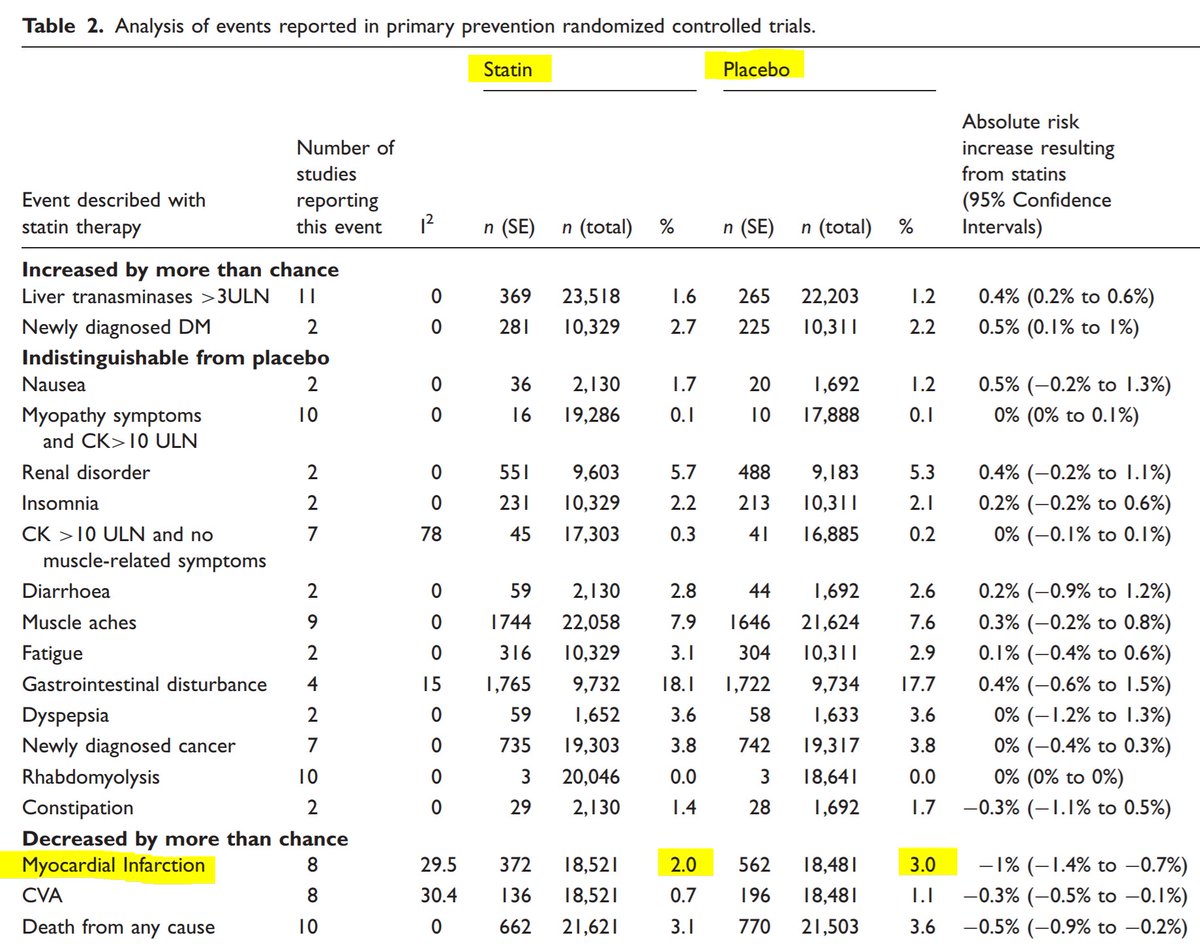
In the above PRIMARY prevention table, the relative risk reduction for MI, by statins, is:
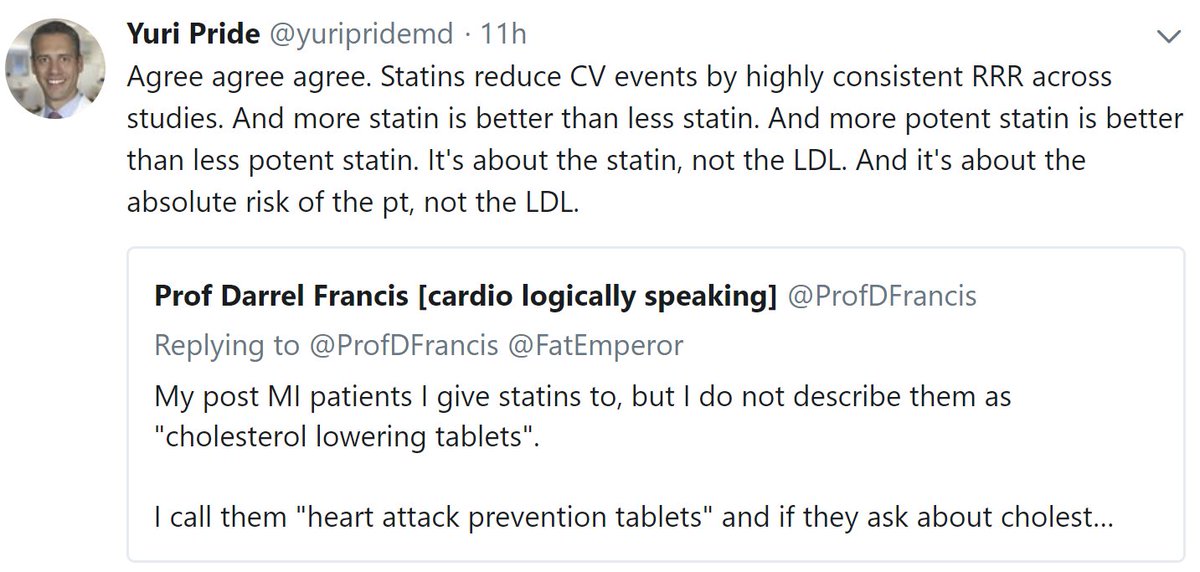
The amazing YuriPridio turns out to be a doctor as well as a hypnotist. He has tweeted this:
6,000 died during the trials
They have sent you a message which you have calculated by your own hand.
No tricks.
Q C37.
Are statins equally effective (in RRR terms) in primary versus secondary prevention?
This is important, because even a 99% relative risk reduction of something that never happen (e.g. abduction by aliens) isn't exciting.
But look at this pdfs.semanticscholar.org/bc5b/62c4da447…
At 7 votes, the *majority of answers* to C37 are wrong. I wonder if this is because people aren't doing the arithmetic?
If people don't like thinking
or using numbers
or developing a mastery of their field,
don't ask me what to do
There are others who will tell you what to do
Obey a guideline, not me😀
No side branches to wreck
No requirement to dissect intima
Cholesterol melts away on demand
Artery beautifully smooth and healthy after
Hell, *I* would take that PCI over any I really do 🤣
Another A Garg special. If you pay per stent, what do you get?
If we aren't fluent in the numbers, we are at the whim of any charlatan or rabble rouser.
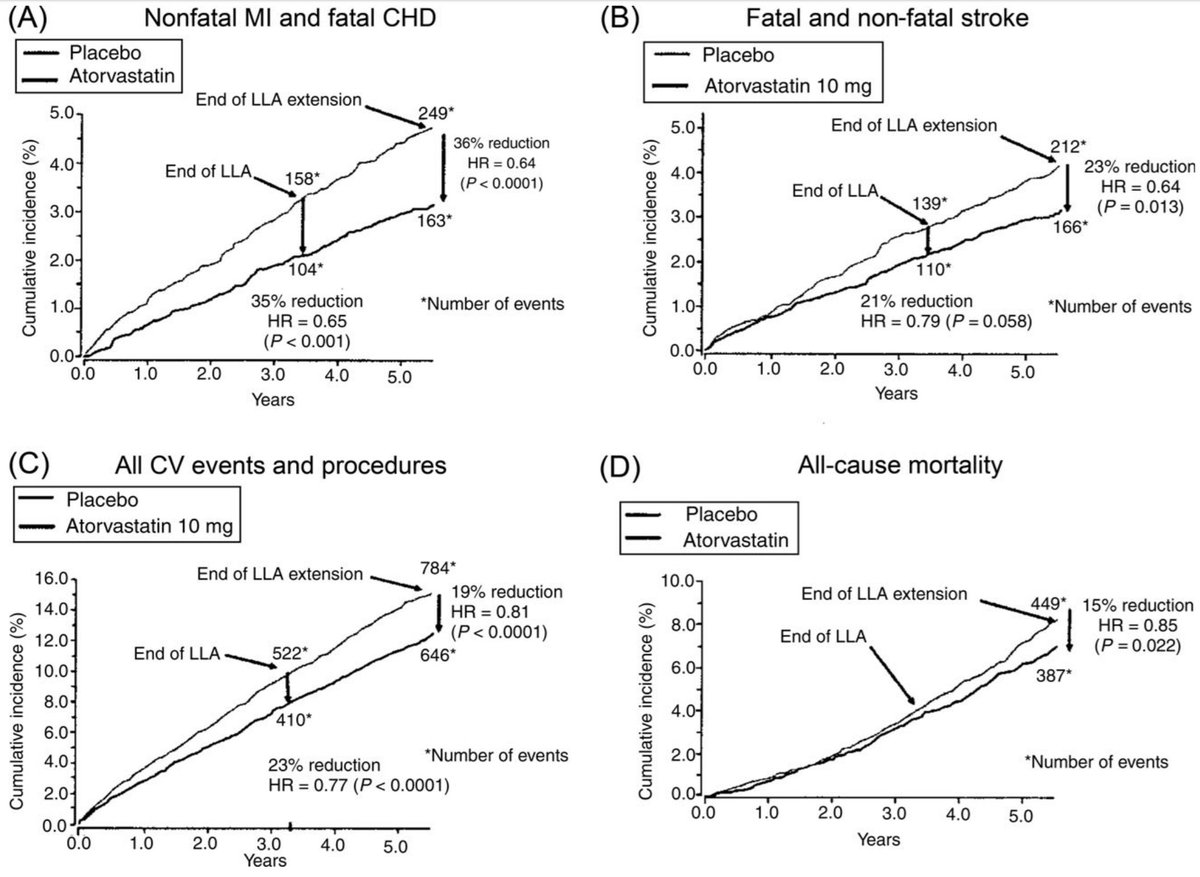
Here's the pic again.
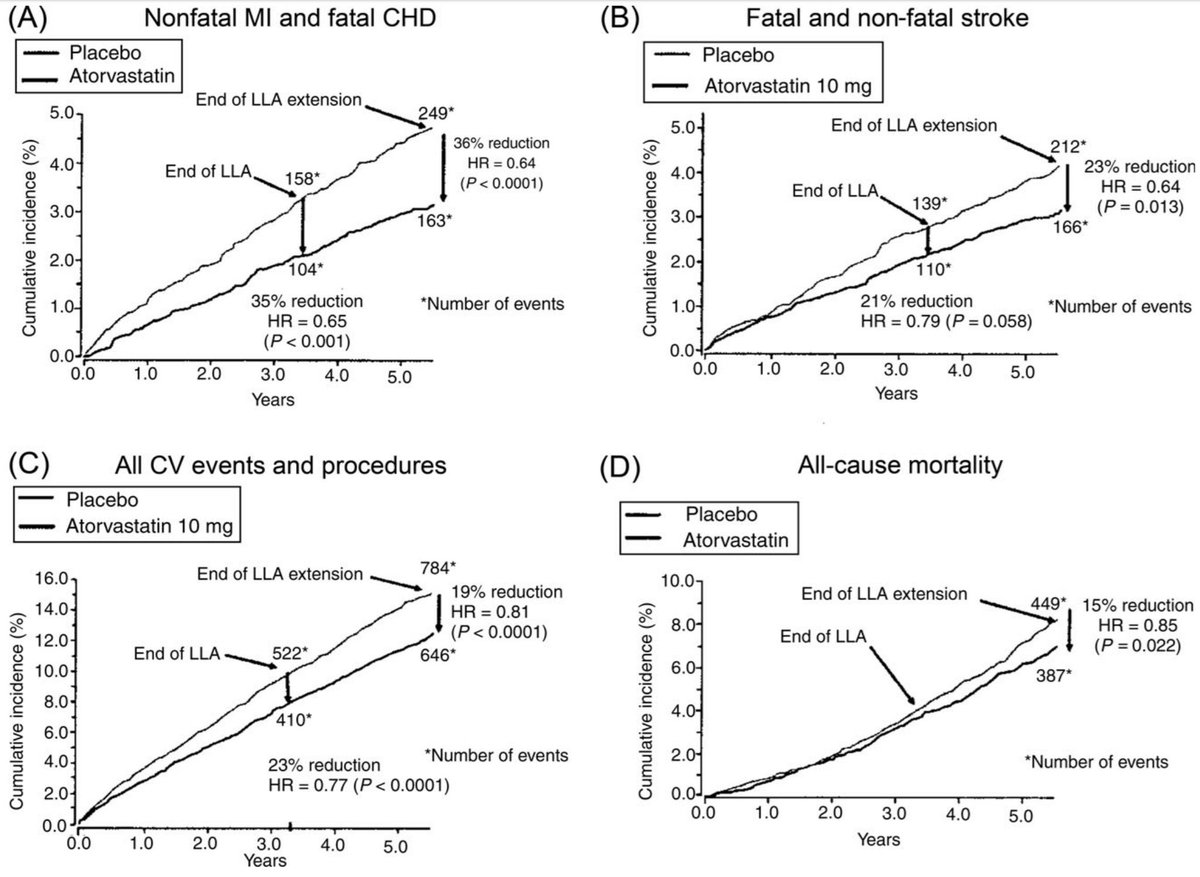
Focus on Panel A (top left).
What is the ABSOLUTE risk reduction (vertical distance between the curves):
(a) at 1.0 years?
(b) at 3 and a bit years?
(c) at 5 and a bit years?
Just guess it by eye.
What is it trying to illustrate?
Can you remember what these three triangles are called?
Equilateral?
Congruent?
Similar?
Isoceles?
Reflex?
Scalene?
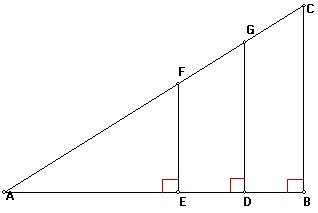
Even if you can't quite remember the name, what do you *know* about these ratios:
FE/AE
GD/AD
CB/AB
Compare the math book triangle above, with the survival curve.
Obviously they are left-right swapped.
But the triangle I want you to focus on is that BETWEEN the survival curves (not the x axis).
The height of the triangle (absolute risk reduction)
When describing AVERAGE effects of lifelong therapies in populations, why do prevention scientists not always talk about absolute risk reduction?
I explain RRR to patients like this.
"Think of all the people you know who have had a heart attack. If they had all taken a statin instead of not, one third *of them* would not have had that heart attack."
We all make judgements based on contingent probabilities: shall I take an umbrella?
Based on how likely it is to rain, and how much better off I will be with one *IF* it rains.
Quentin and Robert are brothers with identical risk factors, except Quentin is 10 years older.
Have a look at this graph from a free-to-read Judy Finegold paper ncbi.nlm.nih.gov/pubmed/23218570
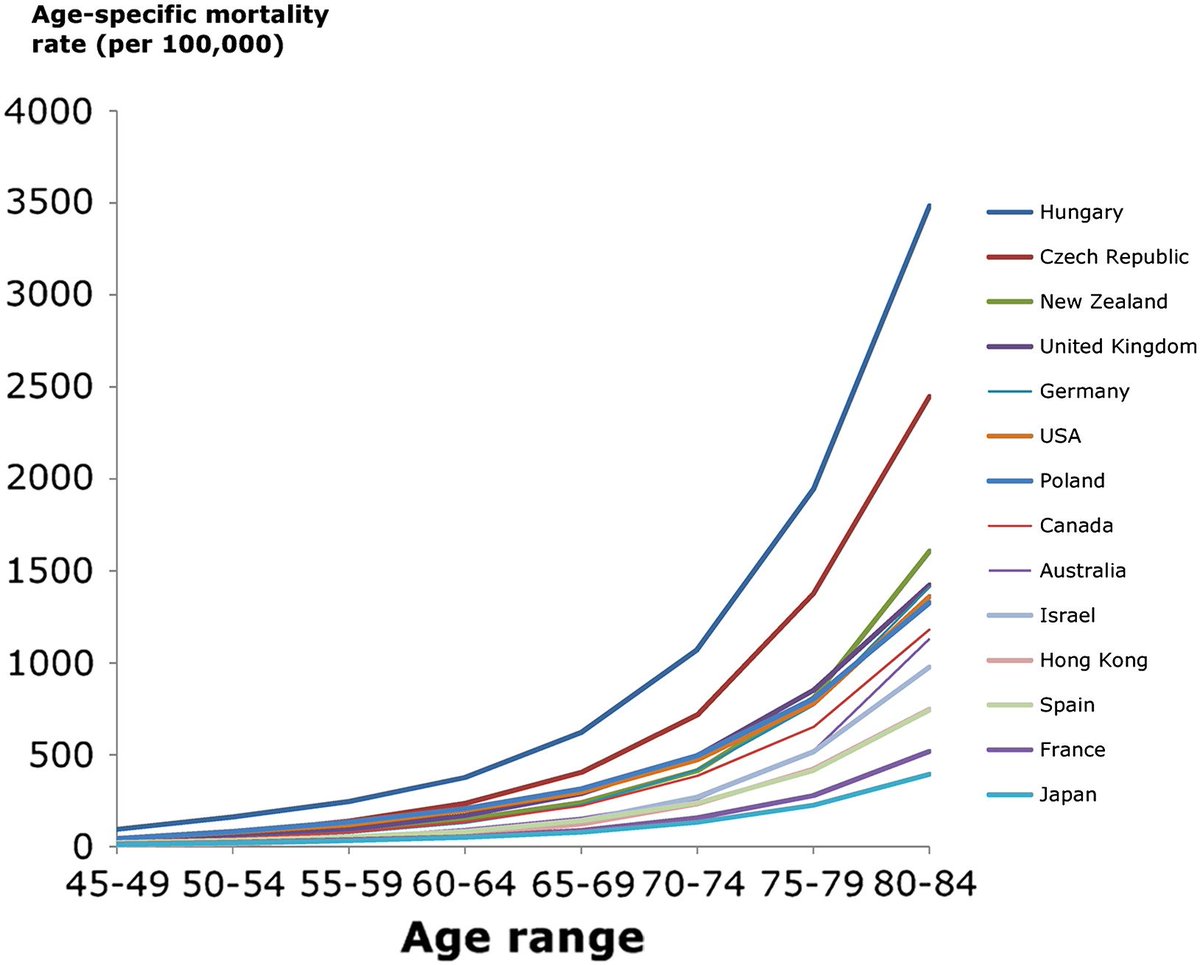
By what proportion is Quentin's CV risk greater than Robert's?
I haven't told you what country they are from.
If you think it matters, suppose it is Hungary (easiest to calc)
Robert has a younger brother, Steven, who arrives late to the sermon.
Which value, as an effect size of statins, will be the same for him?
Oh! Out of Robert's pocket falls a half-empty packet of cigarettes. He looks sheepish.
Which value, as an effect size of statins, will *still in light of this* be the same for him?
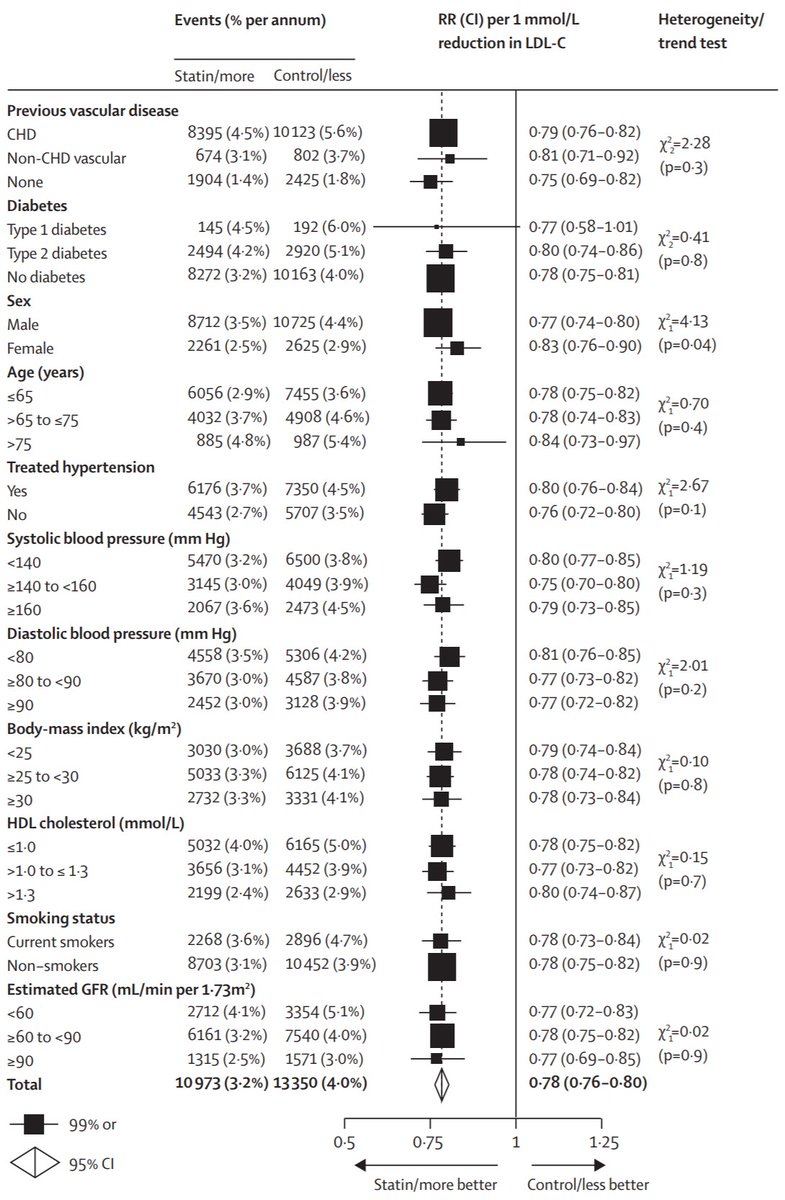
thelancet.com/pdfs/journals/…
And its Figure 3, the most important, most time-saving, most stress-relieving figure of all time for prevention docs and their patients.
Gaze and marvel!
Their mutual distrust and habitual manoeuvering is what makes me confident there is nothing wrong with their data
They're like the Game of Thrones
Less nudity though
The graph above, Fig 3 of CTT 2010, shows *relative* risk reduction in subgroups of the thousands of randomized patients.
Remember Steve has just been outed to be a smoker?
On the graph, what is the difference between the effectiveness in smokers versus nonsmokers?
I have to tell everyone I get very annoyed at some of the things Aseem writes. Then I meet him at a debate and he is so handsome and generous and kind that I end up hugging him and finding common ground
Infuriating for an old git like me
My fellow Cardiology TPD Dr Becky Lane, and I, trained Aseem, and I think I signed his CCT in Cardiology, so I am biased against criticising his logic.
And he is handsome
CTT 2010 Figure 3 is again key here so please excuse me for re-plagiarising it.
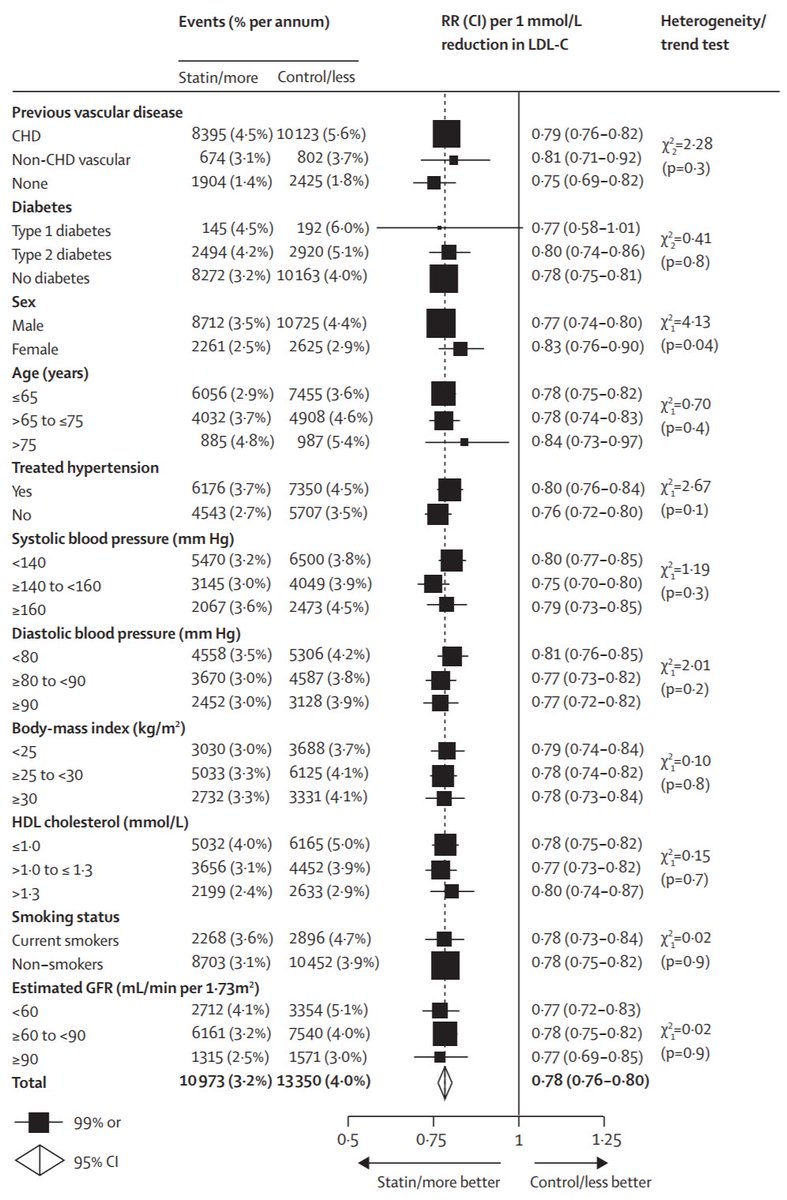
Which of these low-risk subgroups see a *significantly* (i.e. interaction P value <0.05, in last column) weaker Relative Risk Reduction from statins
(a) In the group you chose, what is the relative risk reduction?
(b) In the rest of the patients (i.e. those who don't have that low-risk feature) what is the Relative Risk Reduction?
Just give your best estimates (the point estimate or central value)
It's per mM LDL redn
First 2 ans to C47 different, both wrong
Try this. Look down the right hand column, of p values. They are for heterogeneity, i.e. indicate if subgroups seem more different than usually occurs by chance
Where is p<0.05?
Given what *you* have deduced from the data, RRR is the most consistent feature of statin effect across groups.
RRR almost invariant across all subgroups. A bit weaker in women (although many subgroup tests, so could be fluke #bonferroni)
Therefore in even lower risk patients those typical of CTT 2010, e.g. younger etc. what do you *GUESS* will be the relative risk reduction?
It shows heart attack/stroke/death from cardiac causes.
What is the absolute risk reduction?
What is the relative risk reduction?
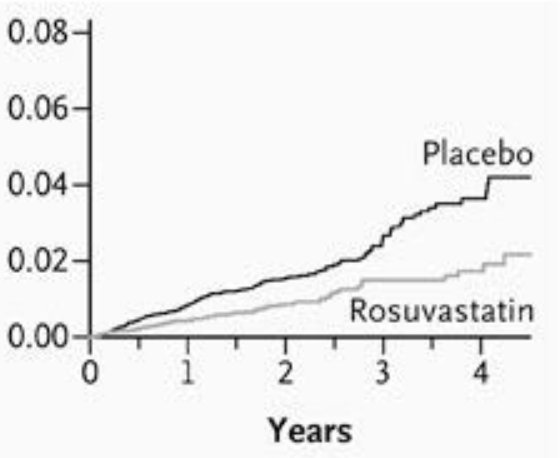
You could say (and I am sure Aseem would, cheeky chappie that he is!) that they didn't *need* a statin.
But wait!
C50.
At 2 years, what proportion of people "didn't need" a statin?
At 1 year, what proportion of people "didn't need" a statin, following the same reasoning?
Without zooming in, from what you know of similar triangles from above, at 1 month, *roughly* what percentage of patients, "didn't need" a statin?
Likewise if I had cancer and 4 years to live.
But this is not the situation my imaginary patient was facing.
When we Brexited away and sunk into the Atlantic.
Or got blown up by an errant tweet from Donald Trump.
His window is not 4 years but 40 years or more.
Hint: Explained in this Seinfeld paper (i.e. paper about nothing) by Tushar Salukhe
circ.ahajournals.org/content/109/15…
If he had discovered DNA, and published that, I wouldn't be impressed - anyone can do that.
But to publish primary school math in Circ - that takes genius!
See pic
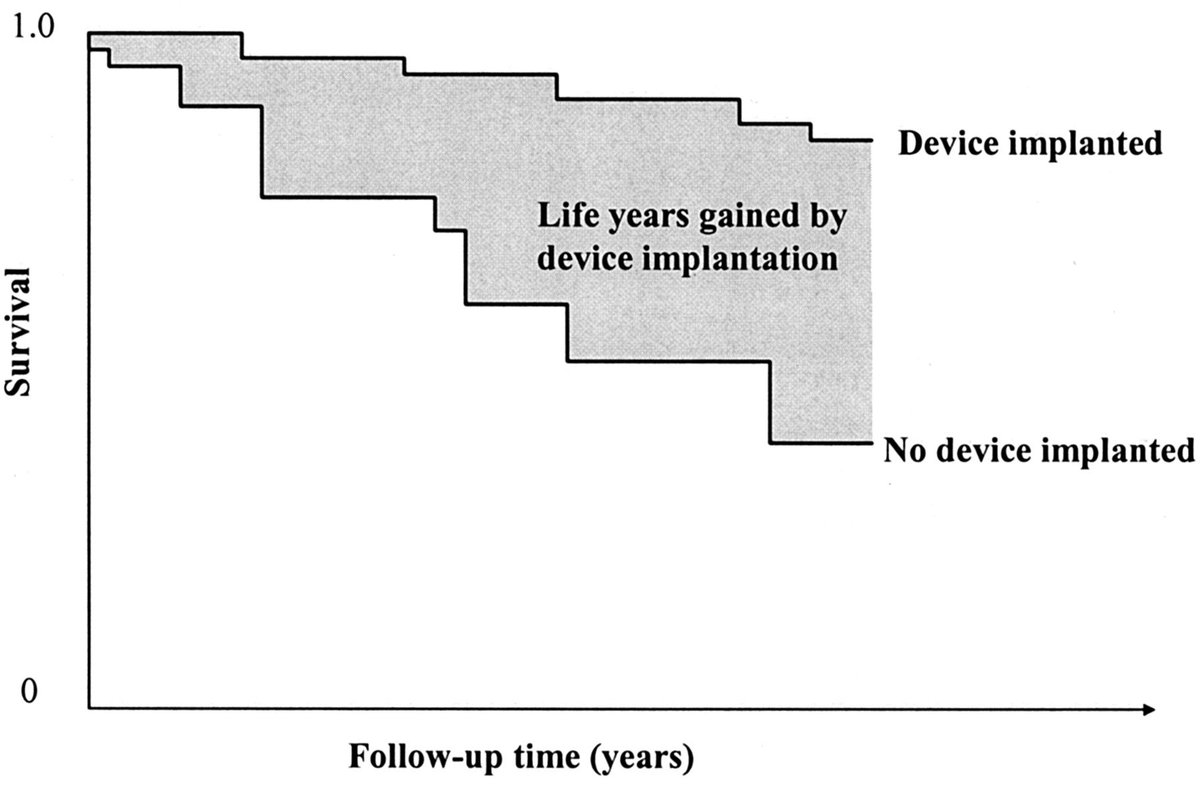
Start by looking at the left half of the grey triangle. From its top left corner to half way along it.
Then look at the whole grey triangle.
By by what scale factor has its area increased?
*That* is how Tushar got it into Circ!
It's not as obvious as I thought.
Here is a clue.
Its the new logo for Zygotron Metadynamics (the only bone marrow cardiac stem cell corp you can really trust)
stemcellheartcure.wordpress.com

Re-asking because important. Sorry to those who got it right first time: vital to understanding life-years-gained in low risk patients.
Also helpful for passing primary school maths.
View the whole outer triangle, instead of the small top-left small one, does what to area?
Now the Salukhe-Seinfeld question.
If you had a trial, that showed a certain lifespan gain, over its duration, and then you HALVED the duration of the trial, i.e. you looked only at the first half.
What happens to the lifespan gain you will calculate?
And this single act of looking at just the "left hand half" of the trial duration, does what to the
"Number Needed to Treat, to give One Extra Life Year"
What is the duration of statin use one is generally *intending* on when one starts?
A few months, see how it goes.
Until a friend get side effects.
Until the first prescription runs out.
Indefinitely.
I see debate here, and neck-and-neck between two answers for a time.
Consider this:
Is cardiovascular risk like pneumonia, where a course of antibiotics cures it?
Or does much of our risk come from things like age, diabetes, family history, weight [in practice hard to ↓]
In light of this, what is the ideal theoretical length of a trial of primary prevention in LOW RISK (e.g. young and generally normalish) people?
A 4y trial of 17,000 pts in 1,300 hosps is a landmark.
I am *not* criticising; merely advising how not to misinterpret.
Halving followup approximately quarters lifespan gain.
A 4-year trial instead of 40 years MIGHT underestimate lifespan gain by what factor?
Limiting analysis to 4 years might dramatically underestimate the benefit (in terms of lifespan gain) for low risk pts, because in the first few yrs nothing was going to happen to them.
Other than accumulating coronary atheroma...
But my bam is not easily boozled.
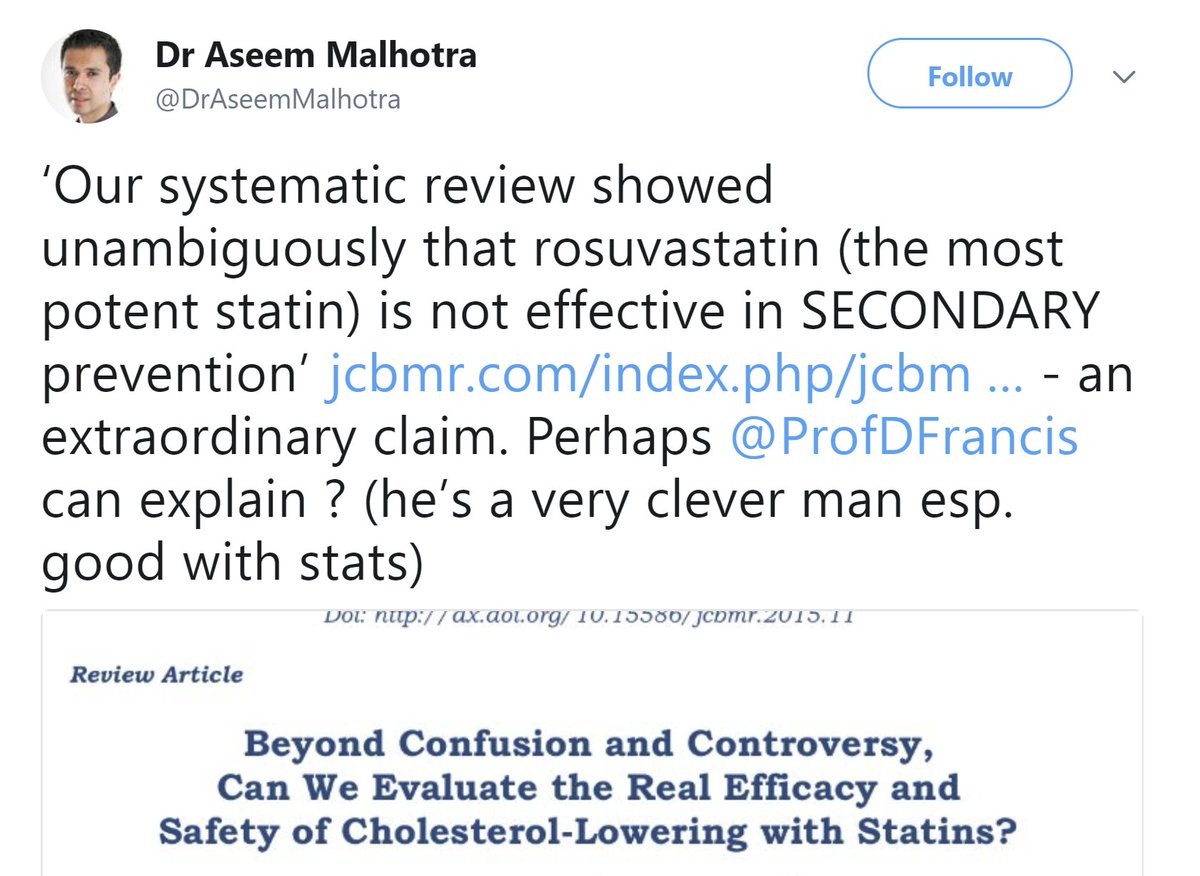
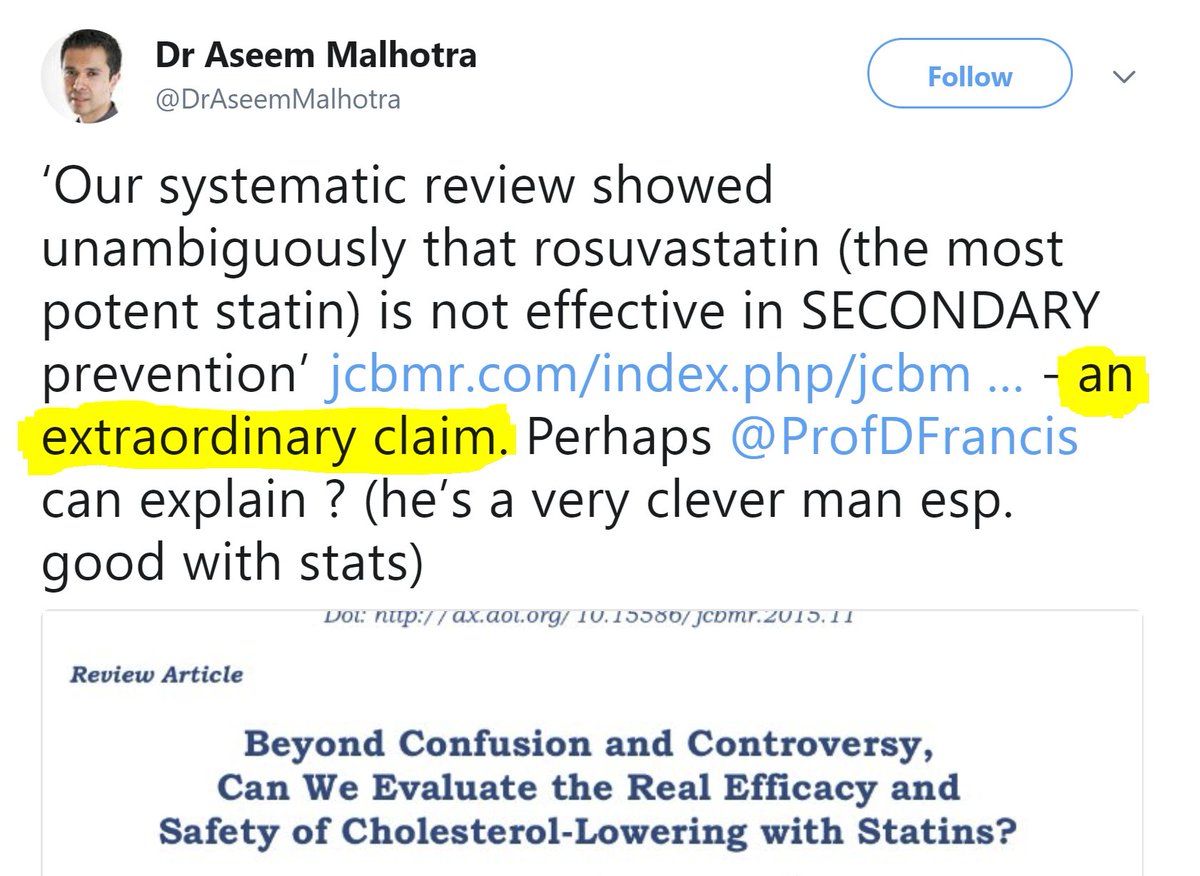
The article is here jcbmr.com/index.php/jcbm…
I do encourage everyone to read the abstract at least.
These all happen to test one particular statin. Why?
C61
A - Only that one has sufficient patent life for its company to hope for a return on investment
B - It's the weakest statin ever
C - It's the strongest statin ever
Companies swallow up the easy-to-win indications for a drug, as soon as they can.
Stable angina
Post MI
Acute coronary syndrome
etc.
What was left for the rosuva boys?
A few billion in the bank, but which patient groups left, that others have so far avoided enrolling?
Here are its results
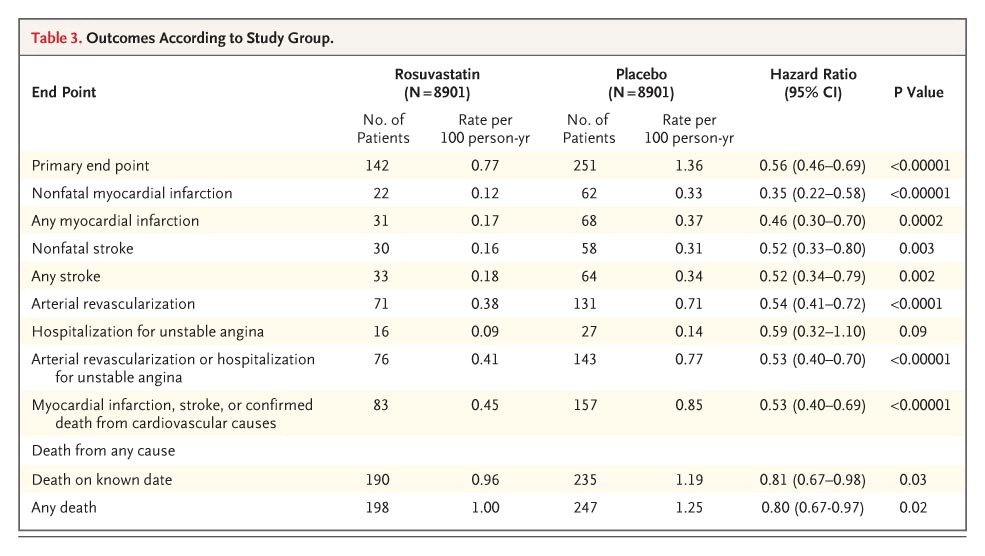
Aseem's yellow-highlighted statement is undoubtedly true.
If you enjoyed this, please retweet the whole quiz-o-rama () to your friends.
If not, send it to your enemies.
Next week I will cover rational management of statin side effects.
If you know anyone (self, friend, pt) who has stopped statins for good because of side effects, we have the solution:
samson-trial.org

