,
48 tweets,
22 min read
Read on Twitter
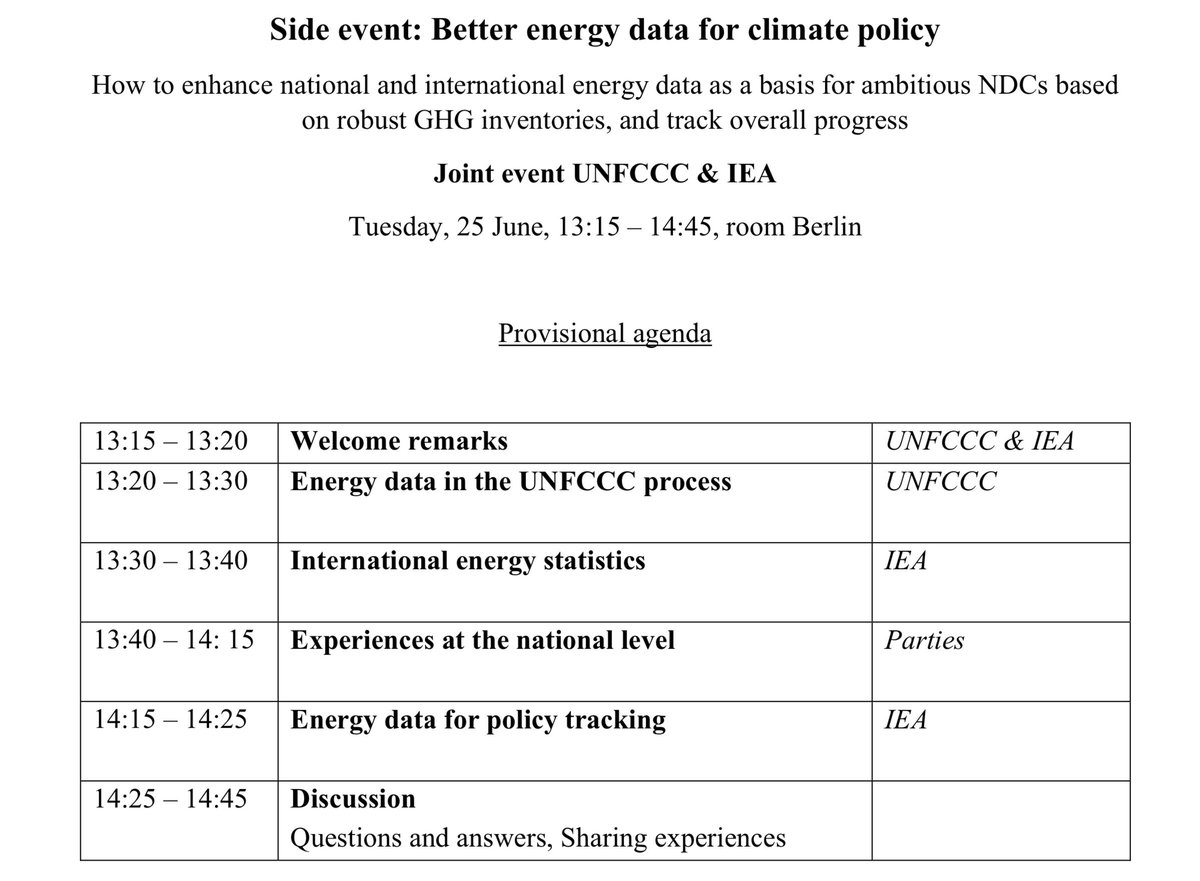
#SBSTA50 #SB50Bonn "Better energy data for climate policy: @UNFCCC, @IEA and Parties perspectives" Live Stream Started. Join the Skype stream: bit.ly/2Ivhh1B. Agenda: bit.ly/2IvWv1W. @openmod @openclimatedata 
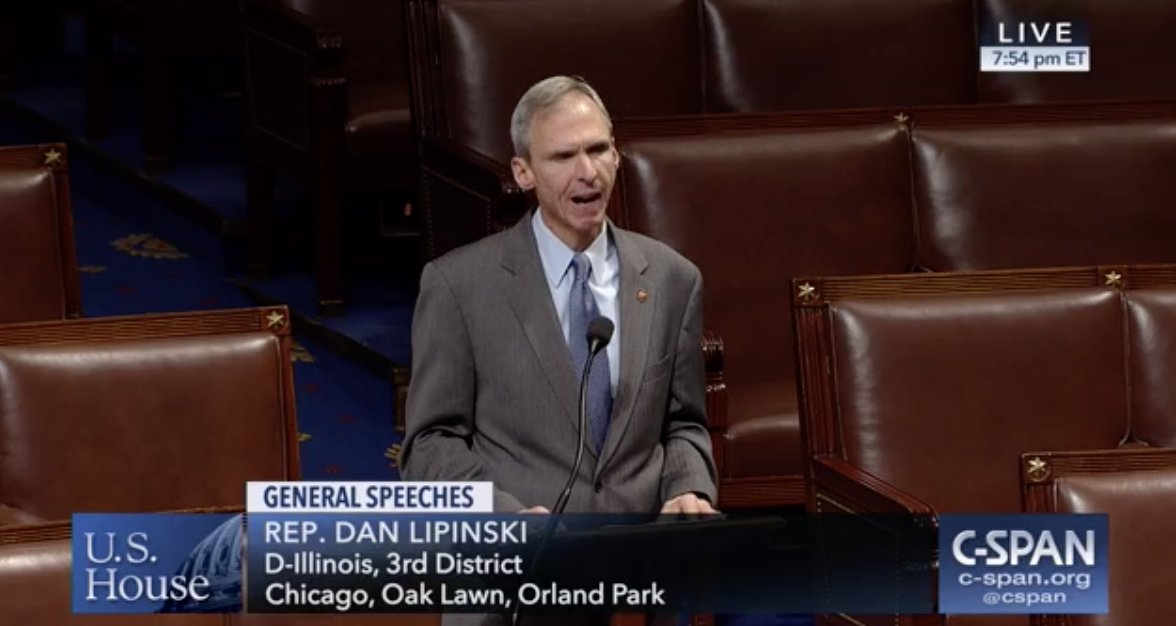
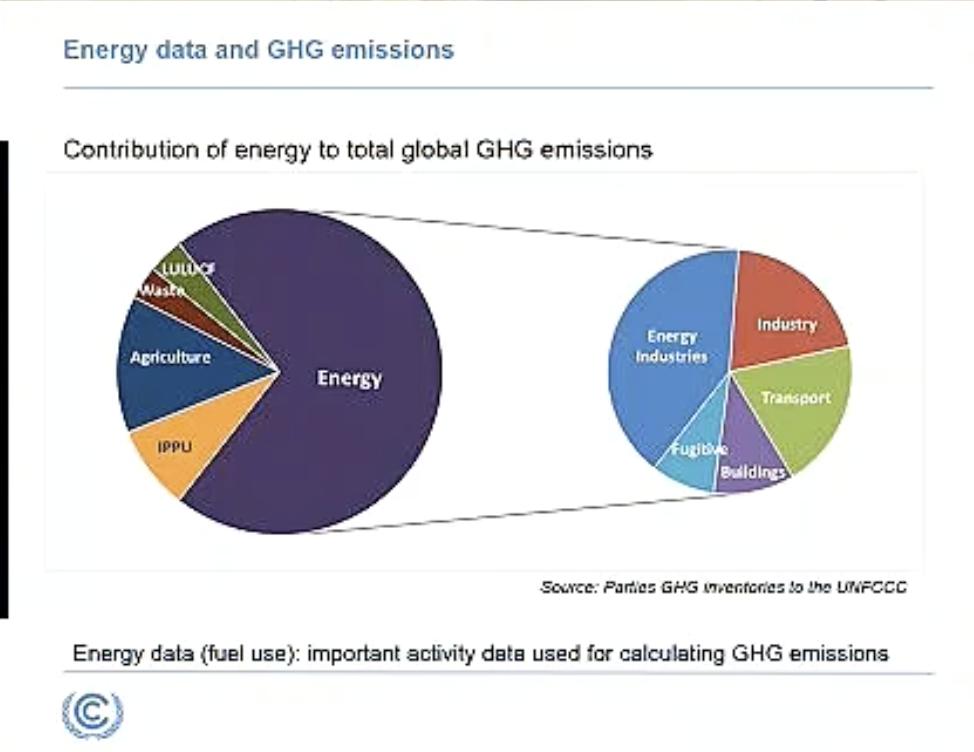
Barbara Mulik from @UNFCCC points at the importance of energy data for climate policy.
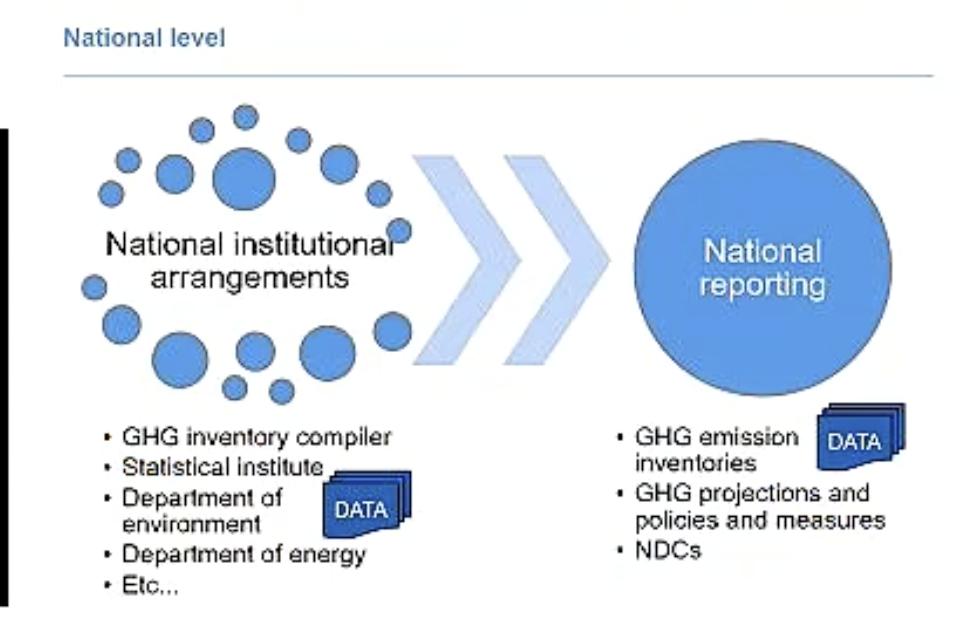
Mulik further points out the importance of arranging a good working collaboration and workflow between Parties and @UNFCCC under the "Enhanced Transparency Framework". Importance of capacity building in this regard.
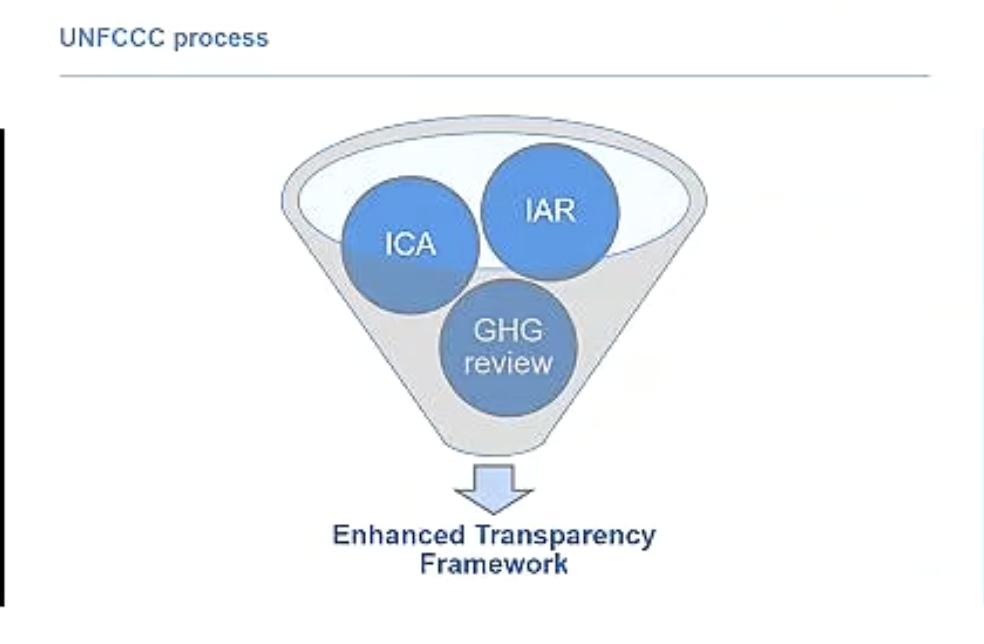
GHG review: is documentation there, activity data documented, comparison with international data (are things consistent) ?

GHG Projections are also provided by Parties, and evaluated by other institutes. Data review is not that strong as for GHG review data, because of the inherent uncertainties involved.

In the future the @UNFCCC builds further on an “Enhanced Transparency Framework", based on the existing institutional setup and workflow.
### Francesco Mattion from @IEA about IEA's data collection procedures:
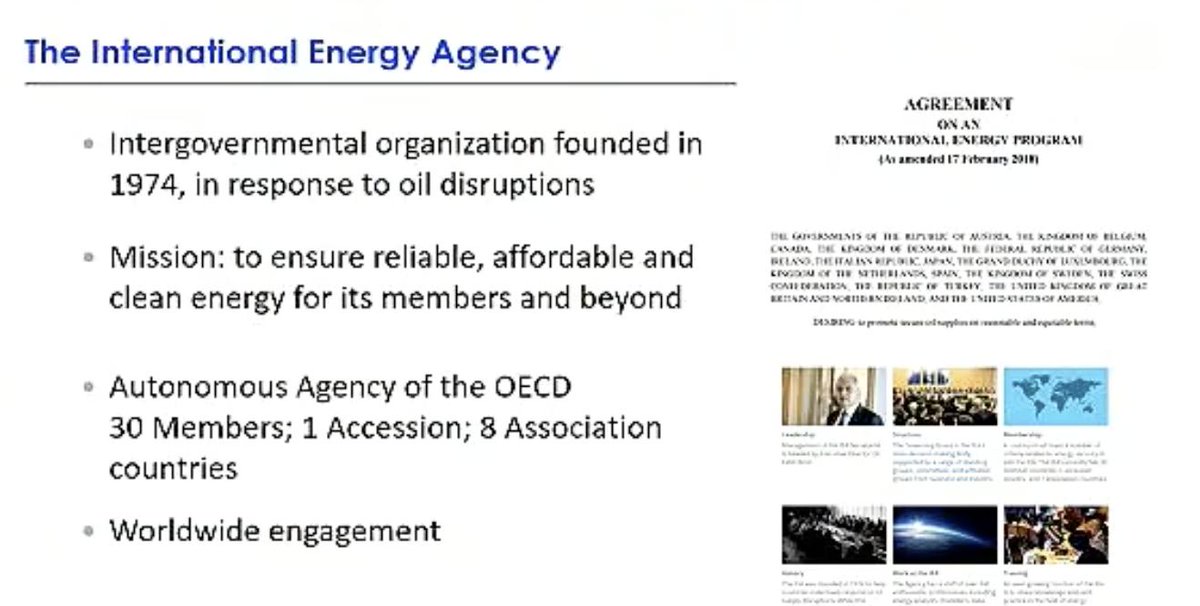
IEA is mandated to collect data for @OECD countries. Data is collected on a voluntary basis of non-member countries, with a strong focus on capacity building.
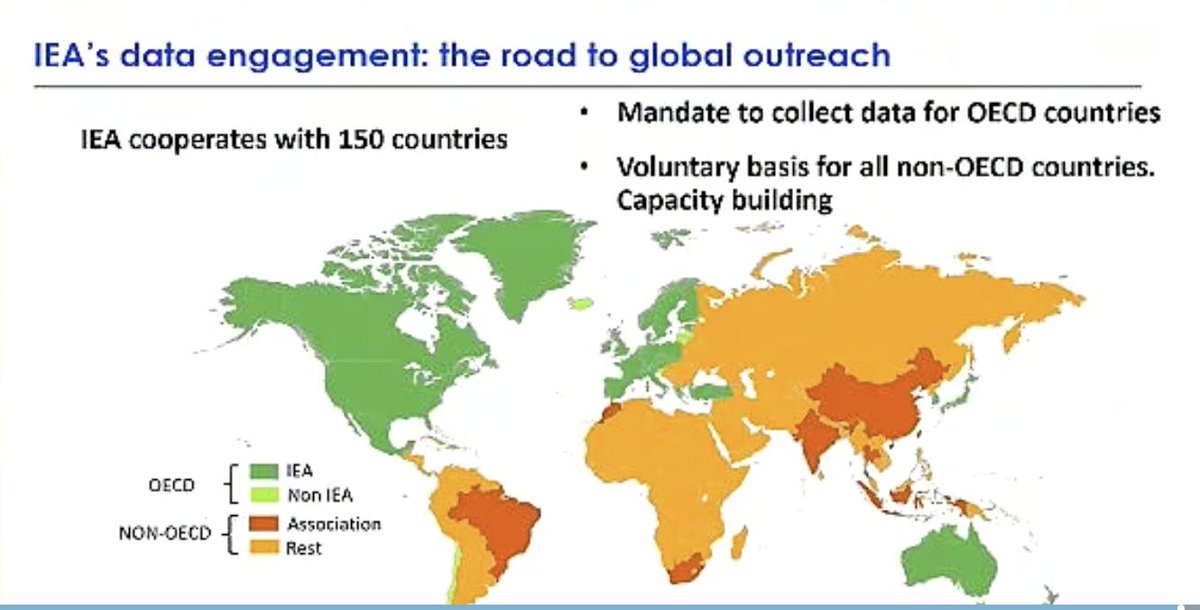
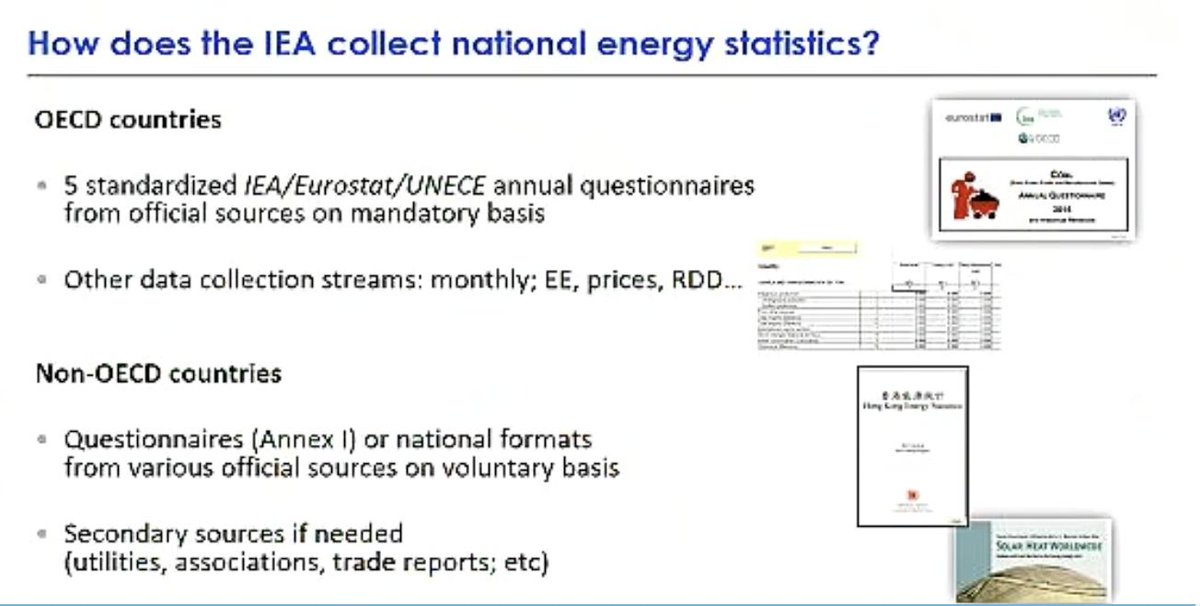
@IEA data collection for [1] OECD Countries : 5 standardized questionnaires + other data collection streams and [2] non-OECD : may be in questionnaire format or from other national sources.
International coordination through “international recommendations for energy statistics” (UN Statistical Commission, 2011) = output from big consultation with different organisations (UNFCCC, IPCC, Eurostat, UNSD). Key = comparability.

Energy data central to GHG inventories : @IEA provides annual comparison data for Annex-I countries = official stage of GHG inventory review. Energy data used for different policy objectives should be comparable and coherent.

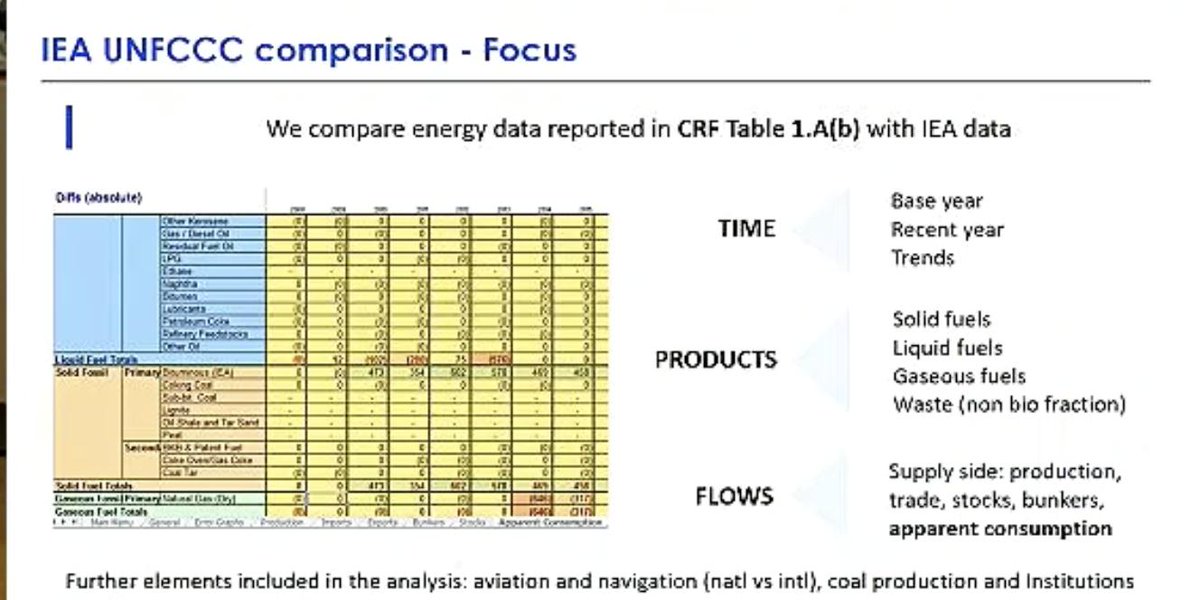
@IEA compares reported data in CRF Table 1.A(a) [supply-side data] with IEA data. Comparison of time, base year, recent year and trends. Checking of fuels + disaggreagtion of products.
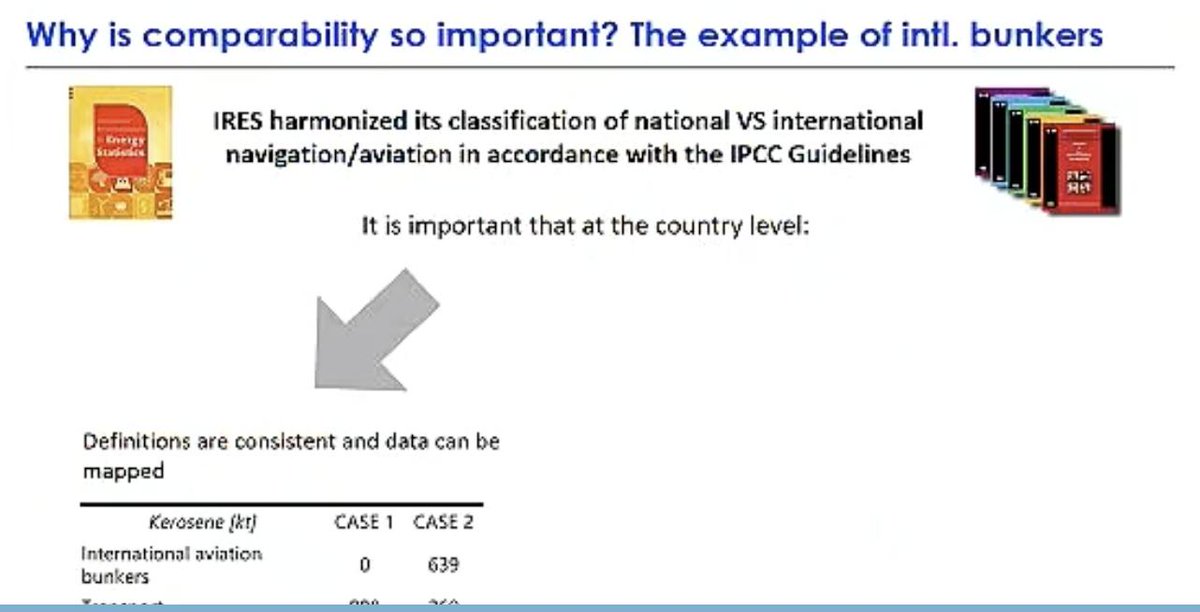
Why is comparability important ? : International Recommendations for Energy Statistics (IRES) [bit.ly/2IKdAoZ] harmonized classification of national vs. international data, ex: navigation / aviation. Consistency + split between national and international = important.

Importance of cooperation at the national level : there should be national arrangements to create and use only one energy data set for different purposes (national reporting, GHG inventories, ..). Also important for non-annex 1 parties where data system is not yet that developed.

## Country Experience : Riita Pipatti [bit.ly/2IKC29O] from @StatsFinland on GHG Inventory and energy statistics collaboration - harmonized data for energy and climate policies

Situation in Finland : statistical office = responsible for GHG inventories. Reason = capacity in energy statistics in office.

Acces to energy data : different registries streamlined. Collaboration happening, but systems not yet fully harmonized (lassifications not the same). Inventories rather strict (no reporting gaps), using complementary sources. Important data = EU ETS dataset.

Confidentiality sometimes prohibits sharing of data. For important sources there are agreements with companies, most sources public. Difficulties : differences in terminology, scope, detail. Harmonisation: same fuel classification in energy statistics and GHG inventory.
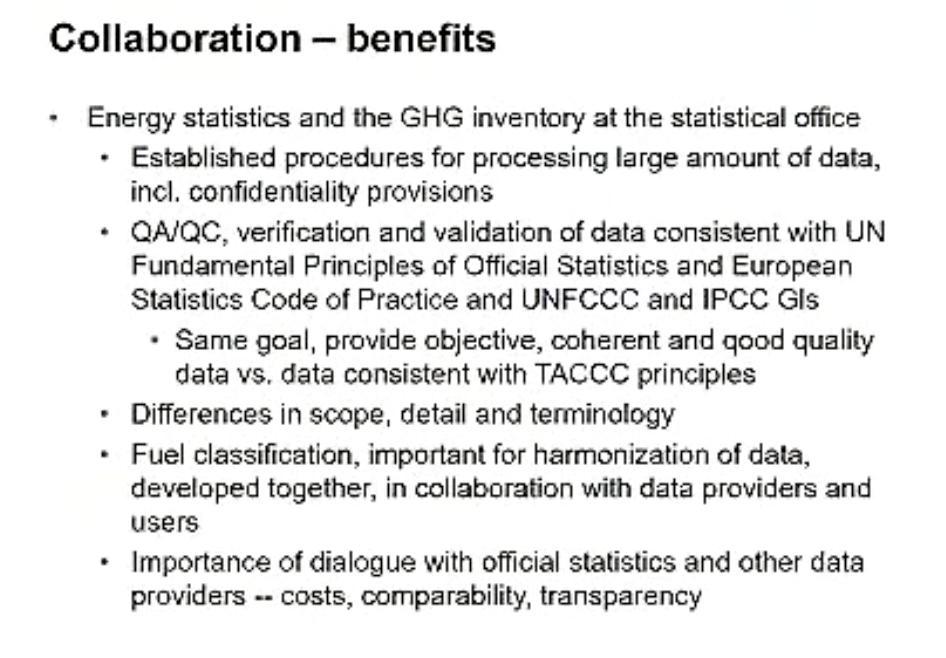
Mutual benefits of collaboration between energy and GHG inventory teams and institutions : checking and gap filling together, high-level expertise, more in-depth information for policy makers.

## Tian Wang from the National Center for Climate Change Strategy and International Cooperation (NCSC) [bit.ly/2IKS0ke] on Information on China's GHG Inventory related to Energy Data
Methodologies : energy = biggest source of emissions (80 %) [2012]. Using sector-specific emission factors. Inclusion of Methane and N2O in inventory. More recent inventories should capture more accurate emission factors.

Ministry of environment responsible for data + input from national bureau of statistics. Data originates from NBS (activity + background data). Fugitive emissions: NBS & NEA provide activity data [same dataset]. DFs are from official data + investigations + entreprises.

Areas of improvement: energy sector = large. Milestone in 2013: statistical reporting system has been established [first hand data from enterprises, structured by UNFCCC data structure]. Challenges: inconsistency between UNFCCC and national data structure, data dispersed, . [1/2]

... some sectors (aviation/maritime) are included ad-hoc. Historical data = expert-based, lack of human resources. QA/QC varies between sectors. + 1996 vs 2006 guidelines transition still happening. [2/2]
## Dirk Gunther [bit.ly/2IKO6rv] from @GermanEnvAgency [Section Emissions Situation] on Germany's institutional arrangements for GHG inventories with respect to energy data
Country specific implementation of Art. 5 (1) KP [Kyoto Protocol] requirements in Germany: based on agreement of state secretariat of relevant ministries. No official legislation implementing this workflow. GEA in charge of compiling and maintenance of data. [1/3]

Core principle of agreement/national system: use previously existing data flows and statistics. Primary data source = official statistics + energy balance. Not included in agreement: access rights to all relevant data for GEA. [2/3]
... : this is because of federal structure and federal structure of official statistics —> not always access to background data —> cooperation agreements setup, in particular for confidential data. [3/3]
Members of WG Group on Energy Balance : ministries + statistical offices + business associations. Arrows = data flows. Eurostat resp. differs from national reporting --> discrepancies. Background data not available, but resolved in enhanced transparency framework.

Most challenging issue = access to confidential data. The original dataset did not have data ownership included. Currently delay of 1 year in data (before was 3 years). Second most challenging = second-tier data access.


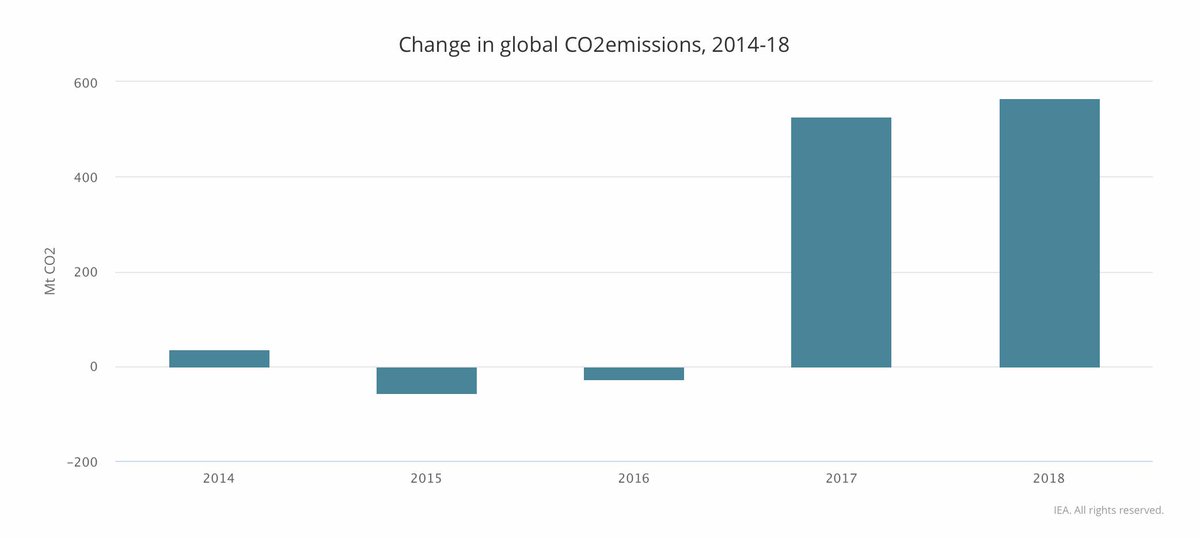
Where we are : energy-related CO2 emissions record high in 2018. Started in 2017 [tool = GECO bit.ly/2IKjFBP]. IEA tries to use the latest data to deliver clear policy messages. Why incease? Growth in energy use, slowdown efficiency increase.

Where we are headed & where we need to go : NPS (New Policies Scenario ['business as usual', ed.] & SDS (Sustainable Development Scenario). SDS includes more than climate goals, also other more ambitious and energy-related elements.

Where we are headed & where we need to go : global transition indicators. Split between supply and demand + split further down by sectors —> what are technologies involved and how do we see them evolving? (= ‘tracking clean energy progress initiative’)

Tracking clean energy progress initiative ('traffic light analysis') : 45 different sectors analysed, looking at investment, technology, ... Only 7 good progress.

Global energy transition indicators, ex: rate of elecricity growth as share of total energy demand, ... Rationale: if to attain SDS scenario, check progress of different indicators. Key reason emission increase = decrased efficiency increase (measured by energy intensity)
Bridging gap from NPS to SDS scenario requires different actions : renewables increase, efficiency increase, nuclear deployment, CCUs, fuel switching and other meaures.

Policy measures to accelerate achievement of NDC —> get analysis down to country-level. Question: what are policy-levers that have most effect in specific countries? Analysis of policies of member states, quick wins.

Conclusions : high-quality statistics are foundation of tracking progress towards climate goals. Combining stats with modelling projections, technology data, and tarnsition indicators : picture of where we need to get to and what to do to get there. IEA data and analysis can help

## Question 1 : What does the SDS scenario contain?
@IEA (Andrew) : It is a well below 2 C scanario, based on IPCC scenarios, for the next 20 years (of course, after 2040 is equally important).
@IEA (Andrew) : It is a well below 2 C scanario, based on IPCC scenarios, for the next 20 years (of course, after 2040 is equally important).
## Q2 (Nao Shi from Japanese GHG Inventory : UNFCCC parties submit, then they are reviewed. Transparency, accuracy, completeness is important. Does IEA has a process like this, and what are the characteristics of this process?
@IEA (Matteo) : IEA is reference but is not... [1/2]
@IEA (Matteo) : IEA is reference but is not... [1/2]
...the official source. Calculation of emissions comes after. What is really important = underlying data. IEA does carry out data validations, and publishes year-2 or year-1 (supply-side) with basic statistical indicators of quality. 20-25 people are working on data validation.
## Q3 : Production of renewable energy does not necessarily lead to consumption of renewable energy [lack of transmission system] How do you take care of this discrepancy?
@IEA (Matteo): Emissions are calculated from the consumption-side. Emissions from power sector... [1/3]
@IEA (Matteo): Emissions are calculated from the consumption-side. Emissions from power sector... [1/3]
...are calculated based on inputs to electricity sector, taking care of transmission losses. There might be differences between consumption and production emissions, but not easy task to calculate.
@GermanEnvAgency : it is indeed not an easy task. [2/3]
@GermanEnvAgency : it is indeed not an easy task. [2/3]
Ed. note: maybe @BoTranberg @corradio @brunolajoie @ThomasGibon @iain_staffell Gorm Bruun Andresen can help out? ;) [3/3]
unroll @threadreaderapp