,
26 tweets,
5 min read
Read on Twitter
1/ We stand at a juncture where about forty years of history support the view that government bonds are a superior asset. A major bear market in bonds has become almost impossible to visualize. But what if we are close to major turning point? $TLT
2/ In November 2018, we explored the question, "Have bond yields peaked?" with our clients. Reviewing past monetary cycles, we observed that the 10-year Treasury yield and the Fed funds rate peaked around the same level.
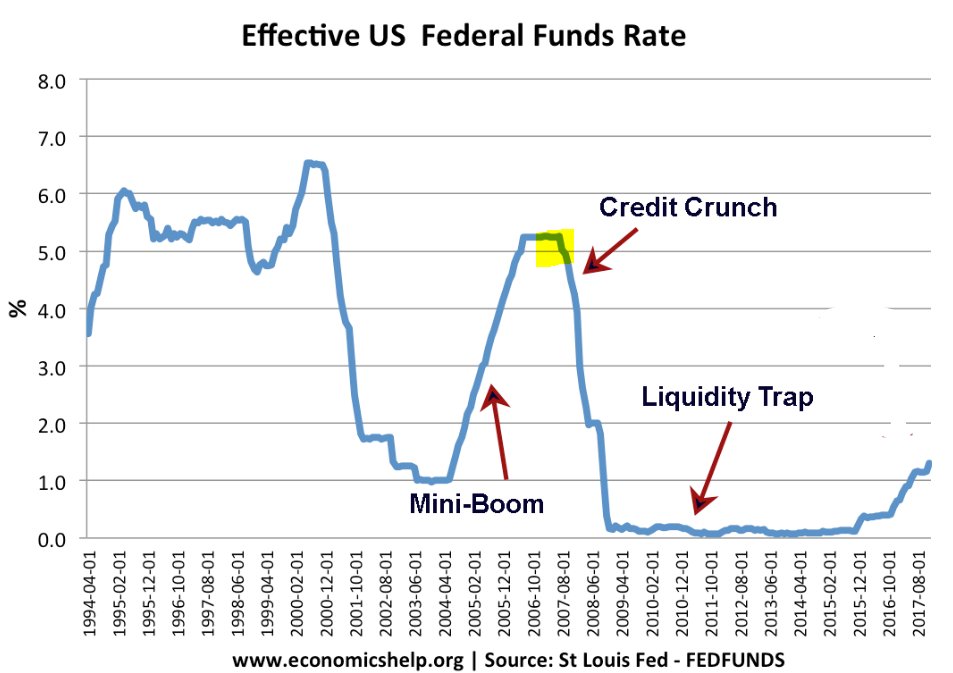
3/ In 1989, the 10-year yield was constrained by the funds rate near 9%. In 2000, the 10-year yield and the funds rate peaked at 6.5%. In 2006, both topped together at around 5%. The exception was in 1994 when bond yields spiked higher in response to the Fed’s shock tightening.
4/ Last year, the projections from the FOMC members indicated that the long-run estimate for the funds rate is 3%. On that basis, we said that, if history holds, bond yields may be very near the peak level for this cycle.
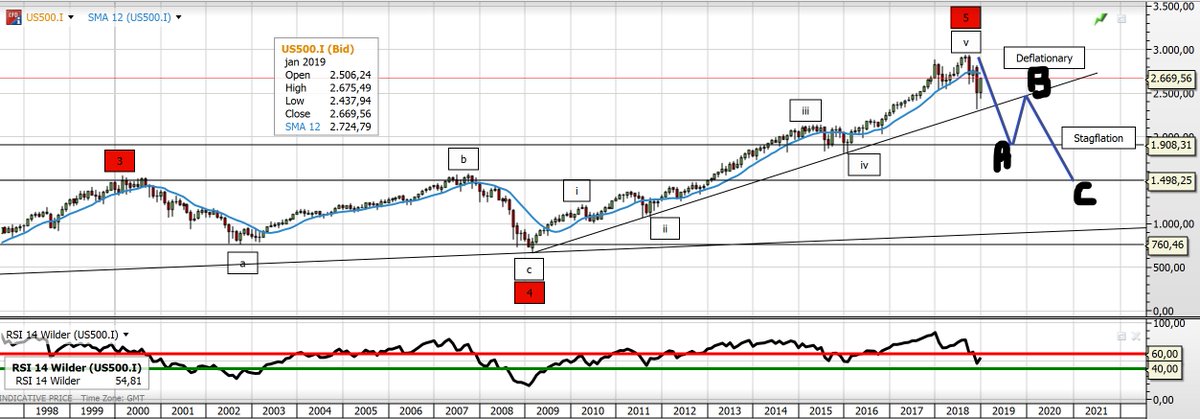
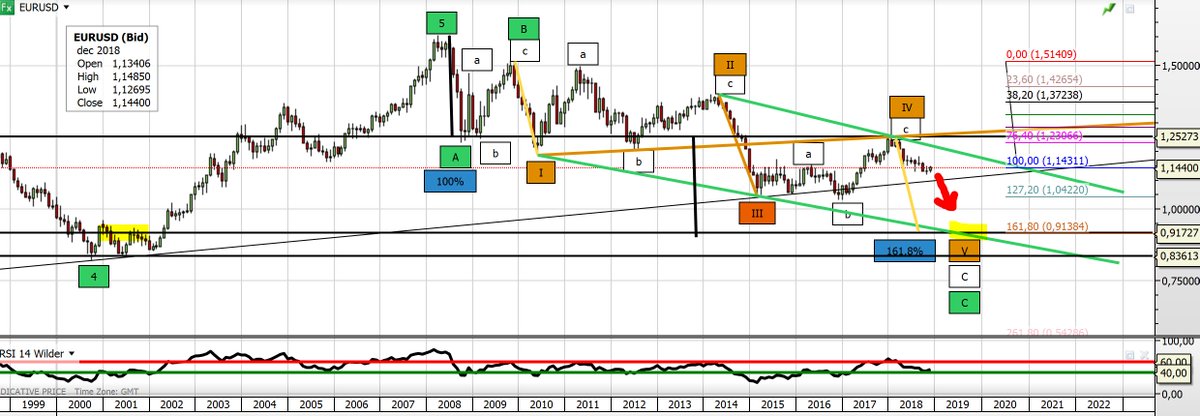
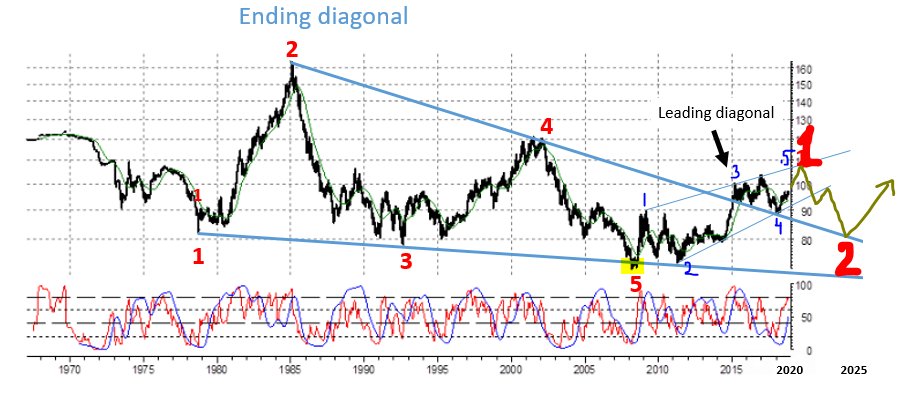
5/ This was counter to conventional wisdom, which at the time said that we have seen a secular breakout in yields. The 10-year yield had broken above the 37-year downtrend line and everyone called for rates to move much higher. We saw a problem with this analysis.
6/ As Benoit Mandelbrot observed long ago, markets mislead: "The power of chance suffices to create spurious patterns and pseudo-cycles that appear predictable and bankable. But a financial market is particularly prone to such statistical mirages."
7/ There have been numerous false breakouts in the 10-year yield over the years. The third point on the trend line connecting the Oct 1987 peak and Oct 1994 peak was 6.6%. But the 10-year yield broke above to 6.8% in Jan 2000 and fell to 4.9% a year later and 3.5% by Jun 2003.
8/ The third point on the trend line connecting the Oct 1994 peak and the Jan 2000 peak was 5%. The 10-year yield jumped to 5.3% in Jun 2007 and then fell to 2% in Dec 2008.
9/ The third point on the trend line connecting the January 2000 peak and the June 2007 peak was 3%. After an initial attempt in May 2018, the 10-year yield broke above to 3.25% in October. It was now at 3.05% as we published our view and called for a "false break." 
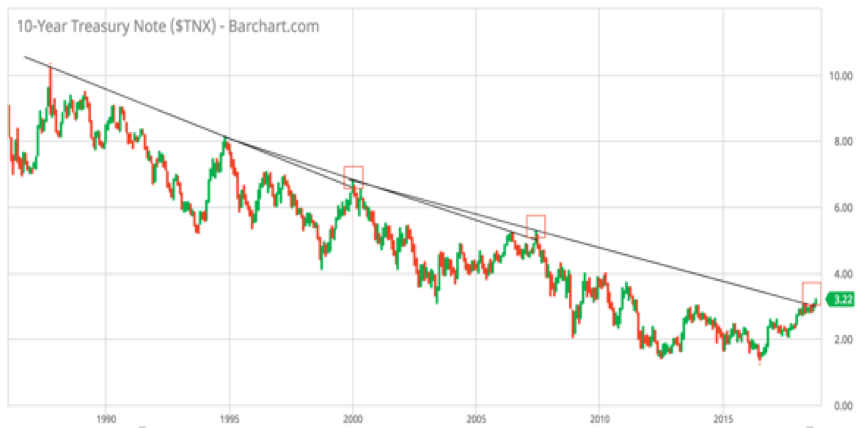

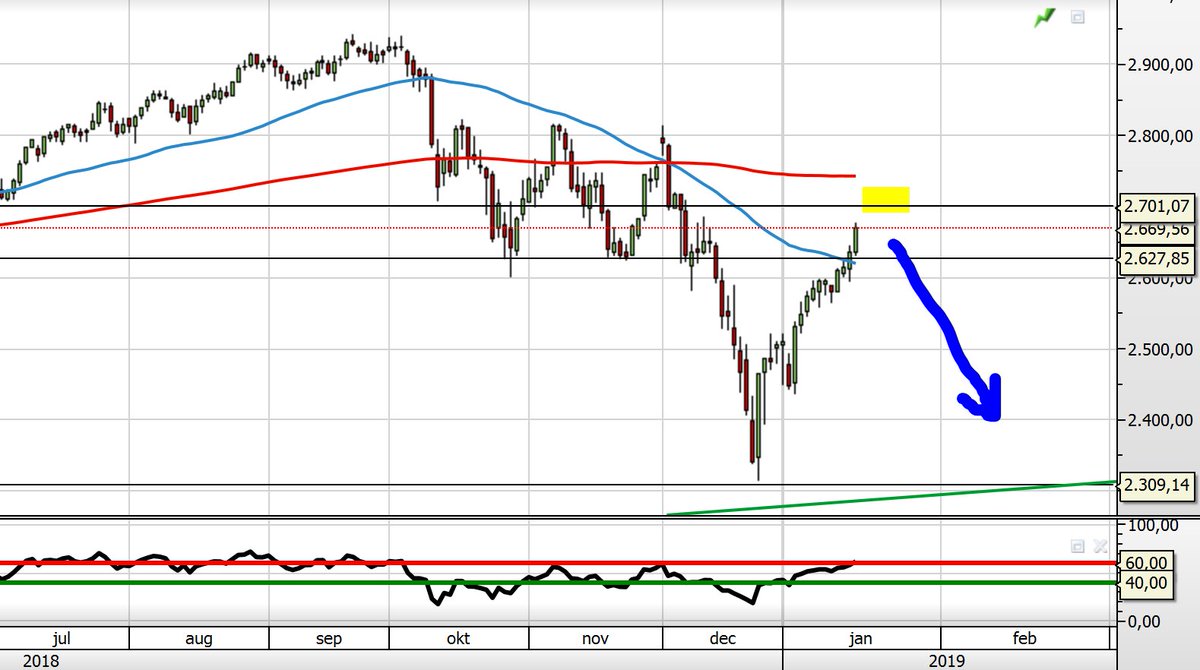
10/ The 10-year fell to 1.43% and the 30-year to a new low at 1.9%. We stopped being bullish bonds when the 10-year hit 2% so we did not expect yields to fall as low as they did in August.
11/ When long-term interest rates fall, negative convexity implies the duration gap between assets and liabilities of insurers and pension funds becomes larger. Any rebalancing entails adding longer-dated bonds so duration of assets catches up with higher duration of liabilities.
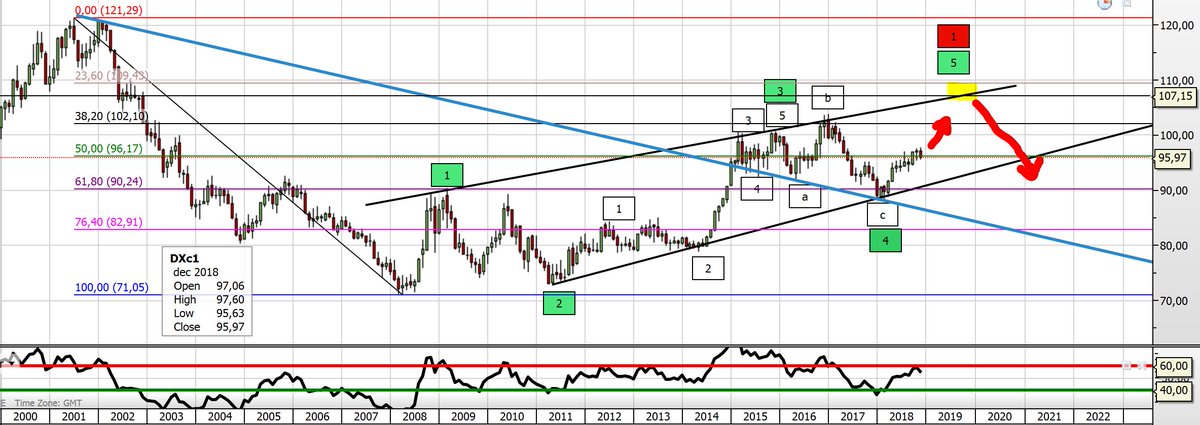
12/ This creates a reflexive feedback loop, declining rates force buying of longer-dated bonds, putting more downward pressure on rates and eliciting yet additional purchases. This is what happened. Duration rose to highest in history—increasing price risk at worst possible time.
13/ Last month, we said that risk for bonds is skewed to the downside. "Bonds are priced for an extraordinarily bearish economic and inflation outcome, which contrasts with a world of higher tariffs, lower labor force growth, and lack of fiscal discipline."
14/ The major dovish shift in monetary policy expectations to address economic risks and boost inflation is already reflected in current yields. Inflation is bottoming and PMIs will soon start to stabilize. Core PCE price index will rise above 2% by early 2020, from 1.6% now.
15/ Even if you hold the dollar and oil prices at current levels, the base effects will by itself push inflation higher from here. US core CPI reading rose 0.3% in August from July and 2.4% from a year earlier, the fastest year-over-year increase since October 2008.
16/ Yet only 1% of fund managers surveyed by Bank of America Merrill Lynch expect higher inflation in the next year, the most bearish inflation outlook in seven years. Inflation is a lagging indicator and investors are ignoring potent inflationary dynamics that are settling in.
17/ It will be difficult for policymakers to maintain their ultra-dovish tone in the fall with growth momentum stabilizing and inflation rising. This could lead to a major mindset change in the bond market. Bonds are pricing in a recession and several rate cuts that are unlikely.
18/ Investors continue to underrate the resilience of the US recovery. Expansions often end when monetary tightening is excessive, financial imbalances pose a high risk, or the economy runs out of slack. Neither is currently observable in the US.
19/ There is evidence to suggest weakness of ISM manufacturing index may be linked to poor equity market performance rather than an economic calamity. Major changes in equity prices have often been accompanied by the ISM index over- or understating actual output growth.
20/ The ISM manufacturing index hovered above 57 every month of 2018 before dipping lower in December, which was the worst December for stocks since the Great Depression. The S&P 500 tumbled 14% in Q4, which influences business reporting.
21/ The ISM survey panel is also in some ways biased towards manufacturing companies with strong exposure to capital spending by the energy sector. That explains the strong correlation between oil prices and ISM data. Crude oil prices plunged by 40% in Q4 to $45.
22/ The global policy pivot, rising stock market momentum, and higher oil prices should be reflected in better survey values in the coming months. Six of the previous 11 times the ISM manufacturing index fell below 50 since the early 1970s, a recession did not soon follow.
23/ Though the global economy is on a weaker footing, the IMF projects a 3.2% growth rate in 2019 and 3.5% next year. From 1988 to 2007, the 20 years before the Great Recession, the average annual growth of the world economy was 3.6%.
24/ In the comedy show Patriot Act, an audience member asked host Hasan Minhaj, “Will the looming recession be worse than the last?” When a major Netflix show predicts “impending doom,” the panic is probably overdone.
25/ Even though valuation is not a reliable predictor of the near-term direction of bond yields, the real yield in the US is 1.5 standard deviations below its historical average. Fund managers are the most bullish bonds since November 2008.
26/ Global government bond yields are in a secular bottoming process that will last many years. Within this long-term base building phase, we see yields rising for the rest of 2019 and into 2020. The most important things show themselves slowly, and in their own time.