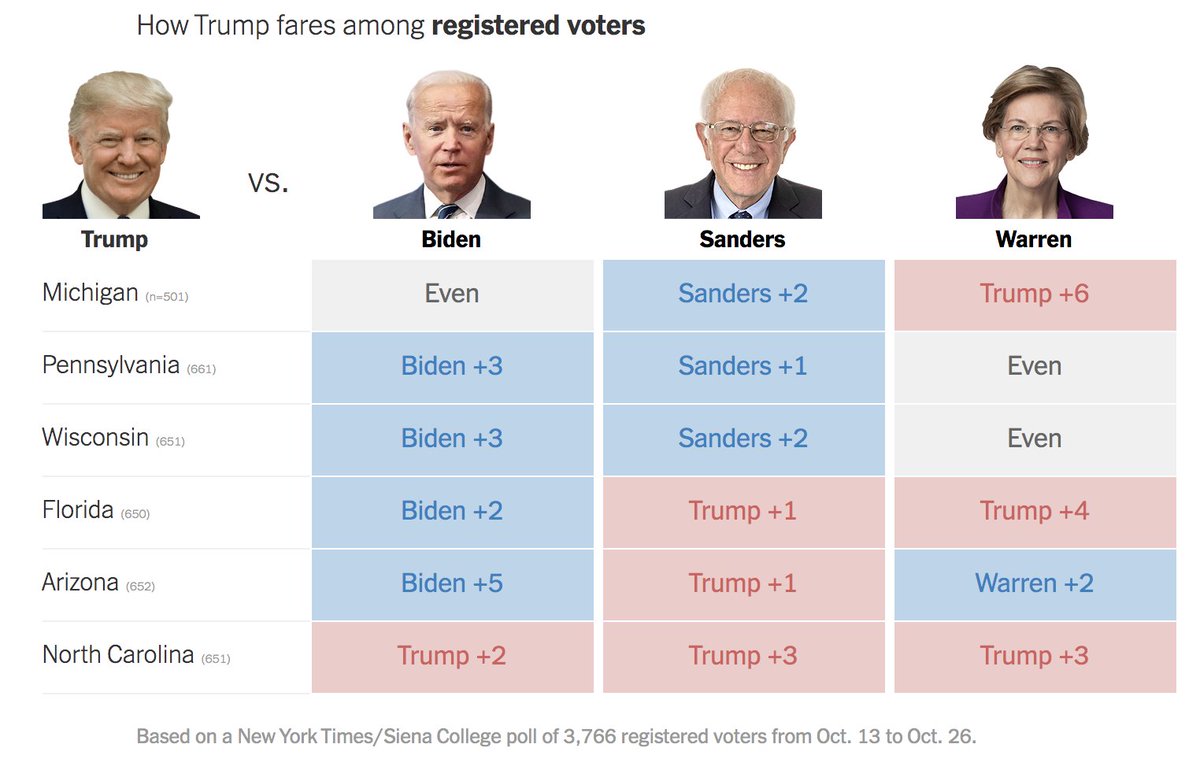
New Times/Siena polls show Trump highly competitive in the six closest states carried by the president in '16:
Biden+2, Biden 46 to Trump 45
Even, Sanders 45, Trump 45
Trump+2, Trump 46, Warren 44
2016 result in these states was Trump+2, 48 to 46
nytimes.com/2019/11/04/ups…
Biden+2, Biden 46 to Trump 45
Even, Sanders 45, Trump 45
Trump+2, Trump 46, Warren 44
2016 result in these states was Trump+2, 48 to 46
nytimes.com/2019/11/04/ups…
Crosstabs and methodology here.
Unlike most state polls, we're weighted by education
Unlike most national polls, we're weighted (and stratified for that matter) on party registration, so we have the right number of reg Dems/reg GOP in each state
github.com/ndcohn/battleg…
Unlike most state polls, we're weighted by education
Unlike most national polls, we're weighted (and stratified for that matter) on party registration, so we have the right number of reg Dems/reg GOP in each state
github.com/ndcohn/battleg…
The main difference between our polls and recent national polls, to me, stems from two things.
1) The EC-battleground gap, which was 4 points in '16 and could easily grow in '20, esp among RVs. This is basically what we thought the result should look like, back in July
1) The EC-battleground gap, which was 4 points in '16 and could easily grow in '20, esp among RVs. This is basically what we thought the result should look like, back in July

2) Unlike national polls, we should Trump holding up with white, working class voters.
Take the Fox poll v. Biden yesterday :
White, no degree. Fox: 37/50, Upshot: 34/58
White, college. Fox: 50/42, Upshot: 50/41
Hispanic. Fox: 60/28, Upshot: 63/29
Black. Fox: 89/6, Upshot: 82/8
Take the Fox poll v. Biden yesterday :
White, no degree. Fox: 37/50, Upshot: 34/58
White, college. Fox: 50/42, Upshot: 50/41
Hispanic. Fox: 60/28, Upshot: 63/29
Black. Fox: 89/6, Upshot: 82/8
Obviously, white working class voters are a group pollsters have struggled with in recent years, especially in state polls. We also do a lot that can help us here that others don't, like strata on party x region, weighting on education, and response rate adjustment on turnout
I don't think this is simple about name recognition. In Iowa, where the campaign is well underway and Warren led among Iowa caucus-goers:
Trump+1, Trump 45, Biden 44
Trump+3, Trump 47, Sanders 44
Trump+4, Trump 45, Buttigieg 41
Trump +6, Trump 47, Warren 40
Trump+1, Trump 45, Biden 44
Trump+3, Trump 47, Sanders 44
Trump+4, Trump 45, Buttigieg 41
Trump +6, Trump 47, Warren 40
I should note that this is methodologically identical to our live polling from last fall
But Michigan was a real struggle. We cut our responses there to 500 (v 650 elsewhere), due to bad productivity. High design effect required weight changes. All described in method page.
But Michigan was a real struggle. We cut our responses there to 500 (v 650 elsewhere), due to bad productivity. High design effect required weight changes. All described in method page.
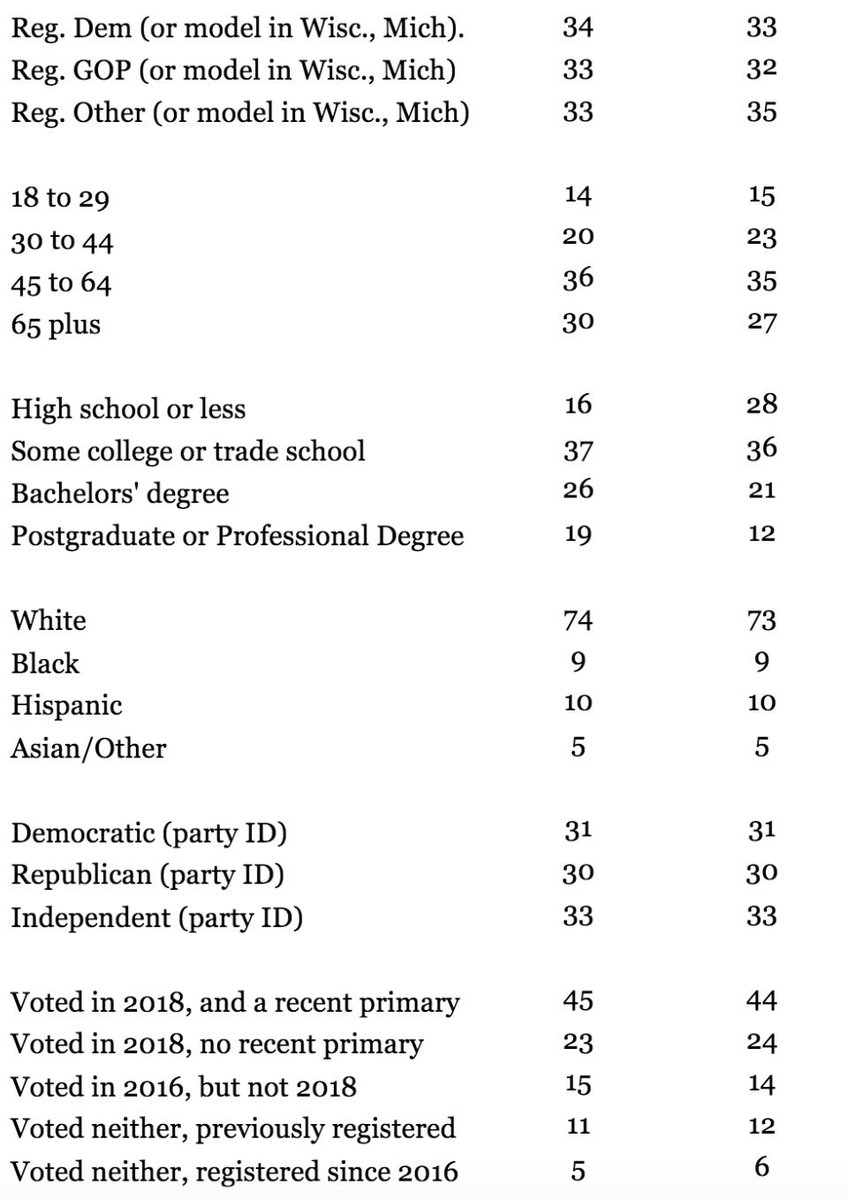
That said, collective sample here is N=3766 and more than 5000 if you count Iowa. The picture, I think, is very clear over all and it's not really subject to the margin of error. Our sample was quite clear, as well (left column = unweighted; right = weighted)
Instead, we find the president continuing to excel among white voters without a degree, and coming close to his '16 margins there.
The Trump voters who supported Democrats in the midterms say they'll back Trump by 2-1 margins
Trump leads all in Obama-Trump counties, precincts
The Trump voters who supported Democrats in the midterms say they'll back Trump by 2-1 margins
Trump leads all in Obama-Trump counties, precincts
We also find that a crucial sliver of the electorate has real reservations about Warren, in part due to ideology but gender as well.
68% of voters who back Biden but not Warren *either* say she's too far to the left, or say the women who run for president just aren't "likable"
68% of voters who back Biden but not Warren *either* say she's too far to the left, or say the women who run for president just aren't "likable"
My colleague @clairecm talked to some of those voters and I think their quotes are rather telling. Worth actually reading the article for some of this. One young, FL women called the women running for president "super unlikable"
@clairecm (I deleted a previous version of the tweet that offered a 'lol' at the respondent's use of 'super,' which was both unfair to the respondent and made it sound like i was making light of her views. my bad)
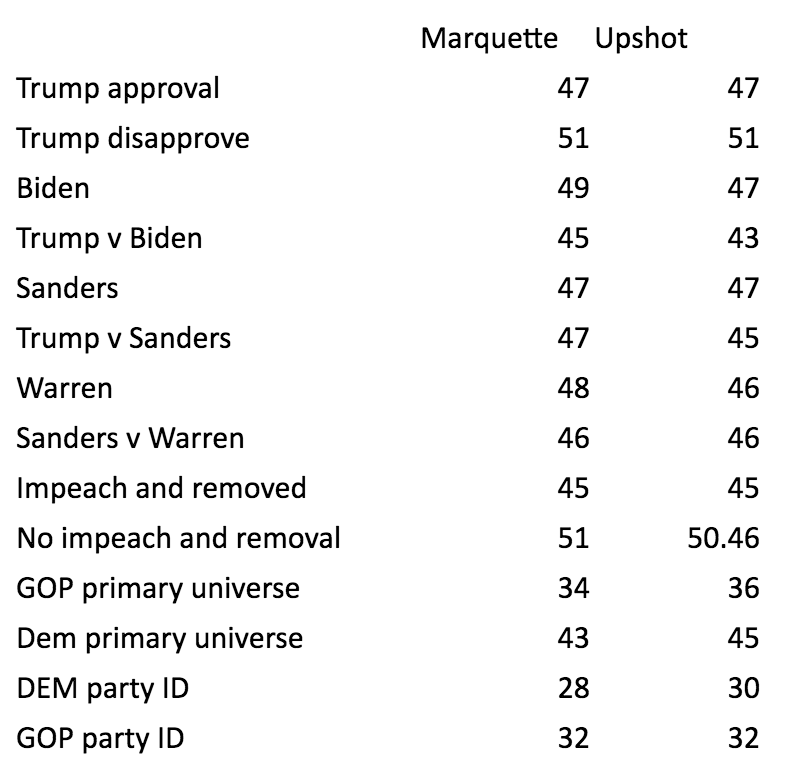
The similarities between our results and our compilation of polls from 2016 is also quite striking

And one final note of possible importance: we wrote this survey like we would in Nov. 2020: horse race questions went first.
IDK how much it matters. But like in some of the national polls, the horse race is Q40 after a bunch on impeachment and so on. Could be a factor?
IDK how much it matters. But like in some of the national polls, the horse race is Q40 after a bunch on impeachment and so on. Could be a factor?
Another slight difference is that our poll doesn't include people who aren't registered to vote, but say they will. When you take those still unregistered voters out of the Marquette poll, our results (already close) snap into alignment (thanks @PollsAndVotes for the cut)
@PollsAndVotes And if we had not weighted by party/education, like most of the you've seen, our results would have been:
Biden+5
Sanders+3
Warren+1
(I should note that we stratify our sample on party reg x region, which would tend to diminish the importance of weighting on party)
Biden+5
Sanders+3
Warren+1
(I should note that we stratify our sample on party reg x region, which would tend to diminish the importance of weighting on party)
@PollsAndVotes (IE: in FL, our respondents are 37% dem, 35% rep by registration, since that's the state tally; it is possible that if we just collected sample without stratification, like most polls, the underlying sample may have been more D/R in unknown ways)
@PollsAndVotes (this is knowable btw, but i do not know off hand whether dem or rep response rates were higher or lower in our polls)