theprint.in/national-inter…
The latter is usually called downstream industry, but the new name serves a better purpose in our quest to understanding the modern economy.
UPSTREAM INDUSTRY
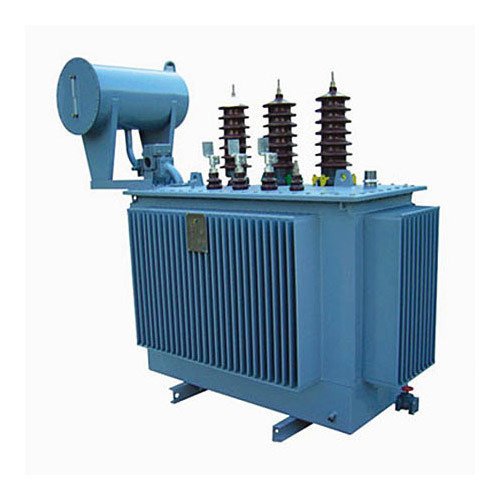
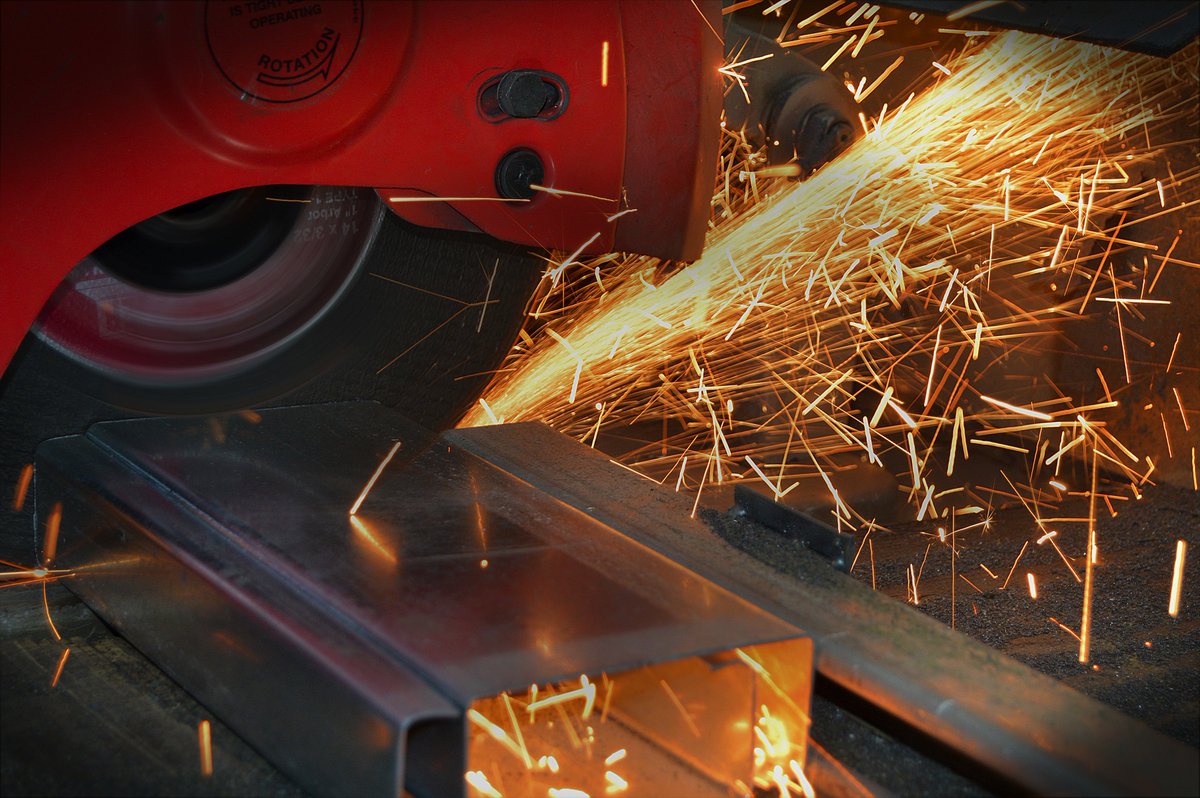
Manufacturing Assets : industrial ovens, furnaces, burners, etc.
Output: metal sheets, rods, bearings, etc.
.
.
.
FINAL GOODS HEAVY INDUSTRY
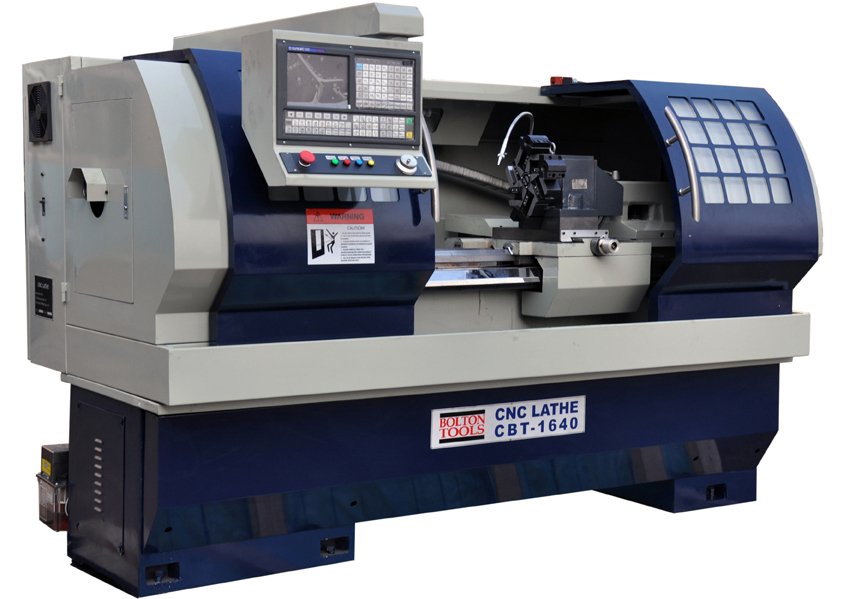
Assets: machine tools, lifting equipment
Output: airplanes, ACs, motors, trains, machine tools, etc.
Why are they grouped under a whole different class of activity separate from traditional economic activities?
Faraday’s Induction law, or
Thermodynamic laws, or
The Law of conservation of energy
as scientific principles at the core of their design and operation
But who utilizes that output (machine tools, cars, trucks, motors, engines, ships, tankers, planes) of final goods heavy industry?
Final goods heavy industry products are machines designed to power & run things, move & build things, pick & harvest things, make & work things, equip & service things, etc.
1) Power generation & transmission machinery
2) Prime mover machinery
3) Construction & mining machinery
4) Farm & forestry machinery
5) Food manufacture machinery
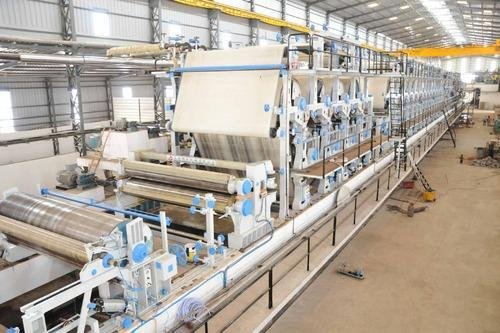
6) Paper & printing machinery
.
.
7) Textile & apparel manufacturing machinery
8) Final goods heavy industry manufacturing machinery (such as Lathe, drilling, milling, boring machines)
9) Other machinery
1) Electronics
2) Electro-mechanical appliances (Washing machine, AC, Refrigerator etc.)
3) Railways
4) Vehicles
5) Airplanes
6) Ships & boats
7) Optical and precision instruments (healthcare, film)
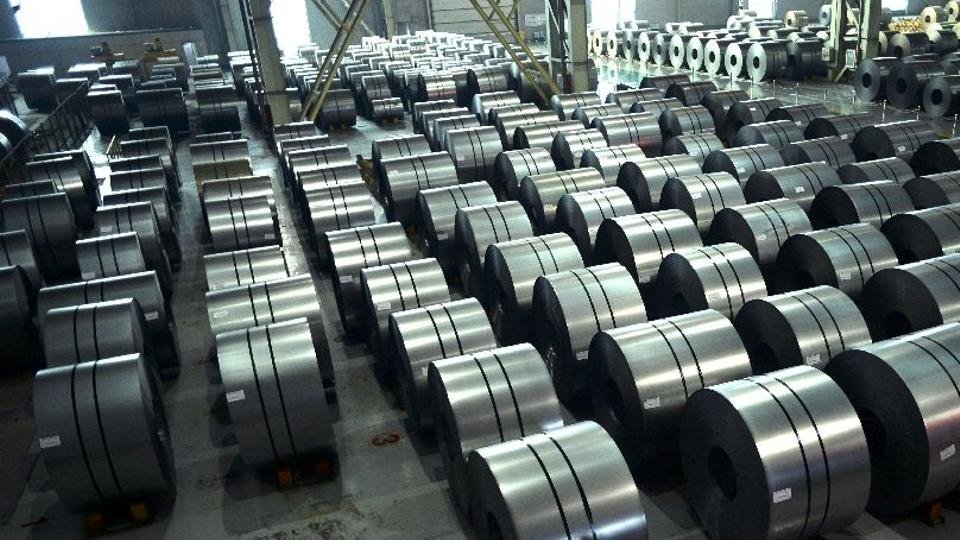
Who purchases, & utilizes the output of final goods heavy industry?
Also,
Food manufacture machinery serves ---> Light manufacturing industry
Final goods heavy industry manufacturing machinery serves ---> All Final goods heavy industries
Machinery includes
Lathe,
Drilling machine,
Milling machine,
Shaping, planing, slotting machine,
Boring machine,
Broaching machine
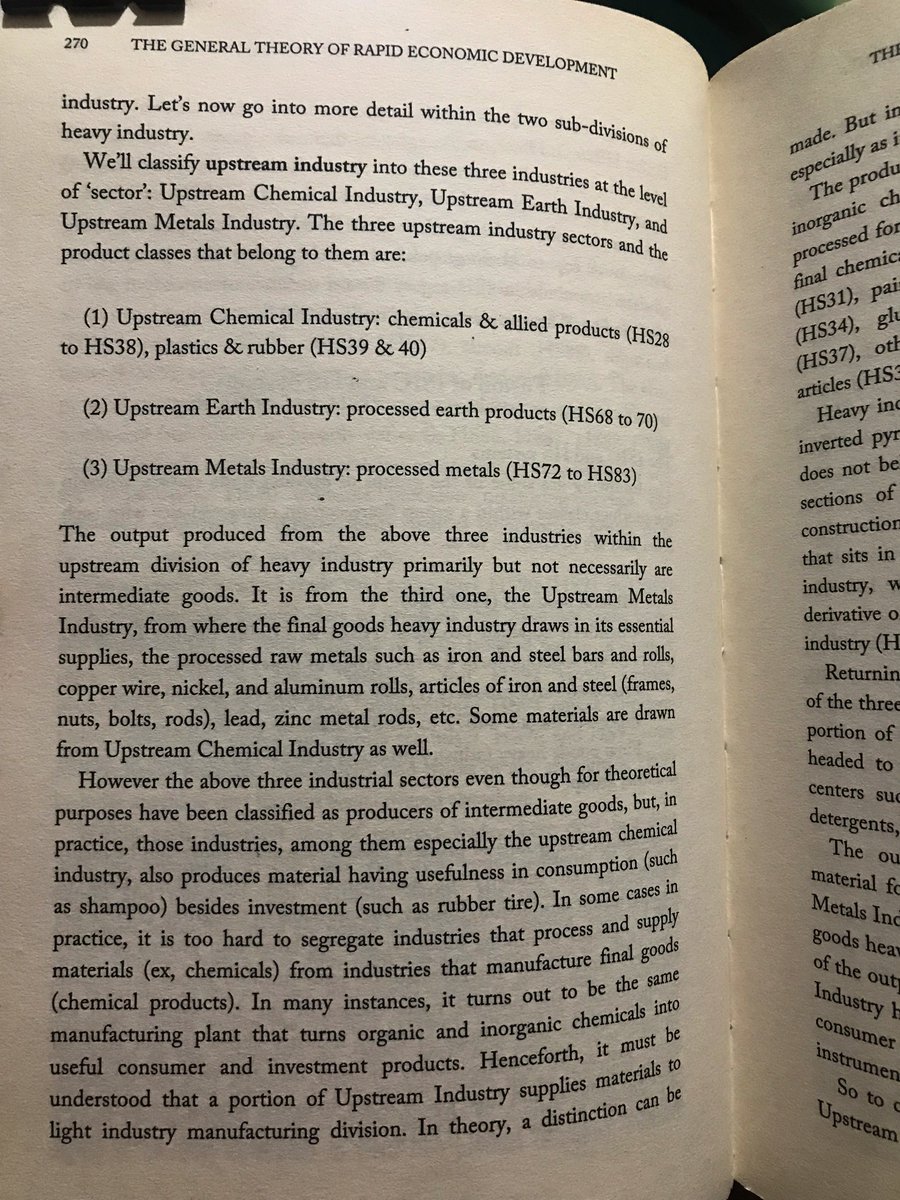
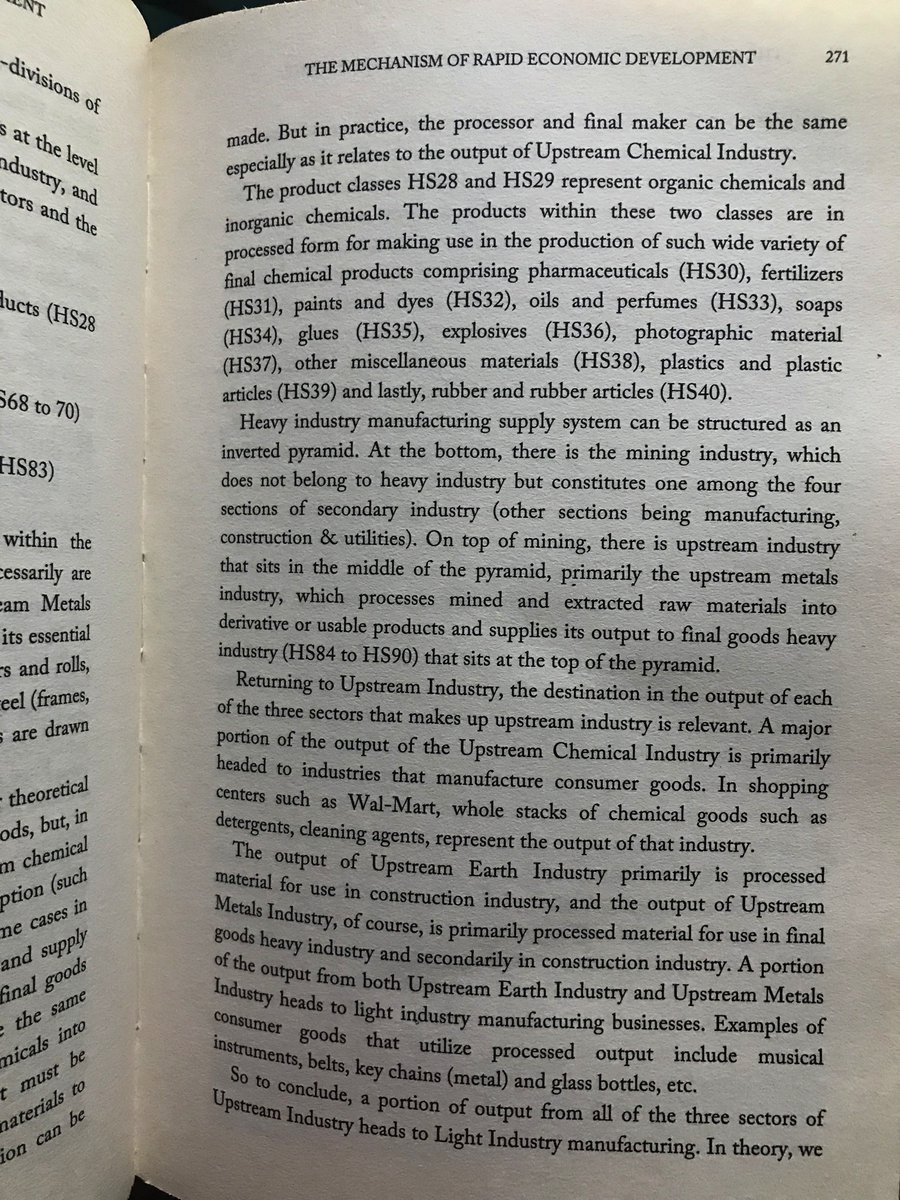
1. UPSTREAM CHEMICAL INDUSTRY: chemicals, allied products
2. UPSTREAM EARTH INDUSTRY: processed earth products
3. UPSTREAM METAL INDUSTRY: processed metals
#EconomicDevelopment #India #IndianEconomy #Growth
DISCOVERY: of a material (ex. aluminum by Hans Christian Ørsted), or a process (steel-making by Bessemer process)
INVENTION: of a machine (internal combustion engine by Karl Benz)
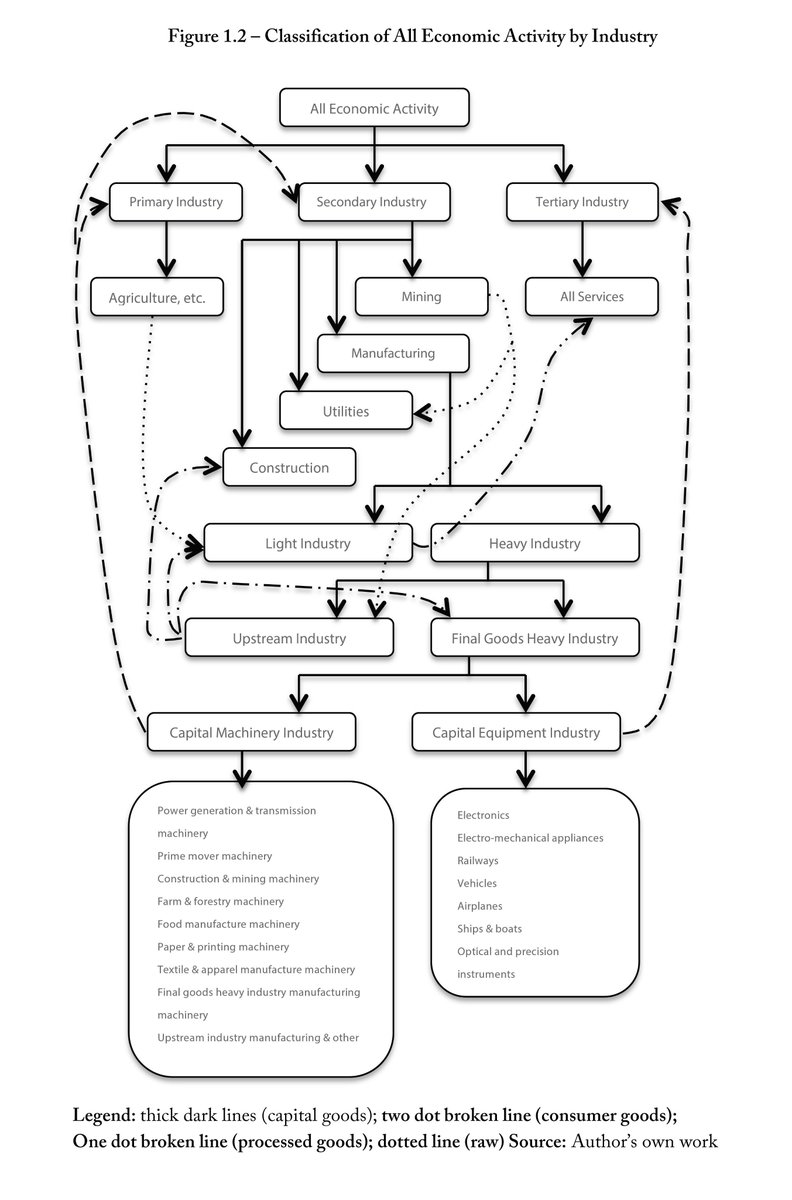
I have waited till now to introduce to you the FLOWCHART-01 that shows the same. Download to zoom in.
Industrialization is the process of building HEAVY INDUSTRIAL ACTIVITIES—both, UPSTREAM INDUSTRY & FINAL GOODS HEAVY INDUSTRY—from scratch.
Modernization is the development of already existing TRADITIONAL ECONOMIC ACTIVITIES using resources from HEAVY INDUSTRY.
Below, earlier we saw that much of Global wealth is held by industrialized nations.
1. FINAL GOODS HEAVY INDUSTRY
2. CONSTRUCTION INDUSTRY
with the support of UPSTREAM INDUSTRY.
In terms of existence & operation, all three rely on each other...
*Land being a gift of nature is available freely. Barren land when developed for economic activity turns into physical capital.
*Durable goods: a segment of FINAL GOODS HEAVY INDUSTRY output that found utility in residences besides the business setting.
But we are interested in a particular line of classification of WEALTH that allows us to study industrialization & modernization.
National capital, for our purposes, is classified into these four types:
1) Housing capital,
2) Public infrastructure capital,
3) Non-Industrial business capital, &
4) Heavy industry business capital
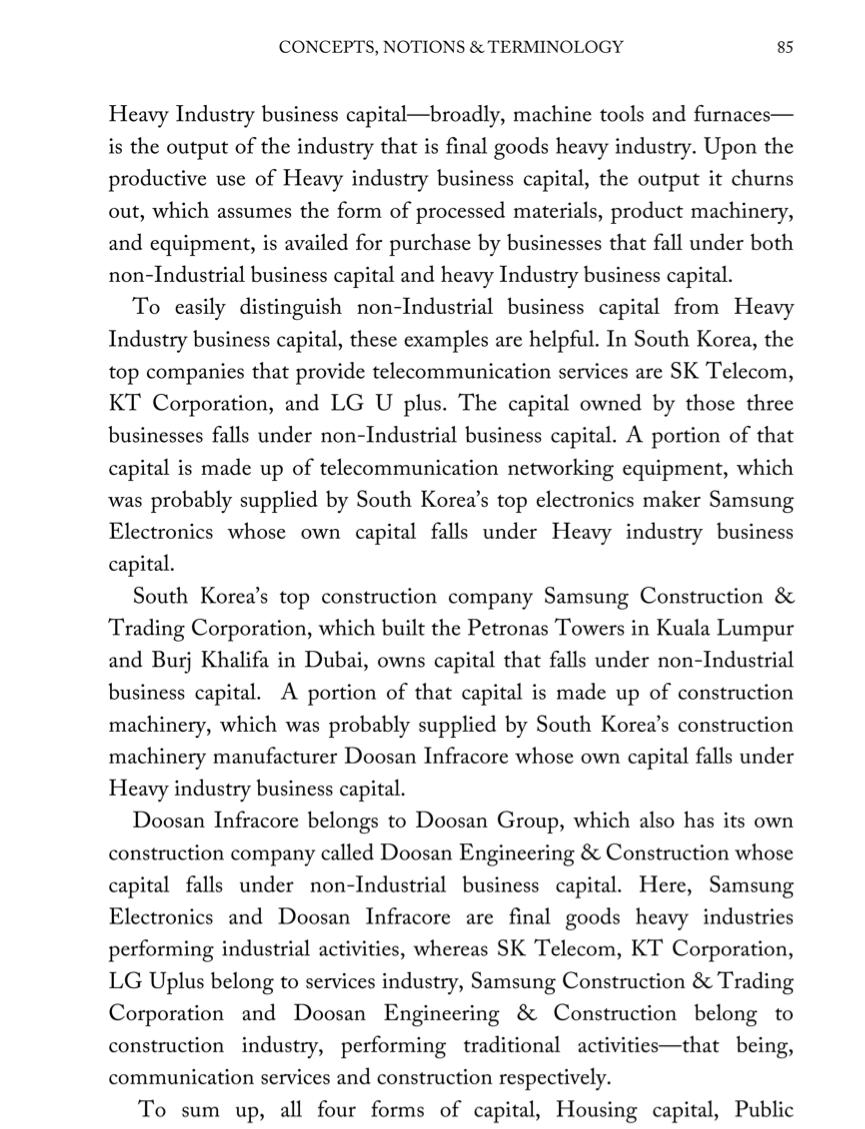
But it is to the last two—Non-Industrial business capital, & Heavy industry business capital—we turn our focus.
#CAPITAL
No surprise there! Their understanding of the real world is abysmal.
EXHIBIT A,
With our understanding so far we'll see how the Chicago economist #RAGHURAMRAJAN has gotten wrong on this case in point and so much else that may come up later, revealing his false understanding of the real world.
#RBI @RBI
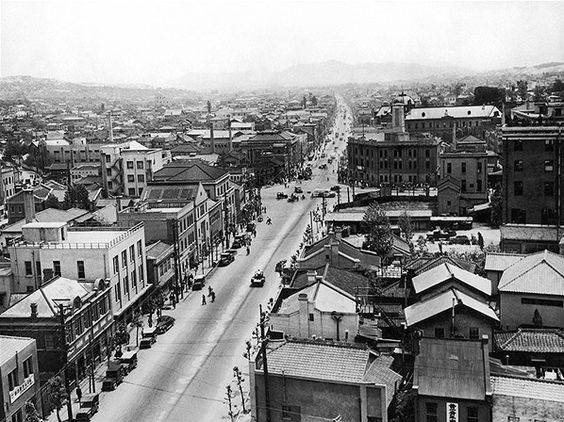
He argues how export-dependent nations such as Japan, Germany, China burdened the World economy in the lead up to Financial Crisis.

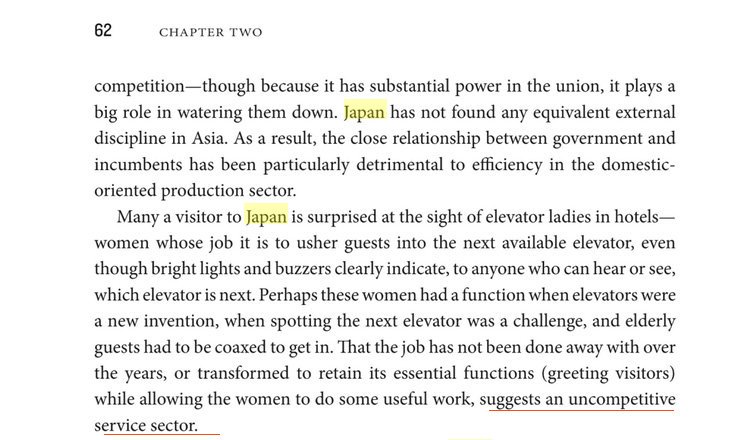
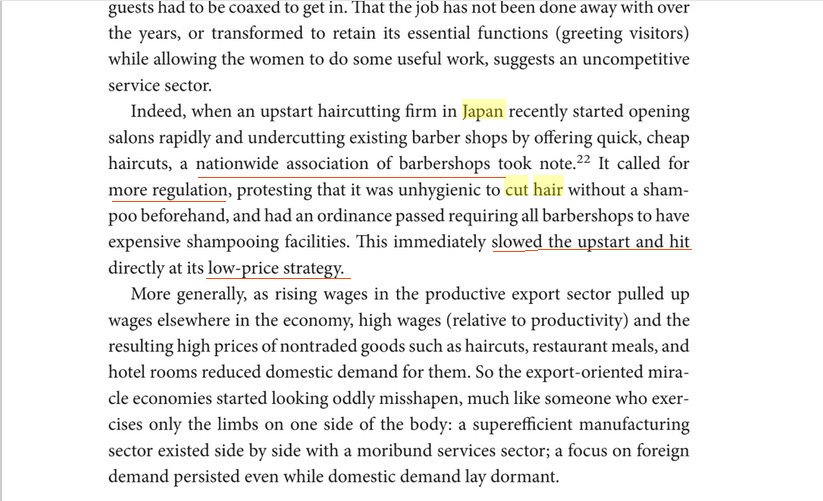
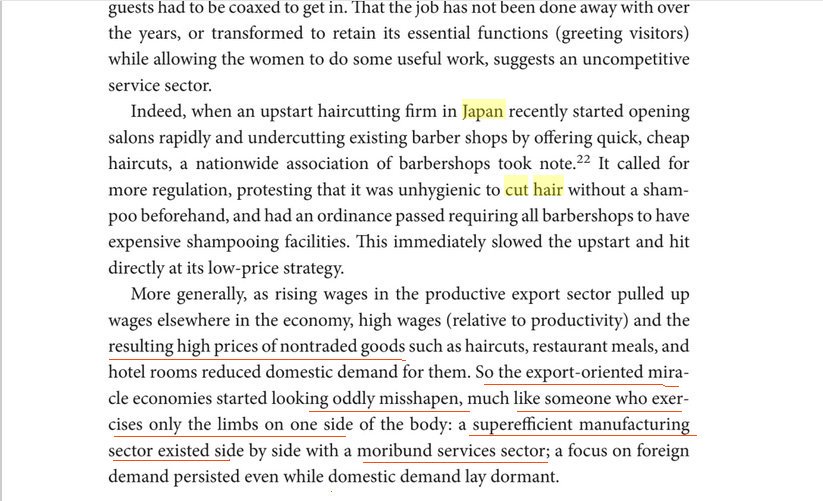
We know that heavy industry manufacturing, a product of Industrial Revolution, exists to supply machines & material to all the industries of the economy including the services industry (which includes salons, hospitality, etc.)
Traditional economic activities, which include services, were done poorly for thousands of years (imagine engine-less vehicle for transportation, or a world in which there is no lift severely restricting the size of a hotel & thereby the economies of scale of operation).


HOW CAN THAT BE ? - As I put it before! 😉
High prices could be for any of these reasons:
- Japan's declining share of young/working population (as services require lot of people, especially in non-professional activities)
-Labor laws against easy termination
- Higher quality delivery of service, justifying higher prices (think of a product—such as laptops/phones in the market sold at many price points).
- services industry (like the salon ex.) associations being able to lobby the govt. to alter fair competition landscape
- varying tax rates re sales, business income, etc.
-distorted business entry, exit, zoning laws, etc.
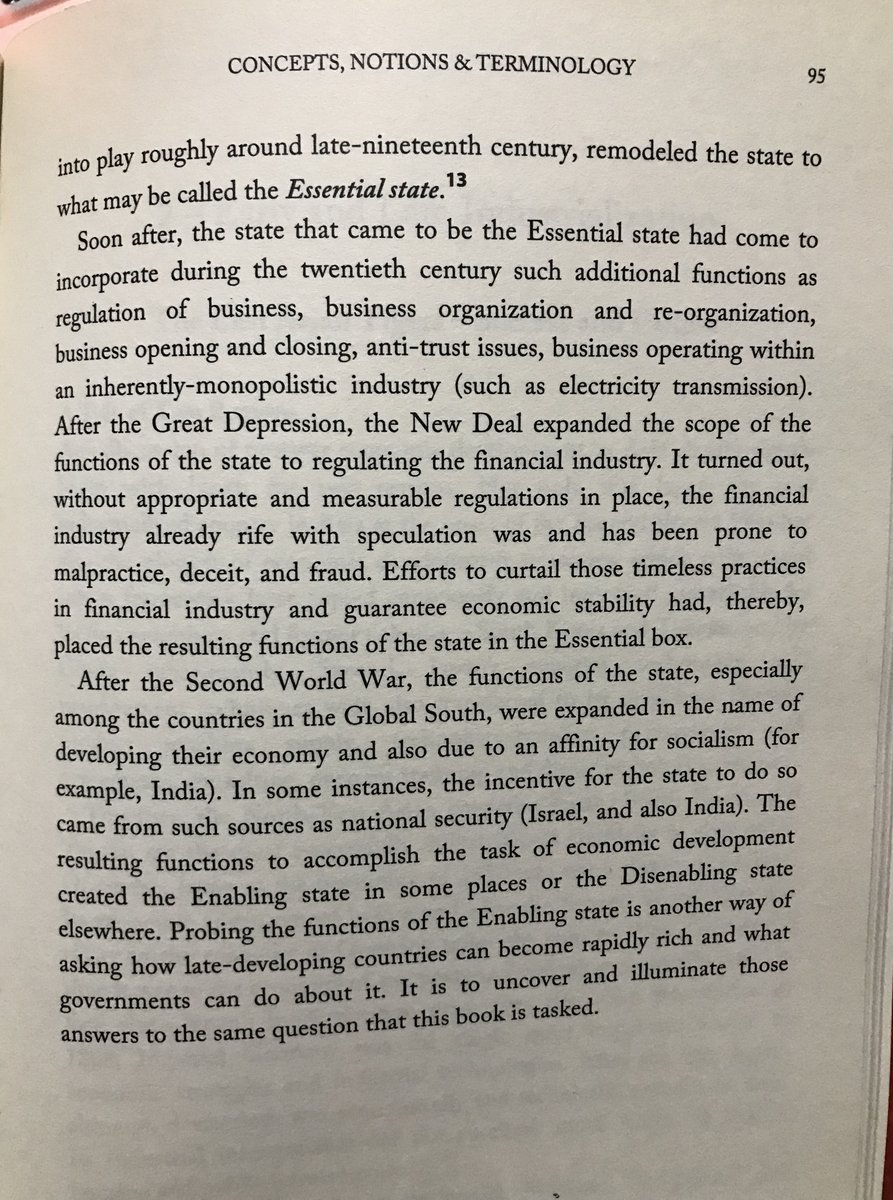
The above three fall under essential functions of govt. concerning the economy.
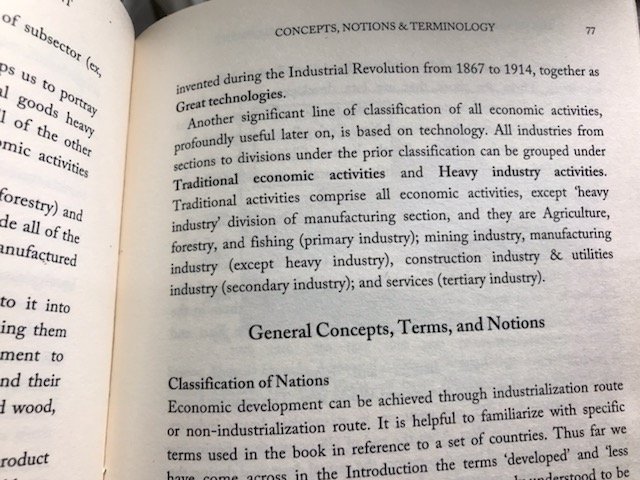
Read below (pic extracted from THE GENERAL THEORY OF RAPID ECONOMIC DEVELOPMENT book)

As an academic, RAJAN personally is very much biased against a particular growth strategy, i.e. the so-called export-based growth model, they say, JAPAN & others followed to develop & become wealthy.
You can watch him explain this in this video (set to auto play).
We know those activities result in the production of products & services for sale—both CAPITAL GOODS & CONSUMER GOODS.
But there are other GOODS available in the market for sale
Thereby, we can classify all markets visible in the economy of a country into these two: (more on these two terms next)
1. ASSET MARKETS
2. ECONOMIC GOODS MARKETS
ECONOMIC GOODS MARKETS:
On any given day, ECONOMIC GOODS MARKETS are those which sell—for first hand purchase—the brand new products & services produced by ALL ECONOMIC ACTIVITIES during the CURRENT YEAR.
NEW cars, houses, cranes, cosmetics, airplanes, etc.
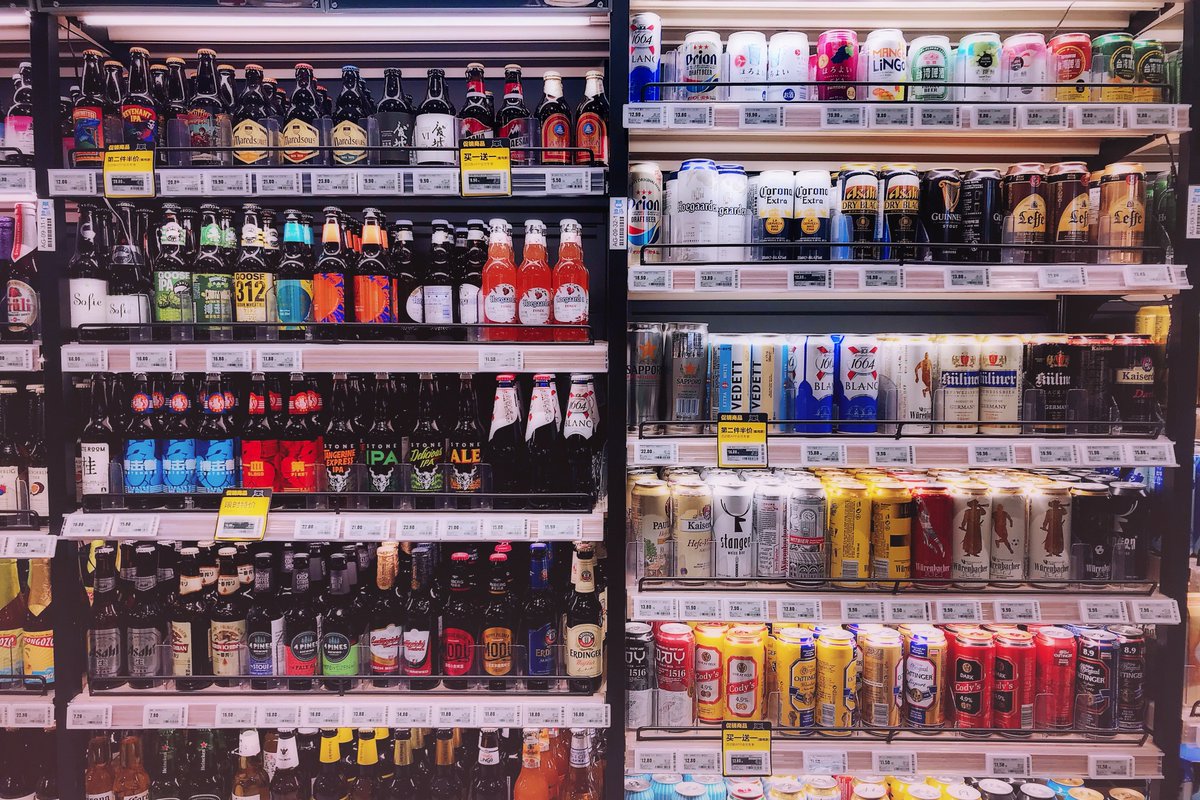


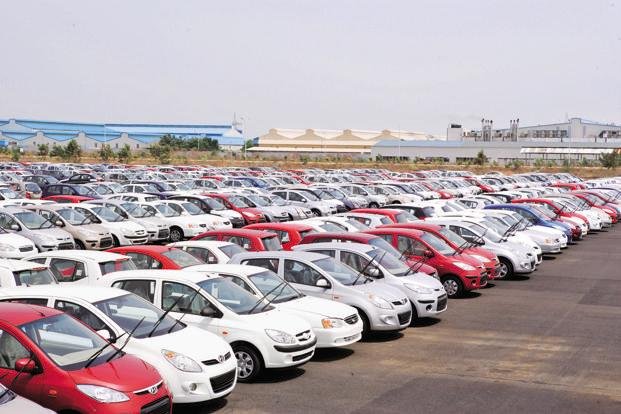
ASSET MARKETS:
On any given day, ASSET MARKETS are those which sell—for second hand or higher hand purchase—all the CAPITAL GOODS produced by ALL ECONOMIC ACTIVITIES since time immemorial, including CAPITAL GOODS produced in current year but not brand new anymore...
Ex.
- A house built in the 1970s but now on sale
- shares of businesses which hold all business assets incl. all machines & buildings
- a tractor that is produced & purchased this present year but now put on market for second hand buyers.


Simply,
Economic goods market transaction relates to items on the income statements of the parties, whereas asset market transaction relates to items on the balance sheet of the parties.
The distinction between the above two markets—economic goods & assets—is vital...
...because even the economists from 18th century to the present times display WILFUL IGNORANCE when it comes capital, assets, its markets, its effects on Growth, GDP, National Income of current fiscal year, etc., thereby conjuring up absurd theories & baseless arguments.
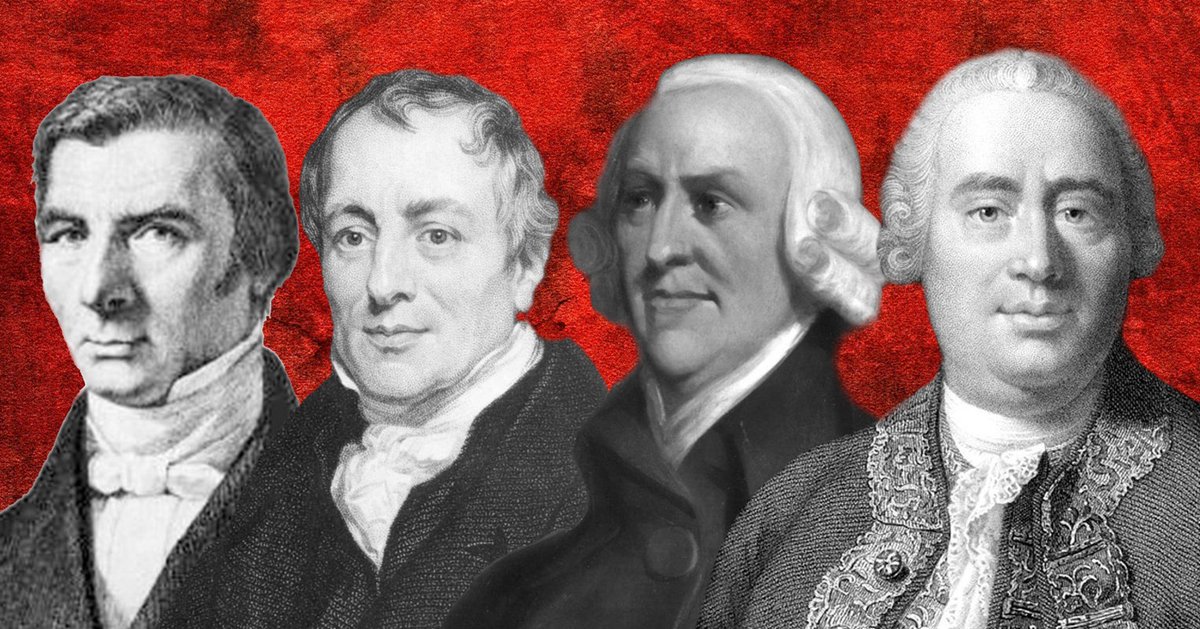
THEIR WILFUL IGNORANCE is like a blindfold to their eyes, rendering them ineffective in understanding & figuring what exactly is the GOAL, the PROBLEM, thereby the SOLUTION, to economic development of a nation.
That brings us to the nexus of economic development!!
WHAT IS THE GOAL HERE?
(some more bashing of economists)
The blindfolded economists continue to think annual GDP GROWTH is the best indicator of economic development.
Like everything else, they are fully WRONG.
NOPE, not THEM

ANYWAY,
Here it goes,
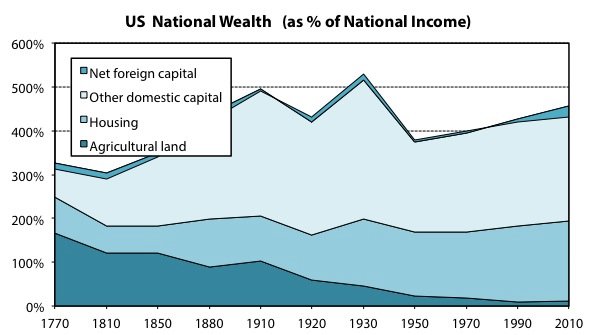
the BEST indicator of economic development of a nation is not GDP growth but how much STOCK of CAPITAL it has accumulated thus far of these 👇
Note: classification of wealth shown below is based on the feasibility of collecting, assessing wealth data
Our preferred type of classification remains the one seen in tweet 134.
Data Source: Piketty & Zucman, 2013
At the end of 2018, total wealth of
Singapore = USD 1.29 trillion
whereas,
India = USD 5.97 trillion.
Let's look at wealth per adult,
Singapore = USD 283,118
whereas,
India = USD 7,024 (app. 5L)
Wealth per adult seems to work but it is inadequate.
It is TOTAL WEALTH per TOTAL NATIONAL INCOME, or, WEALTH to INCOME ratio that best captures all metrics including both pop. growth & per capita income growth.

That is, we are measuring wealth of a country in terms of how many TIMES the stock of Wealth is at the end of a year relative to the country's national income of the year.
India, a lower middle income country, has USD 5.972 trillion NET WEALTH at the end of 2018.
India totaled app. USD 2.499 trillion NATIONAL INCOME during 2018.
CAPTIAL-INCOME of India ratio = 5.97 / 2.47 = 2.38
or,
India's CAPITAL STOCK is 238% of its national income
SOURCE for latest wealth & income numbers for both India & Singapore: Credit Suisse Wealth Databook 2018.
