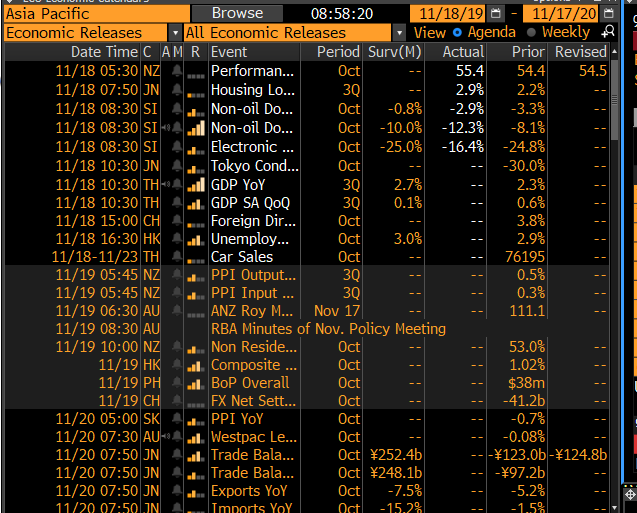
Morning🦀! Light Asian data day ex for RBA minutes in 15mins. Tomorrow is more key as eyes are on China's 1 & 5yr loan prime rate & markets expect no change of 4.2% & 4.85% but some hoping for 5bps cut.
But the most exciting thing today is obvs release of foreign ownership of US
But the most exciting thing today is obvs release of foreign ownership of US

Let's follow the money 💰🤑💸💲 - foreigners mostly SOLD USTs & especially T-bonds & notes & not so much treasury bills.
How much? 84.3bn (note this is stock data so valuation impact etc)
Bigger holder is Japan & it sold! China sold too but marginally.
How much? 84.3bn (note this is stock data so valuation impact etc)
Bigger holder is Japan & it sold! China sold too but marginally.

Want to see the net selling of UST in a yield curve chart? Of course u do!!! Massive changes to the curve since 1 Sept 19.
The Fed cut rates by 50bps to 1.75% from 2.25% (look at the short-end moving down); OK, what about the longer end? Trade-deal hope & less recession fear👇🏻
The Fed cut rates by 50bps to 1.75% from 2.25% (look at the short-end moving down); OK, what about the longer end? Trade-deal hope & less recession fear👇🏻

B/c of rate cuts (50bps) The yield curve went from being inverted (Nike sign) to upward sloping as the short-end moved down. What is interesting is obvs the shift of the belly & upper end of the curve.
That's a big shift & so in the bond world, they call it the BOND SELL-OFF 👇🏻
That's a big shift & so in the bond world, they call it the BOND SELL-OFF 👇🏻


For the longest time, people were obsessed w/ what the inverted yield curve means for the economy (recession imminent etc). Well, w/ the Fed cutting rates by 75bps , they are taking an "insurance" against a recession so to speak.
Plus trade-deal hopism & markets price that out👇🏻
Plus trade-deal hopism & markets price that out👇🏻

Anyway, so back to the RBA minutes 🦘🇦🇺:
Prepared to EASE monetary policy further if needed
Spare capacity likely in labor market 'for some years'
Noted negative effects of lower rates on savers, confidence
Prepared to EASE monetary policy further if needed
Spare capacity likely in labor market 'for some years'
Noted negative effects of lower rates on savers, confidence
Translation 🦘🇦🇺 🕊️🕊️🕊️🕊️✂️✂️
Markets priced in 25bps & we think another 25bps as well to take it to 0.5%
AUD doesn't like this underwhelming assessment of the economy obvs. Lost 0.23% vs USD after the sobering minutes of the labor market & basically signally of rate cutto
Markets priced in 25bps & we think another 25bps as well to take it to 0.5%
AUD doesn't like this underwhelming assessment of the economy obvs. Lost 0.23% vs USD after the sobering minutes of the labor market & basically signally of rate cutto

Want to see something? So the SCHOMP is stuck at the ~2900 range for six months partly due to limited support by the gov via monetary & fiscal policy & worsening economic data.
I overlaid SPX to it & SPX was trending the same since May but diverged around mid October. So, why?
I overlaid SPX to it & SPX was trending the same since May but diverged around mid October. So, why?
Of course you can say Fed cuts - the Halloween present of -25bps🕊️✂️& also the economic data showing slowing but not collapsing growth. Added to this is trade-deal hopism.
Anyway, why hasn't the trade hopism translated to SCHOMP? Is onshore that worried about growth/earnings?🧐
Anyway, why hasn't the trade hopism translated to SCHOMP? Is onshore that worried about growth/earnings?🧐


Obviously we're talking about 2 very diff indices here - one is mostly tech (SPX) & the other is mostly industrial but the interesting fact is they are diverging in performance
This is why markets are eyeing the loan prime rate (LPR) tomorrow for China👈🏻
This is why markets are eyeing the loan prime rate (LPR) tomorrow for China👈🏻