Update 25-03 (thread)
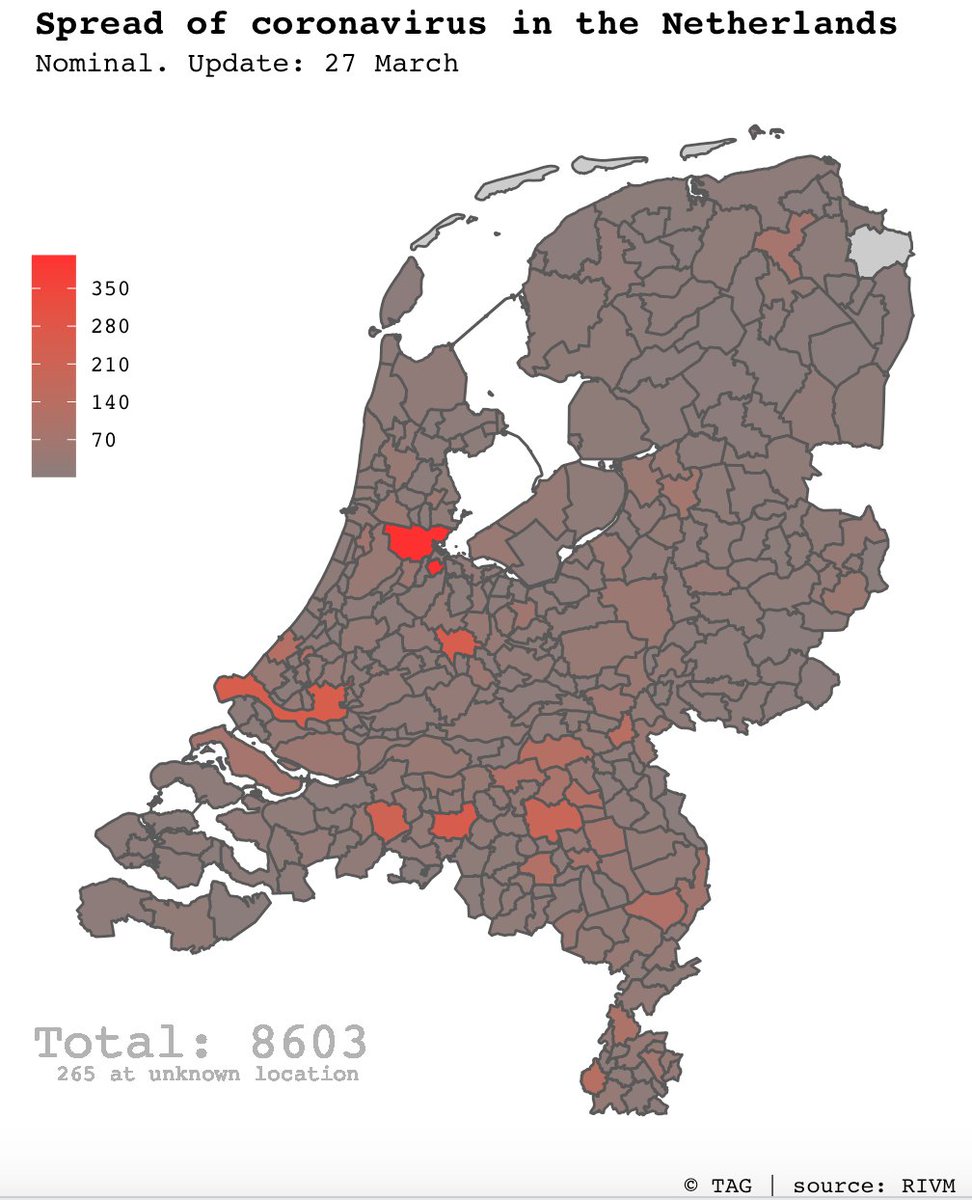
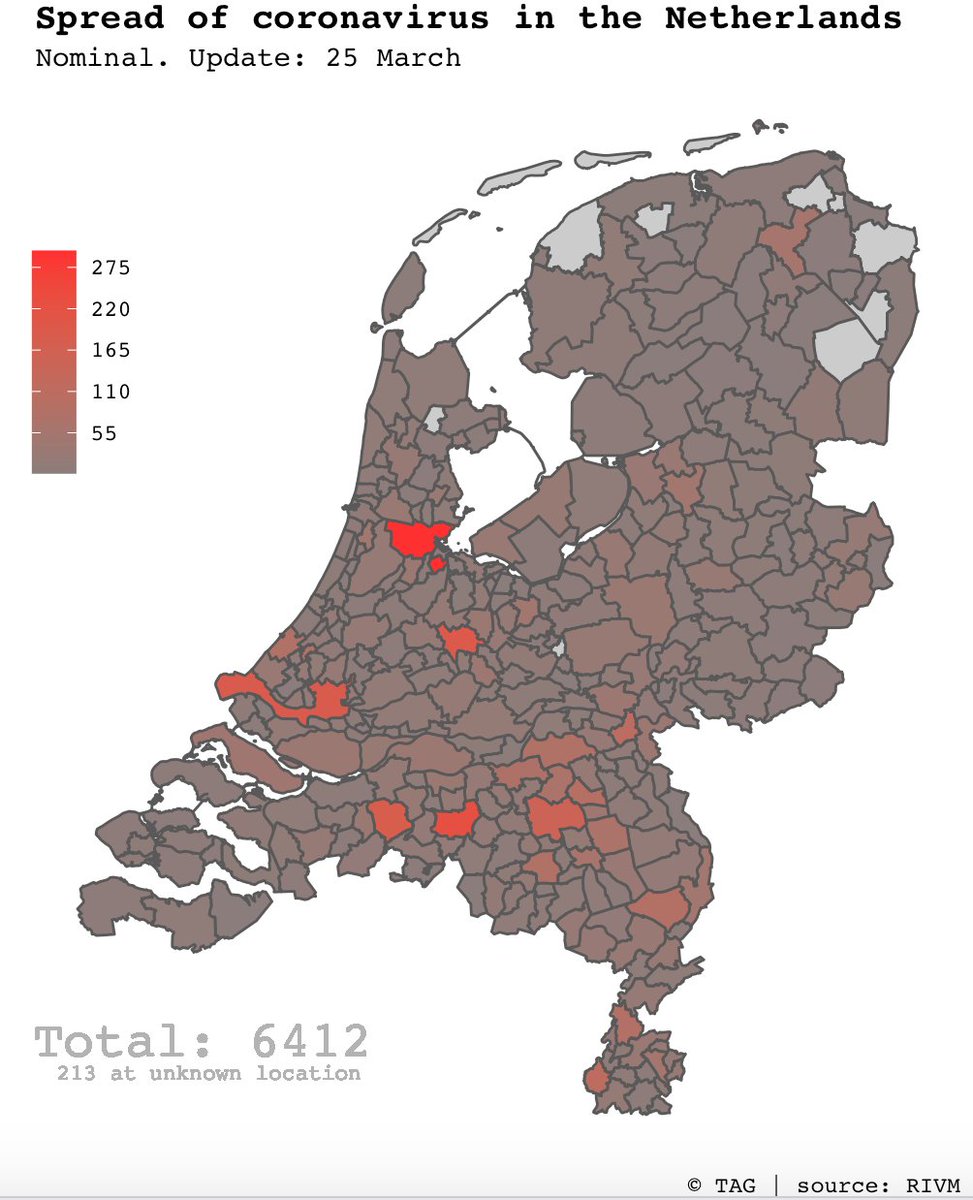
Spread of the #coronavirus in the Netherlands.
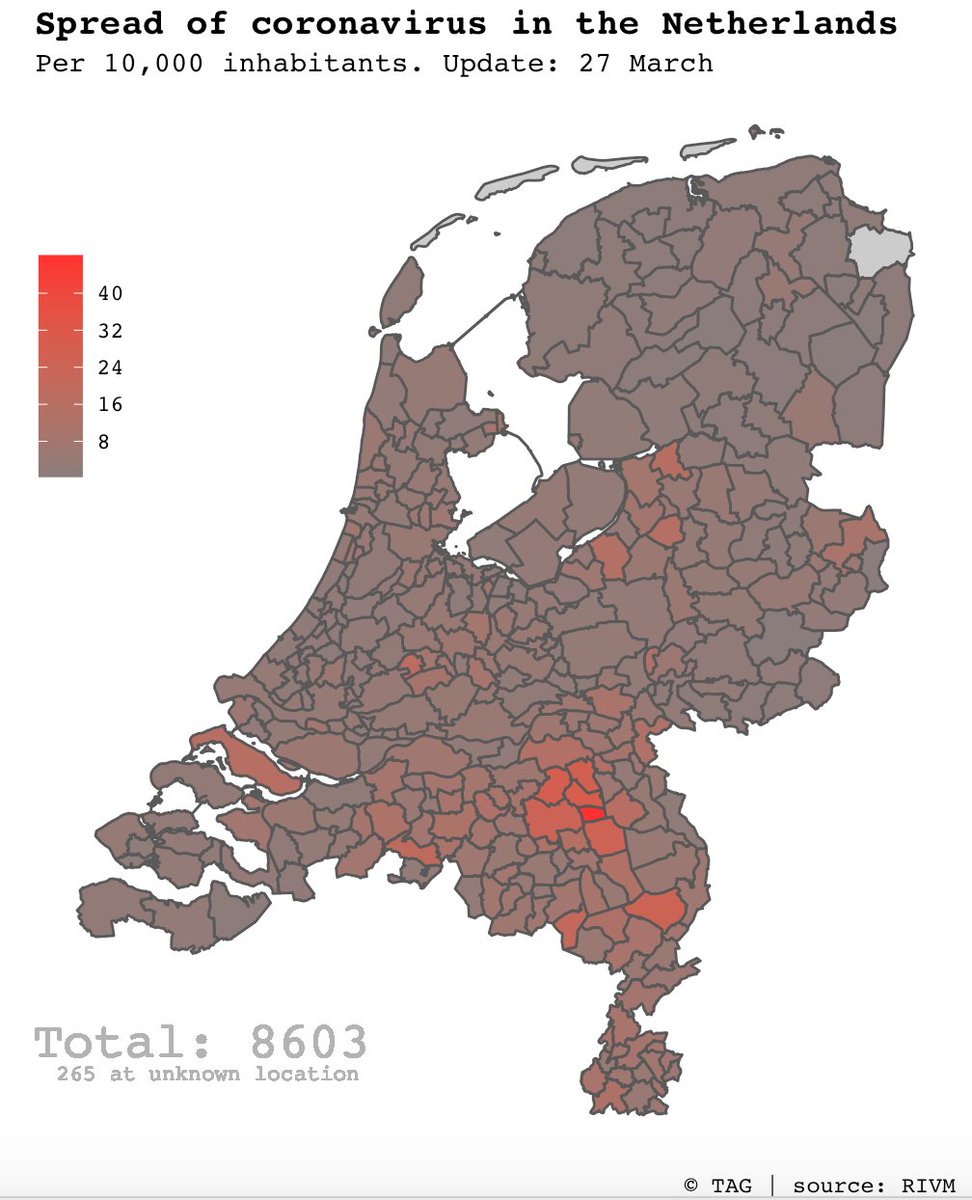
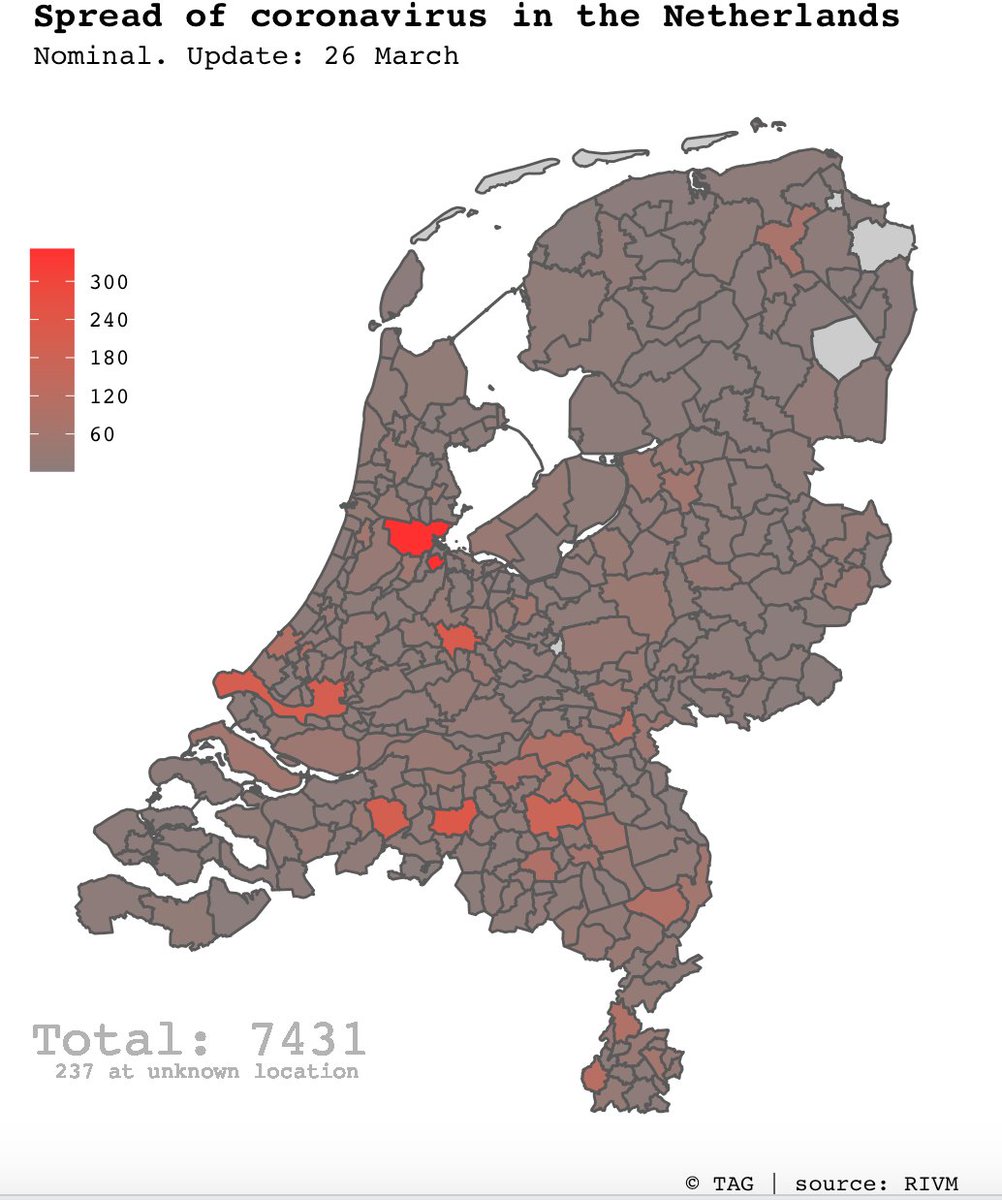
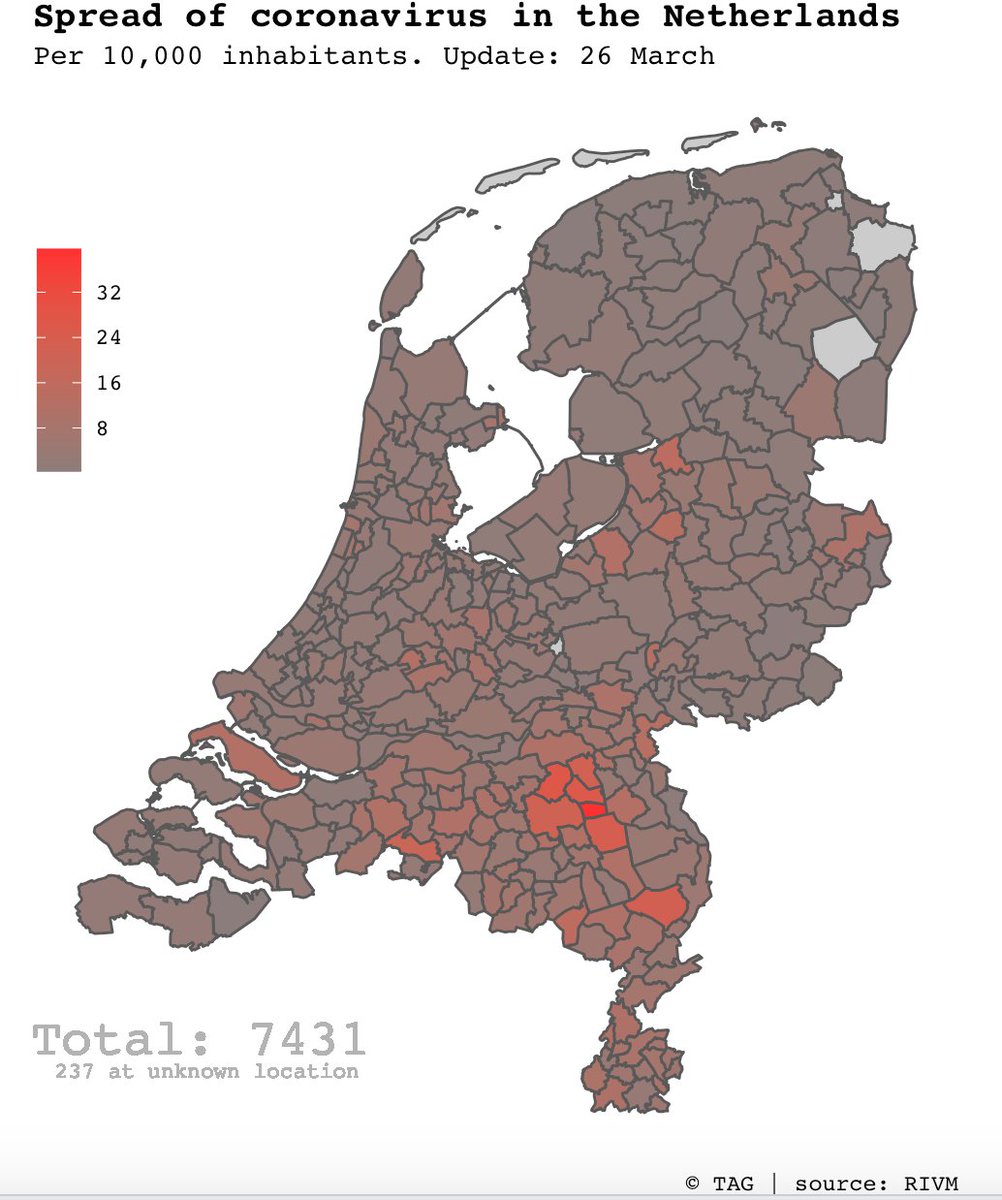
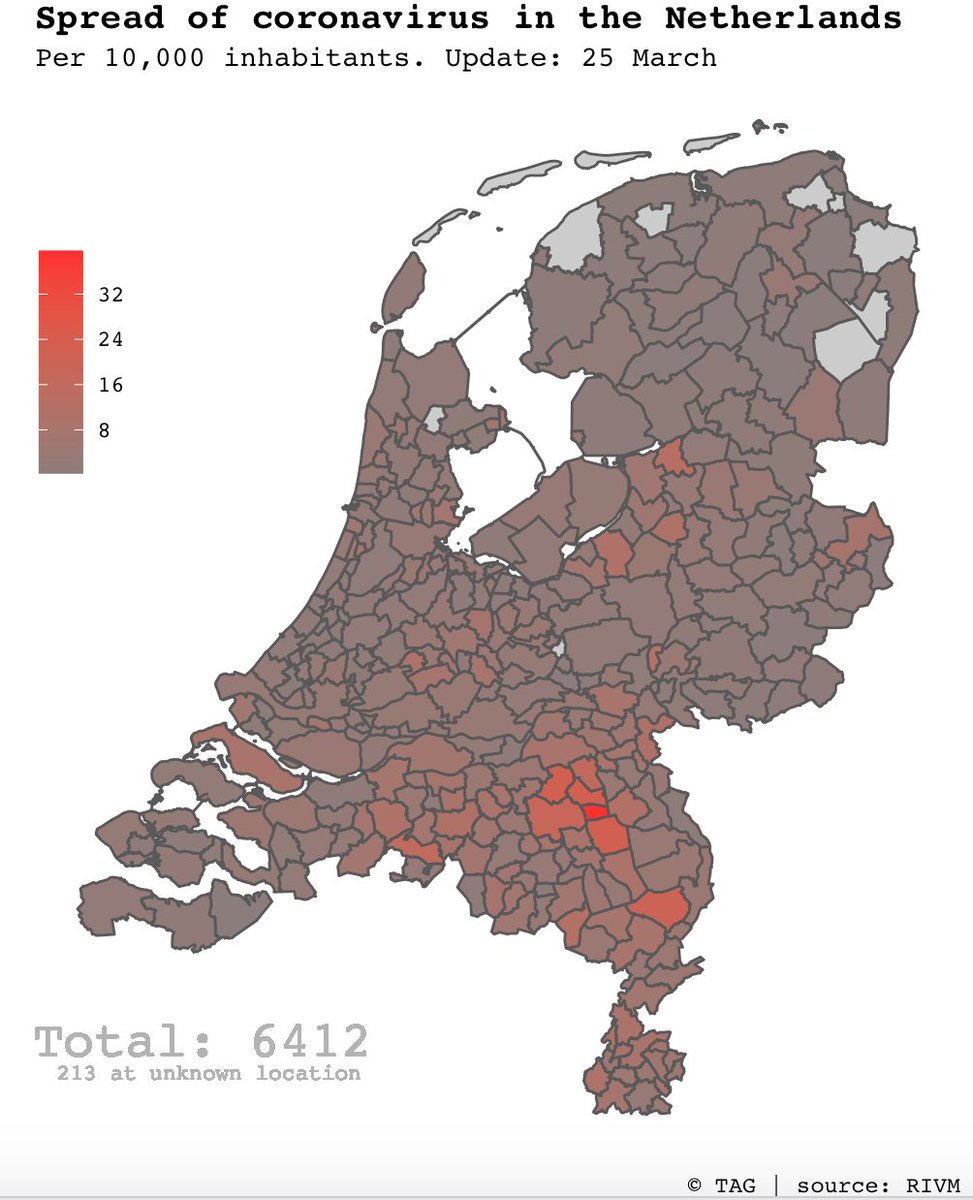
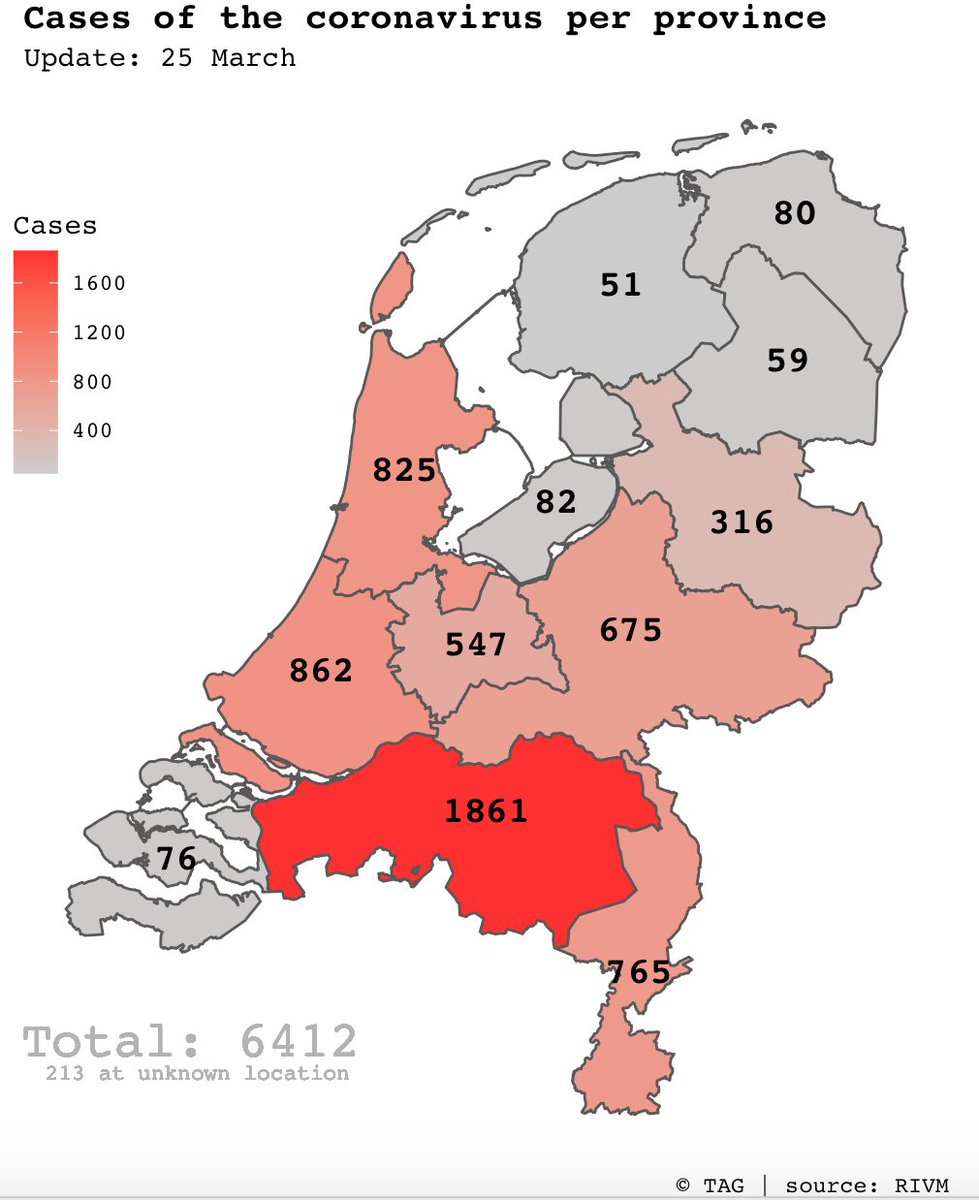
In total 6412 persons have tested positive. Left map shows nominal cases, right map shows cases per 10,000 inhabitants.
#coronakaart #coronavirusNL #COVID19NL
Spread of the #coronavirus in the Netherlands.
In total 6412 persons have tested positive. Left map shows nominal cases, right map shows cases per 10,000 inhabitants.
#coronakaart #coronavirusNL #COVID19NL
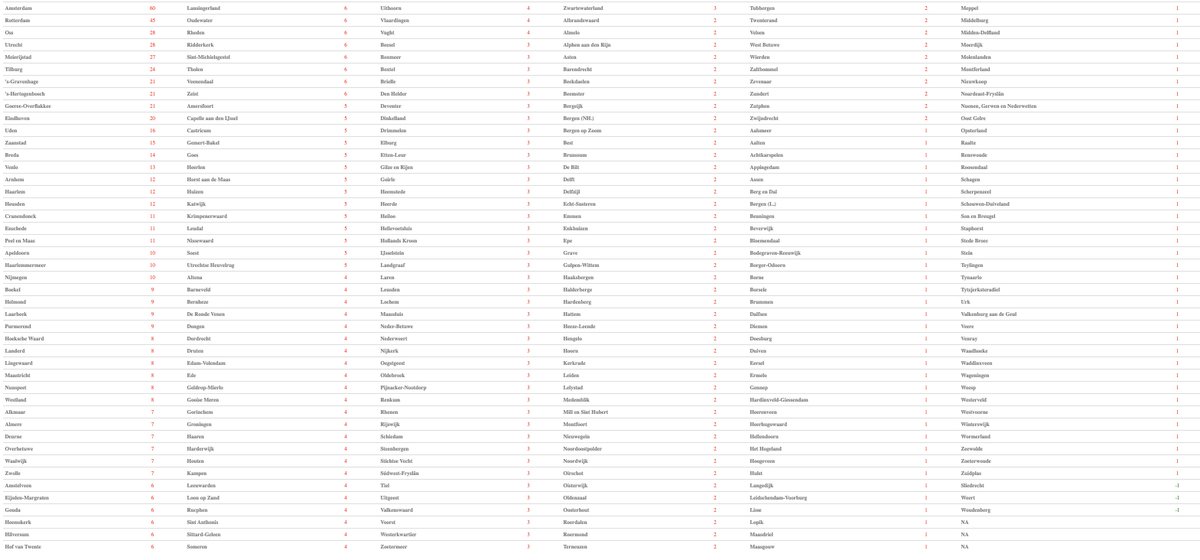
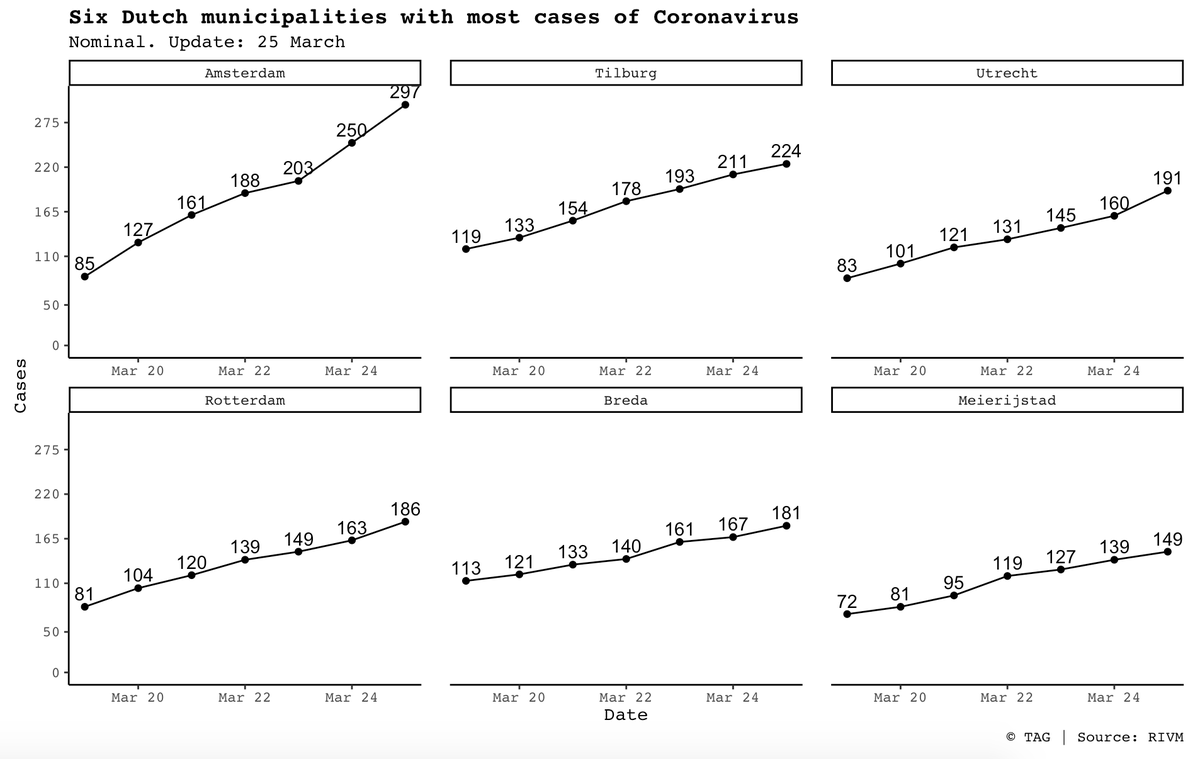
245 municipalities report at least one new case of the #coronavirus.
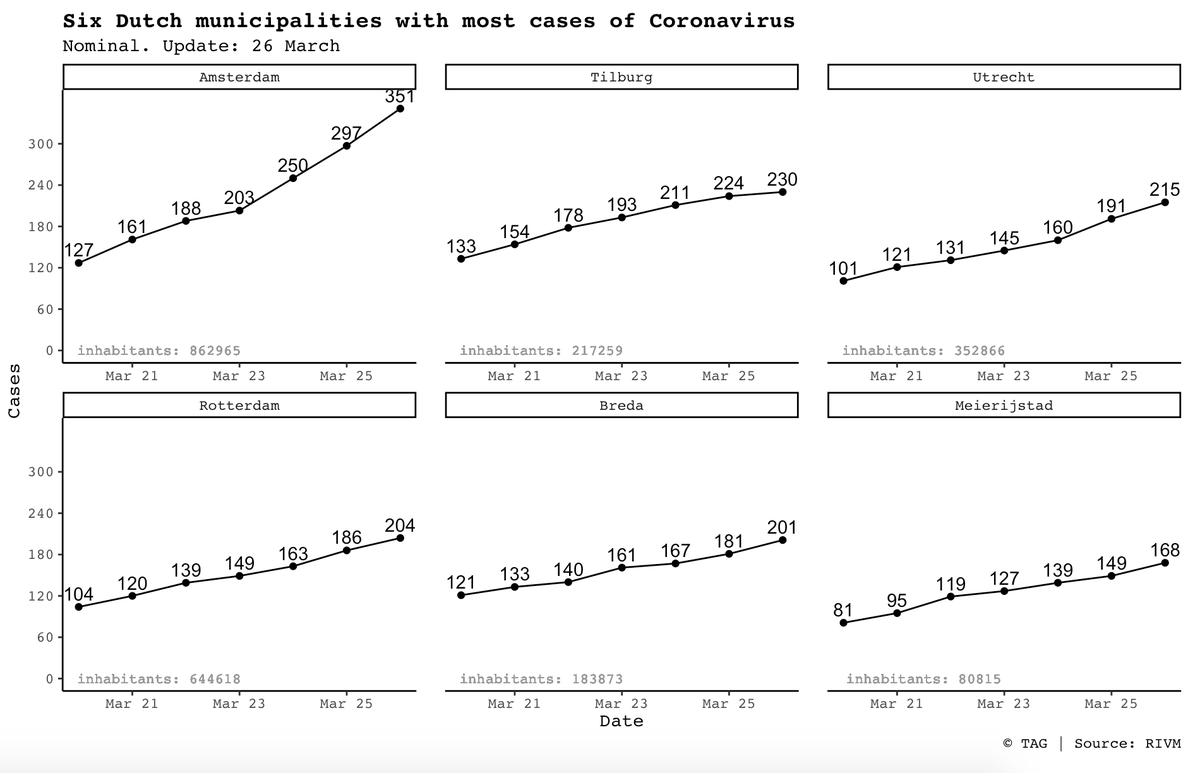
Biggest increase in Amsterdam (+47), Utrecht (+31) and Rotterdam (+23).
#coronavirusNL #coronavirusNederland
Biggest increase in Amsterdam (+47), Utrecht (+31) and Rotterdam (+23).
#coronavirusNL #coronavirusNederland
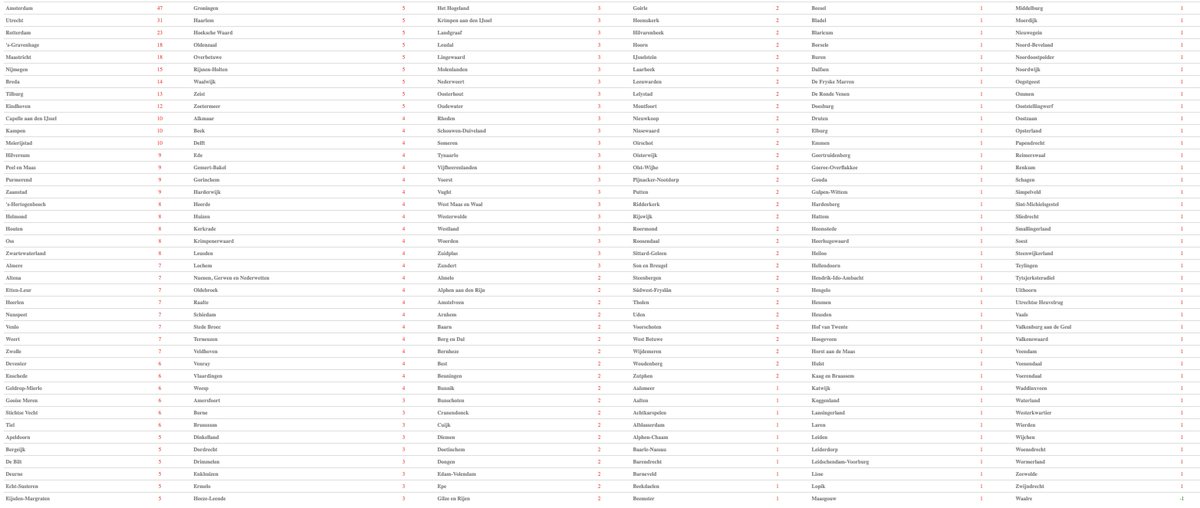
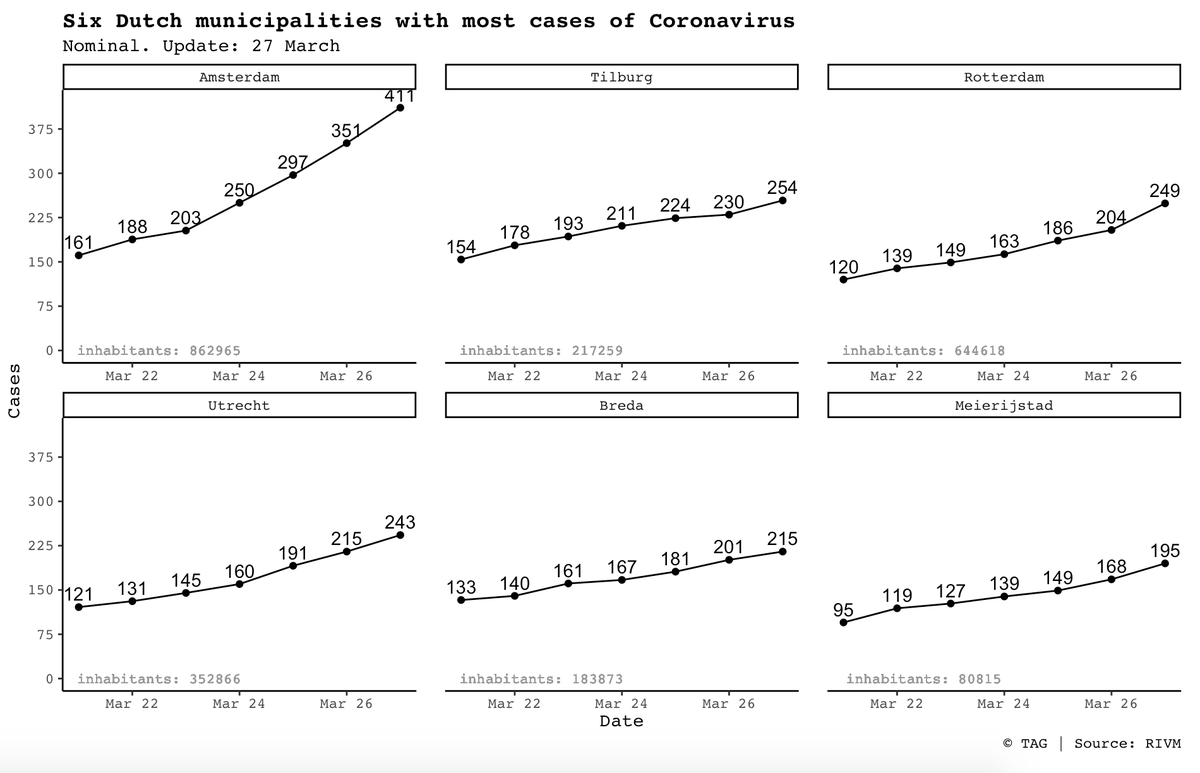
Most nominal cases: Amsterdam, Tilburg, Utrecht, Rotterdam, Breda and Meierijstad.
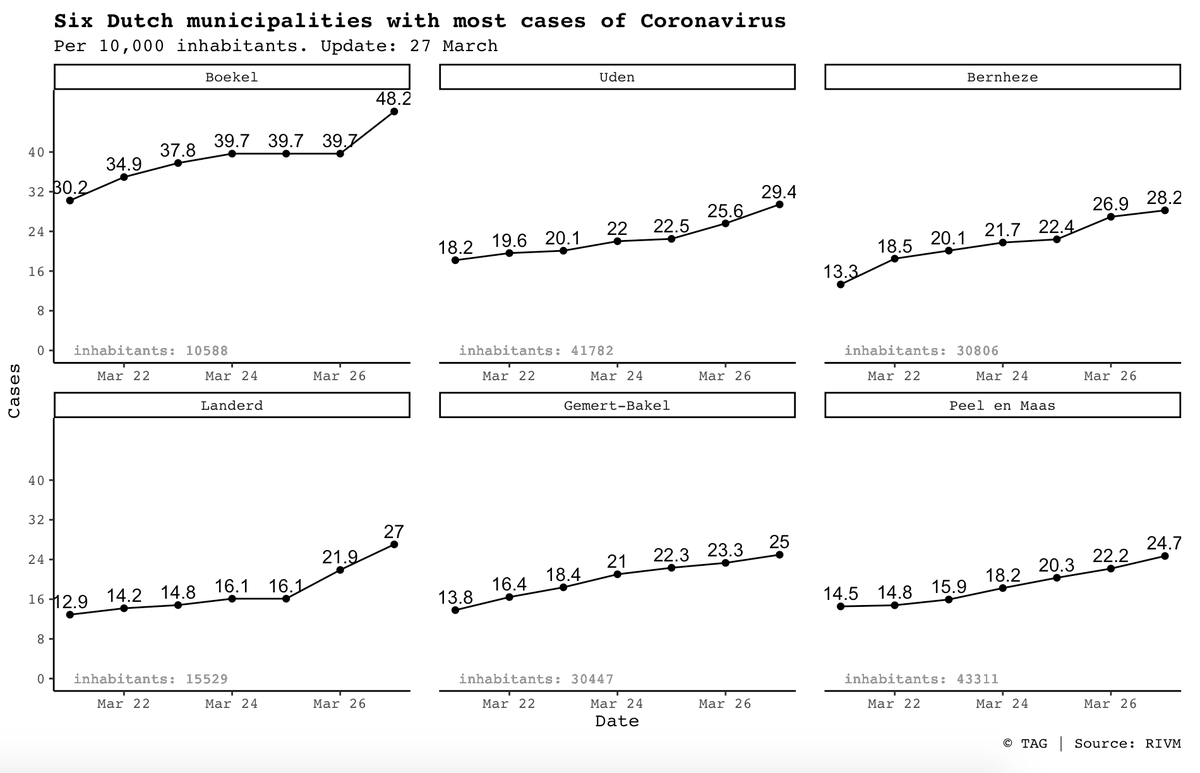
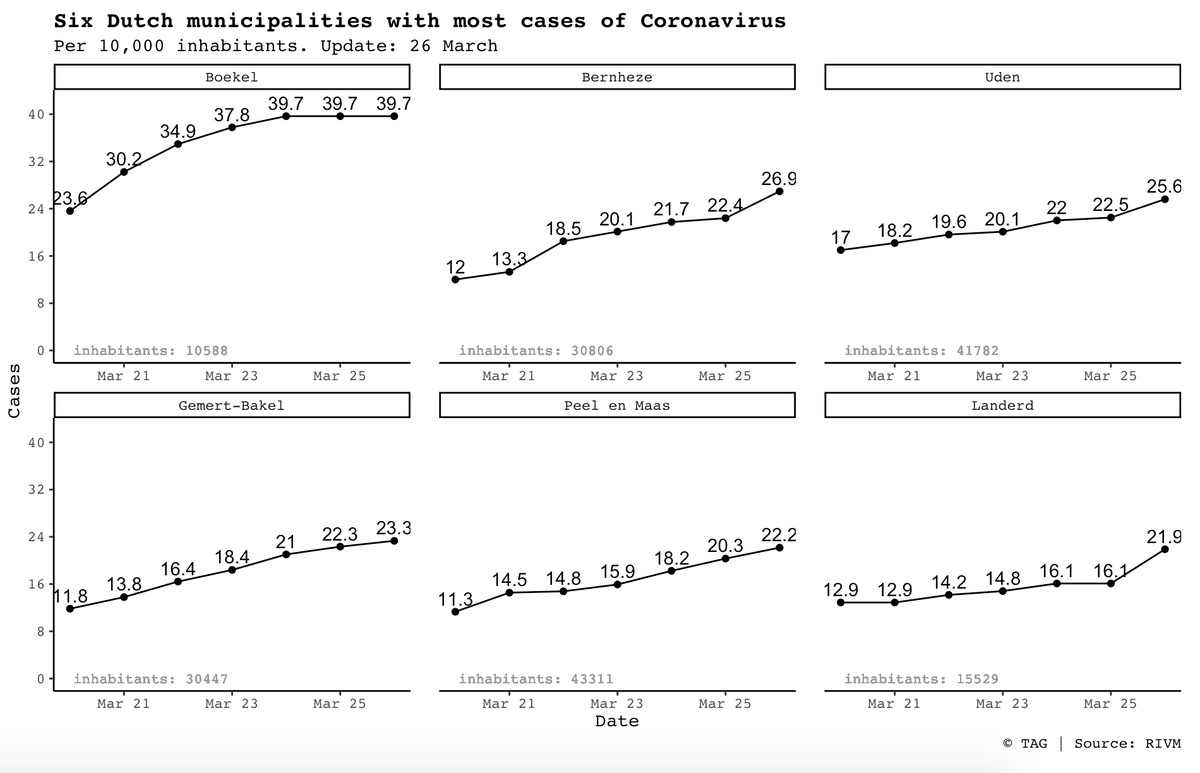
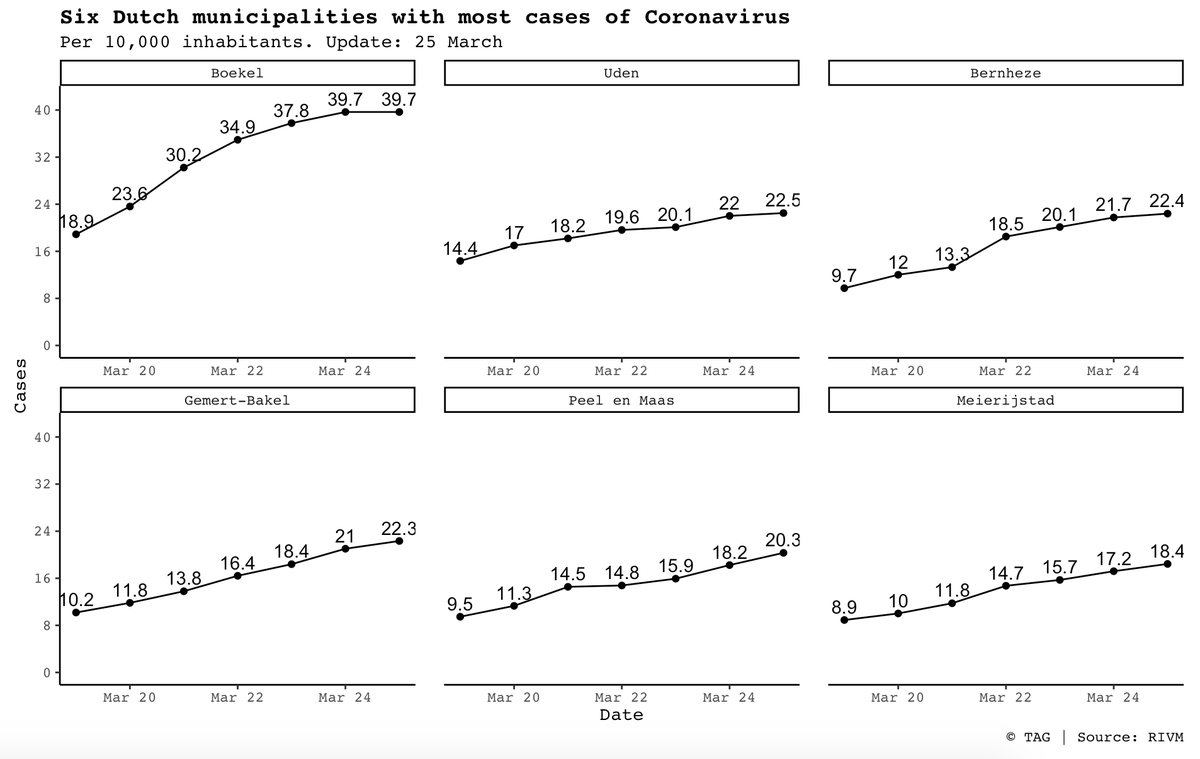
Most cases per 10,000 inhabitants: Boekel, Uden, Bernheze, Gemert-Bakel, Peel en Maas and Meierijstad.
#coronavirusNL #covid19NL
Most cases per 10,000 inhabitants: Boekel, Uden, Bernheze, Gemert-Bakel, Peel en Maas and Meierijstad.
#coronavirusNL #covid19NL
Spread of the #coronavirus over the Netherlands during the last 23 days:
#coronavirusNL #coronavirusNederland #coronakaart
#coronavirusNL #coronavirusNederland #coronakaart
Total number of confirmed cases of the #coronavirus per Dutch province:
#coronakaart #coronavirusNL #covid19NL
#coronakaart #coronavirusNL #covid19NL
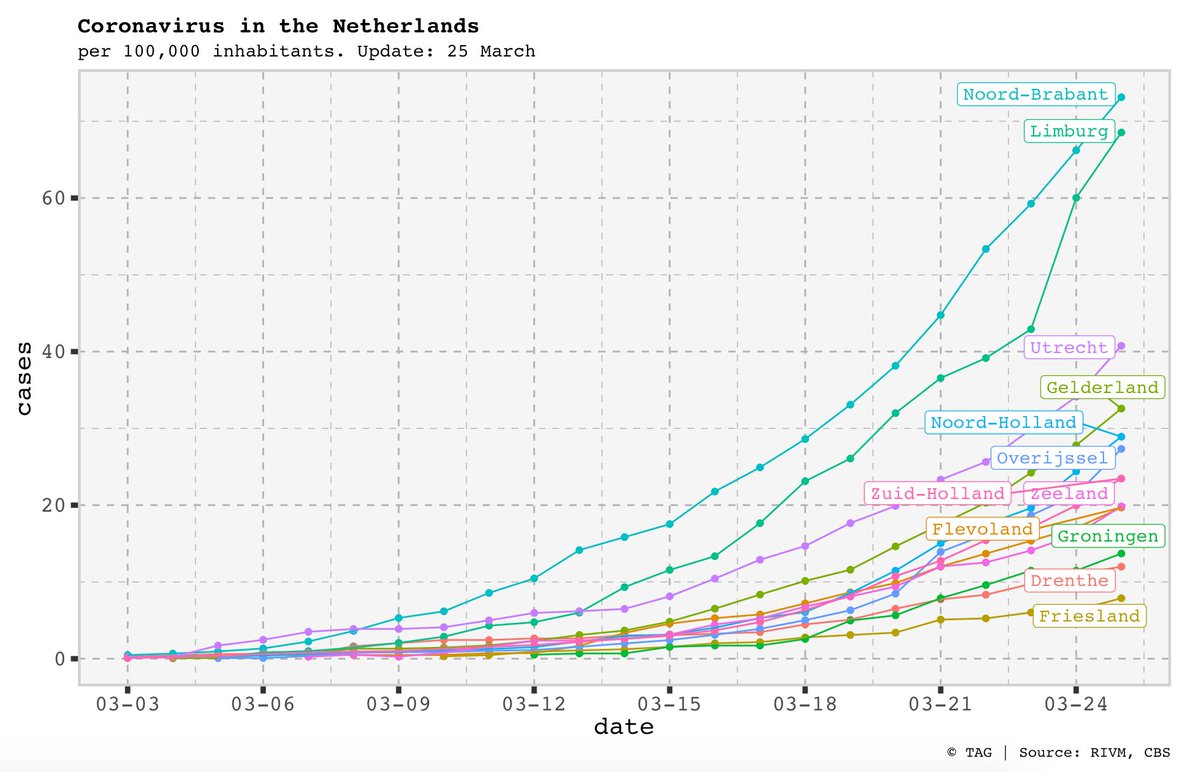
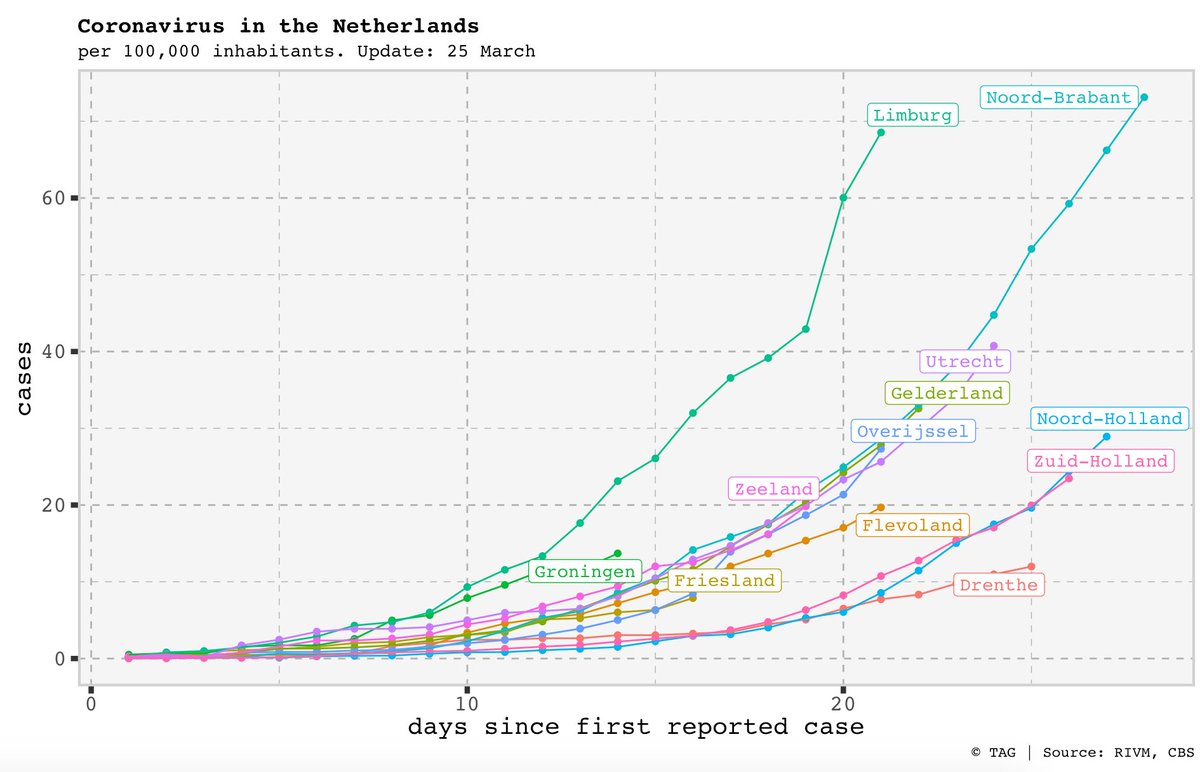
Confirmed cases of the #coronavirus per Dutch province per 100,000 inhabitants.
Left graph shows the development over time whereas the right graph shows the development starting from the day the first case in that province was reported.
#coronavirusNL #coronavirusNederland
Left graph shows the development over time whereas the right graph shows the development starting from the day the first case in that province was reported.
#coronavirusNL #coronavirusNederland
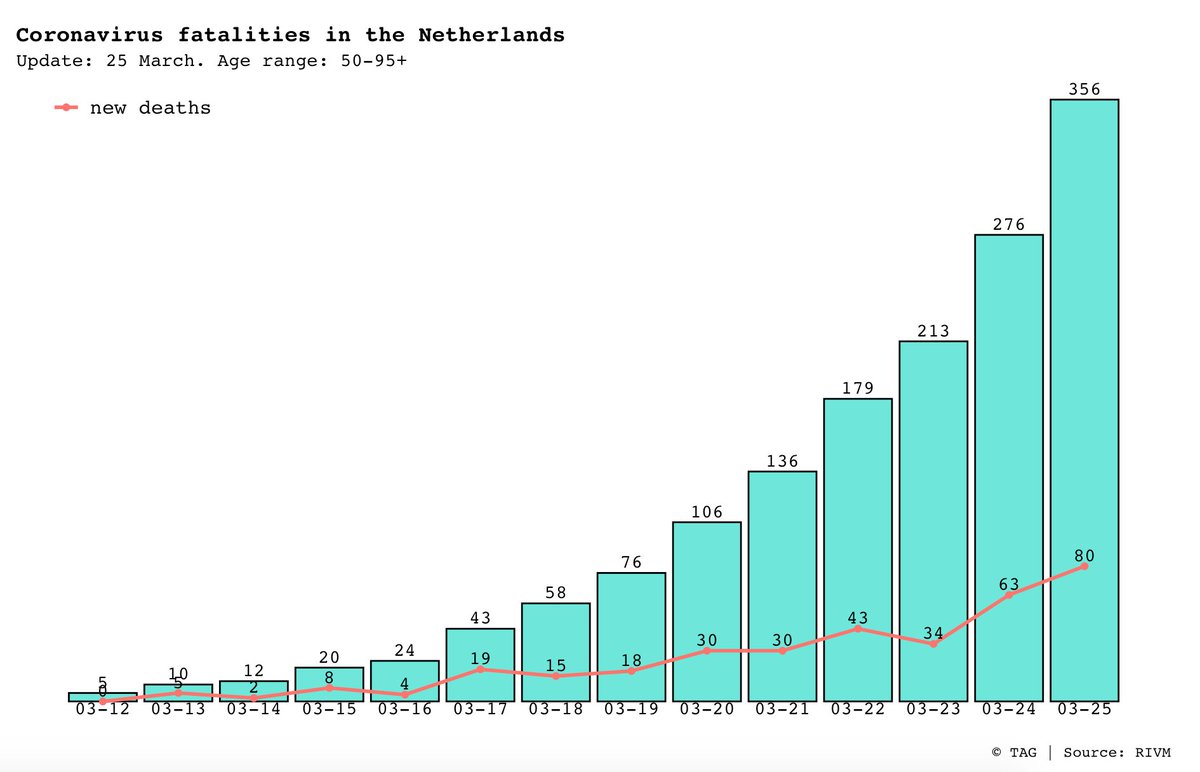
Unfortunately, 80 patients have died yesterday. Their ages range from 50-95+.
This graph shows the fatalities due to the #coronavirus in the last two weeks:
#coronavirusNL #coronavirusNederland
This graph shows the fatalities due to the #coronavirus in the last two weeks:
#coronavirusNL #coronavirusNederland
unroll @threadreaderapp