, 24 tweets, 30 min read Read on Twitter
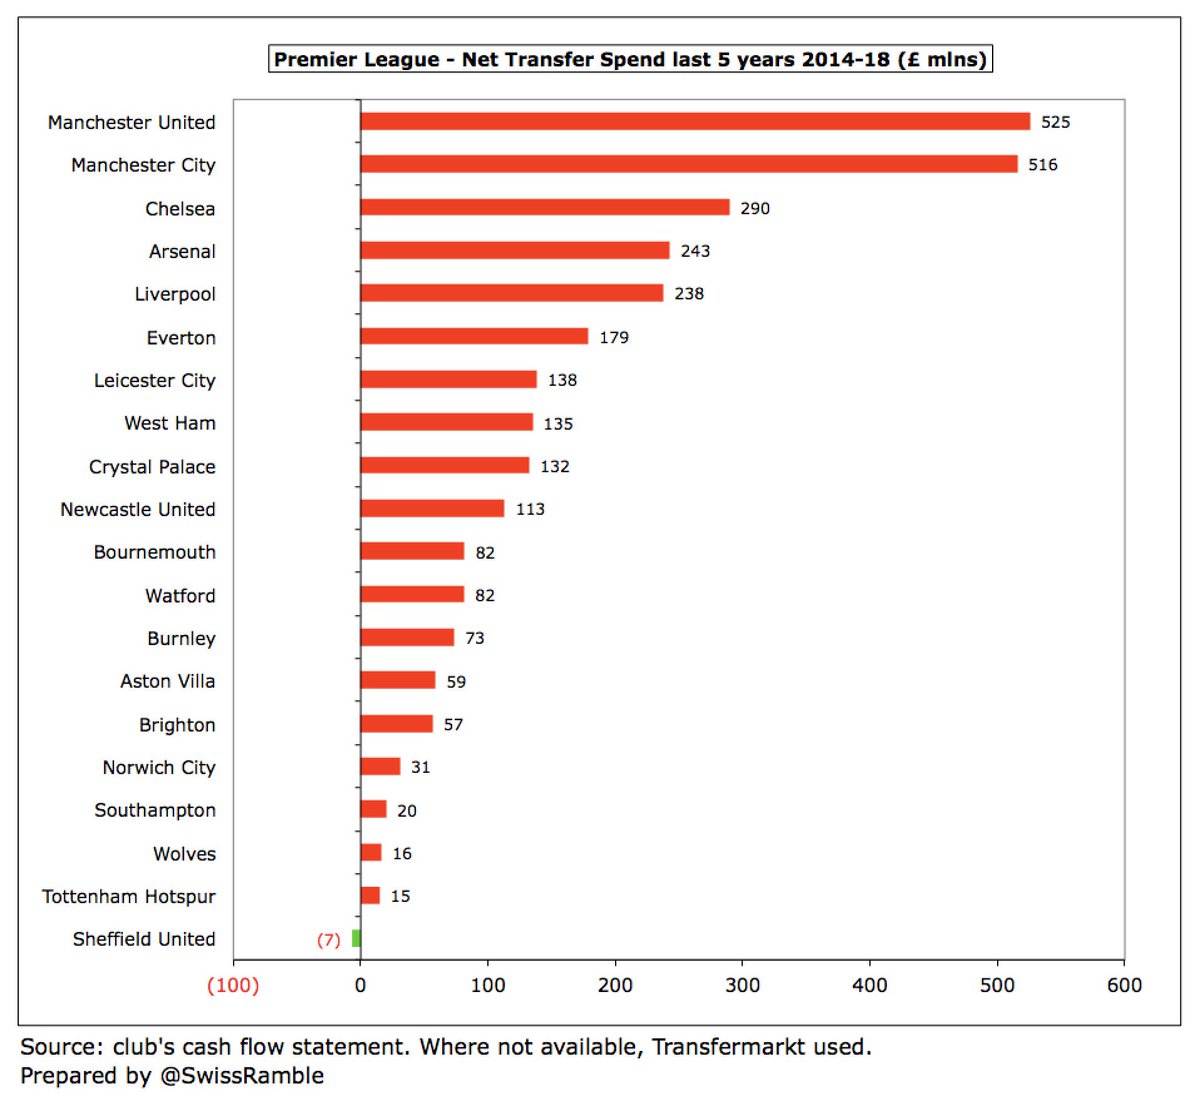
In preparation for the upcoming 2018/19 Premier League season, I thought that it might be interesting to look at the transfer spend over the last decade, including the growing impact on debt. The analysis is split between 3 periods: last 3 years, last 5 years and last 10 years.
The transfer fees spend is taken from the clubs’ cash flow statements, as this is the only completely accurate source of data. However, it is worth noting that this does not always represent the full cost of transfers, due to the (increasing) use of stage payments.
In the very few cases where a cash flow statement was not available, e.g. if a club only published abbreviated accounts while they were in lower leagues, I have taken data for those years from the Transfermarkt website.
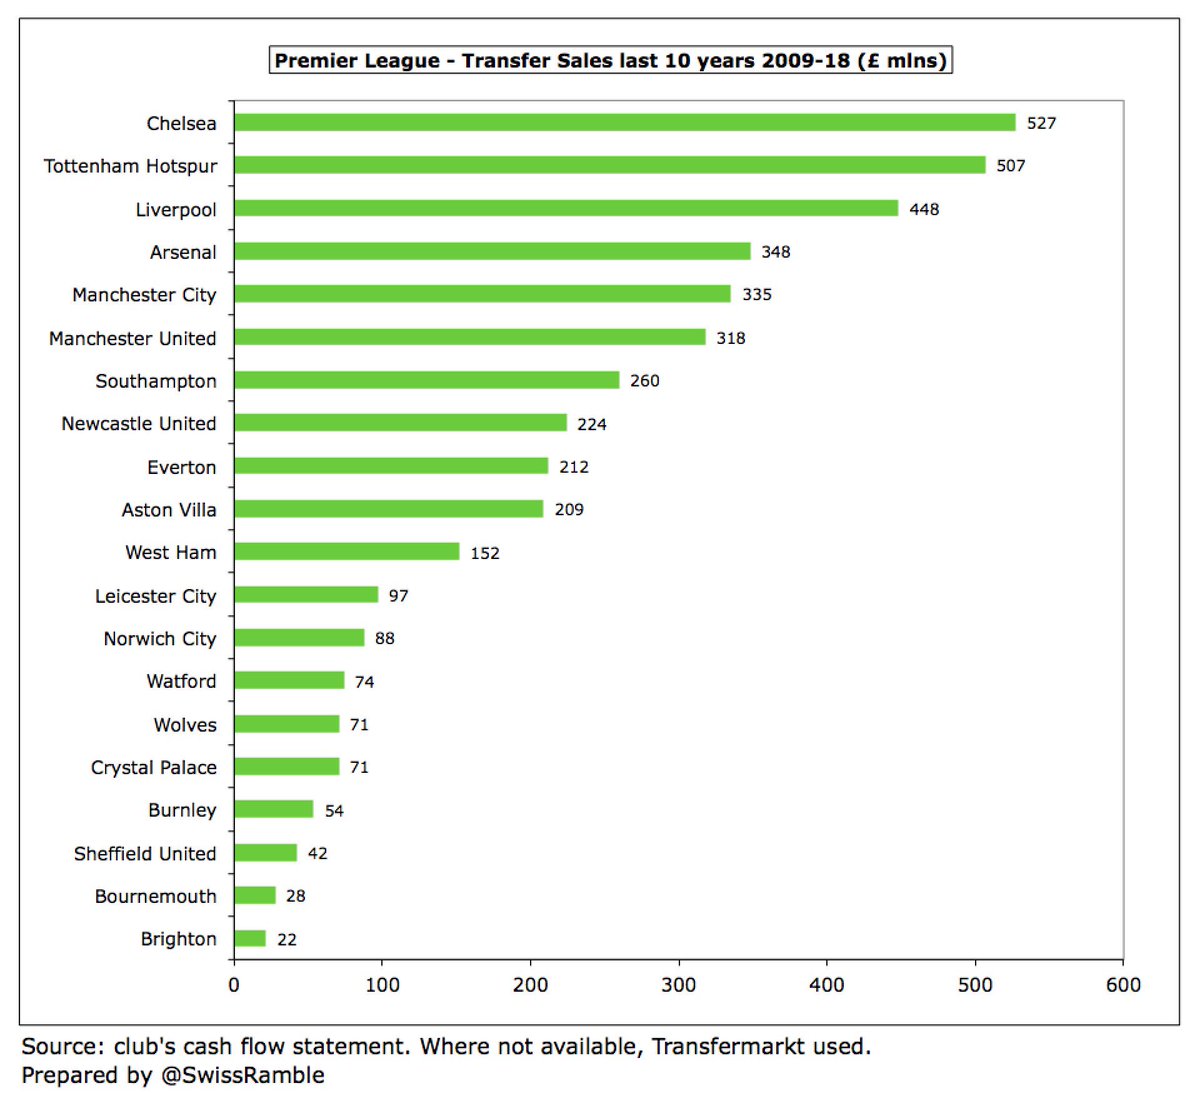
The full data covers the 10 years between the 2008/09 and 2017/18 seasons. Therefore, it excludes any transfer business conducted in the last three windows: summer 2018, January 2019 and summer 2019.
Final technical note: the comparison is for clubs that are currently in the Premier League (2019/20 season), so it might be a little misleading for those clubs that have spent the majority of the period outside the top flight, as they tend to spend less in the lower leagues.
In the last 3 years (2016-18) the highest gross transfer spend of around half a billion came at #MCFC £559m and #MUFC £487m, followed by #CFC £416m, #LFC £351m, #AFC £288m & #EFC £259m. Lowest spend of the Big Six was at #THFC £182m, surprisingly behind #LCFC £195m & #NUFC £184m.
In the last 3 years (2016-18) #CFC recouped most with £274m player sales, followed by 4 clubs around £200m: #LFC £225m, #THFC £221m, #SaintsFC £207m and #MCFC £191m. Lagging behind were #MUFC £137m and #AFC £103m, though #AVFC did well to earn £102m.
In terms of net spend in last 3 years (2016-18), #MCFC and #MUFC again led the way with similar outlays: £368m and £350m respectively. There was a large gap to #AFC £185m, #EFC £168m, #CFC £141m and #LFC £126m. Three clubs had net sales: #THFC £39m, #SaintsFC £30m and #SUFC £6m.
The story is much the same over last 5 years (2014-18) for gross spend with the highest at #MCFC £760m, #MUFC £697m, #CFC £676m, #LFC £513m, #AFC £400m, #THFC £338m and #EFC £311m. Spend is significantly lower at recently promoted clubs: #SUFC £12m, #WWFC £56m and #BHAFC £74m.
Also similar for player sales in last 5 years (2014-18) with most earned at #CFC £386m, #THFC £323m, #LFC £276m, #MCFC £244m, #SaintsFC £241m, #MUFC £172m and #AFC £157m. Very little cash generated at #BHAFC £18m, #SUFC £19m and #AFCB £24m, though may have helped promotion drive.
It is striking how similar net spend is over the last 5 years (2014-18) at #MCFC £525m and #MUFC £516m. This is nearly quarter of a billion more than their closest rivals: #CFC £290m, #AFC £243m and #LFC £238m. #THFC net spend over this period was just £15m, only more than #SUFC.
Over 10 years (2009-18) #MCFC is the clear leader in gross transfer spend with £1.4 bln, nearly £400m more than #CFC £974m, followed by #MUFC £927m and #LFC £821m. The lowest outlays of the Big Six are the North London clubs: #AFC £617m and #THFC £587m.
The importance of player sales to #CFC business model is again underlined by them leading the way over the last 10 years (2009-18) with £527m, followed by #THFC £507m and #LFC £448m. Then there is a £100m gap to #AFC £348m, #MCFC £335m and #MUFC £318m.
There is again clear water in net spend between #MCFC and rest of the top tier over last 10 years (2009-18) with their £1 billion being £400m more than #MUFC £609m, followed by #CFC £447m, #LFC £372m and #AFC £268m. #THFC are firmly in the lower half of the table with just £80m.
It is evident that clubs are increasing transfer spend, particularly since the new Premier League TV deal in 2017. However, despite 70% growth in 5 years, #AFC (up £45m) and #THFC (up 31m) have fallen behind, e.g. growth at #MCFC was £150m, #MUFC £109m, #CFC £105m and #LFC £94m.
On the other hand, the Big Six are also generating more funds from player sales in the last 5 years. The most impressive growth has come at #LFC, #CFC and #MCFC, up £89m, £77m and £58m respectively. #AFC £81m received in 2018 reversed 5 successive years of lower player sales.
Only two clubs in the Big Six have meaningfully increased their net spend in the last 5 years, namely #MCFC (up £92m) and #MUFC (up £72m). #AFC and #LFC net spend in 2018 is basically the same as 2013. #THFC have reported net sales in each of the last 3 years.
#AFC purchase of Nicolas Pépé highlighted clubs’ growing use of stage payments to finance transfers, but there was nothing unusual in this transaction, as most are handled this way. For example, at the end of 2017/18 season, #MUFC had £258m transfer debt, followed by #MCFC £141m.
Note: not all clubs separately show transfer debt in their accounts, but this would represent the lion’s share of Trade Creditors at those that don’t, i.e. #CFC £169m, #LFC £148m, #EFC £88m and #AVFC £27m.
At the same time, clubs also have money paid to them in instalments for players that they have sold. Of those clubs that separate transfer payments in their accounts, at the end of 2017/18 the highest balances were at #MCFC £80m, #AFC £62m, #NUFC £44m and #NCFC £42m.
So the highest net debt on transfer fees at the end of the 2017/18 season was at #MUFC £229m with a large gap to #WatfordFC £88m, #THFC £68m, #MCFC £61m, #CPFC £47m and #LCFC £44m. These debts are on the high side for the clubs outside the Big Six (due to lower revenue coverage).
Unsurprisingly, transfer debt has been rising in line with the higher fees. Since 2013, the increase in gross transfer debt at #MUFC was £225m, followed by #MCFC £121m, #AFC £80m and #THFC £74m. Similarly, Trade Creditors were up £89m and £85m respectively at #CFC and #LFC.
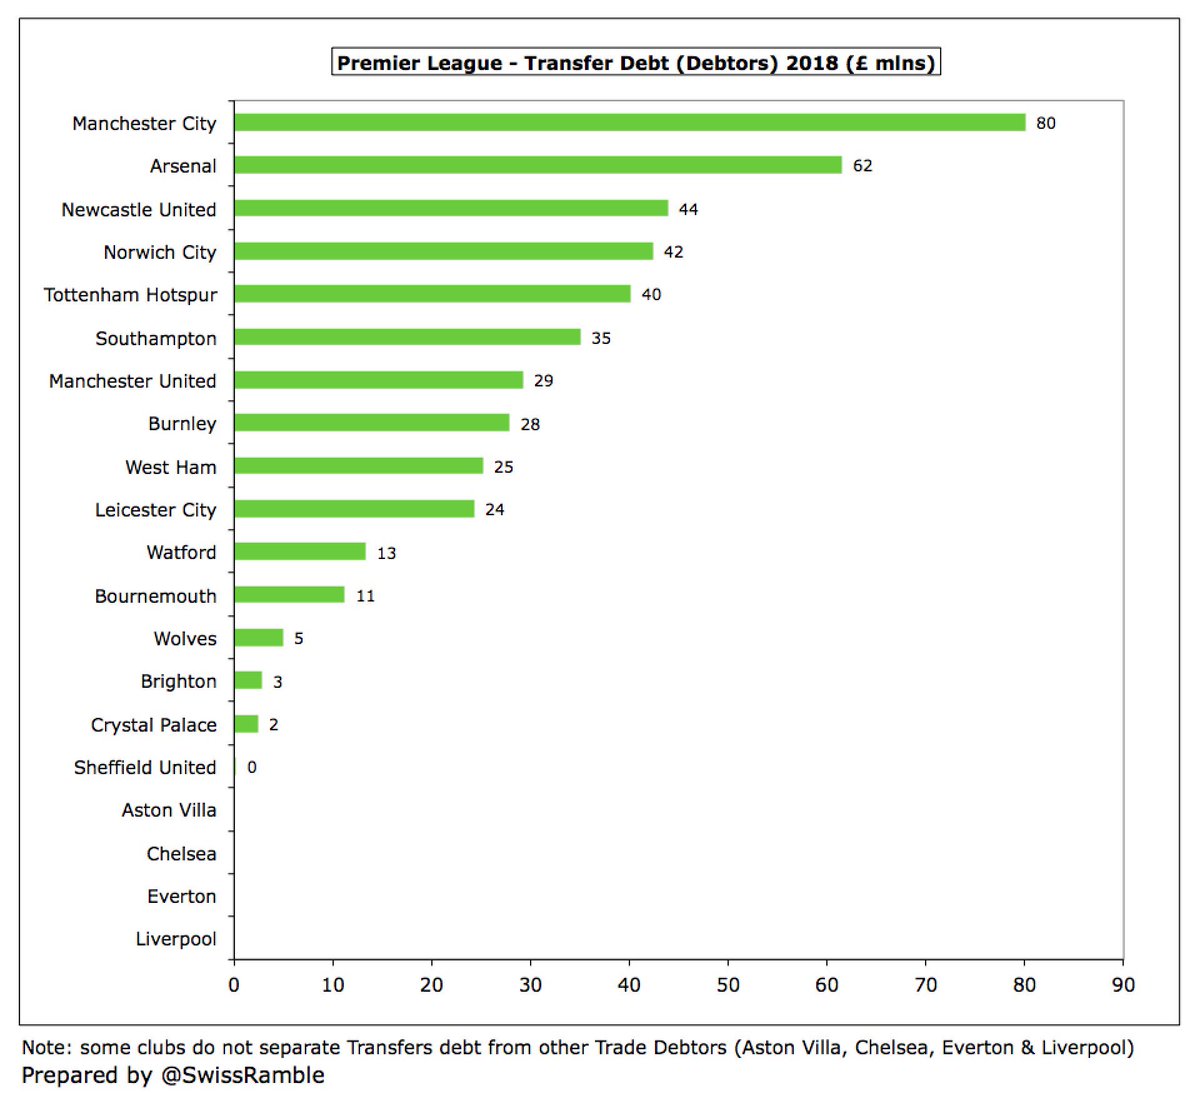
So transfer debt has become increasingly important, not just due to the growth, but also because UEFA’s FFP definition of debt includes a club’s net player transfers balance plus net borrowings (i.e. bank loans, owner loans and finance leases less cash balances).
Of course, debt figures on their own do not necessarily mean a great deal, as other factors come into play, such as the size of the cash balance, e.g. #MUFC had £242m, and also coverage based on revenue/cash generation. Nevertheless, it is worth keeping an eye on this metric.
Missing some Tweet in this thread?
You can try to force a refresh.

Like this thread? Get email updates or save it to PDF!

Subscribe to Swiss Ramble
Profile picture

Get real-time email alerts when new unrolls are available from this author!

This content may be removed anytime!

Twitter may remove this content at anytime, convert it as a PDF, save and print for later use!

Try unrolling a thread yourself!

how to unroll video

1) Follow Thread Reader App on Twitter so you can easily mention us!

2) Go to a Twitter thread (series of Tweets by the same owner) and mention us with a keyword "unroll" @threadreaderapp unroll

You can practice here first or read more on our help page!

Follow Us on Twitter!

Did Thread Reader help you today?

Support us! We are indie developers!


This site is made by just three indie developers on a laptop doing marketing, support and development! Read more about the story.

Become a Premium Member ($3.00/month or $30.00/year) and get exclusive features!

Become Premium

Too expensive? Make a small donation by buying us coffee ($5) or help with server cost ($10)

Donate via Paypal Become our Patreon

Thank you for your support!