,
39 tweets,
26 min read
Read on Twitter
One of the questions most frequently asked by football fans is “Where’s all the money gone?” The answer is only partly found in a club’s profit and loss account, so we need to also look at the cash flow statement to get the full picture. Some thoughts in the following thread.
A club’s profit and loss account is easy to understand, as it is basically revenue less expenses (mainly player wages), but this is an accounting profit based on the accruals concept, which can be very different from actual cash movements.
This is important, as the main reason that football clubs fail is cash flow problems. It does not matter how large your revenue is (or your profits are), if you do not have the cash to pay your players, suppliers or indeed the taxman, then you will find yourself in trouble.
This analysis will start with the familiar profit and loss account and then reconcile this to the cash flow statement to highlight the differences. It’s fairly technical, but will reveal the different business models that are employed and explain why certain clubs act as they do.
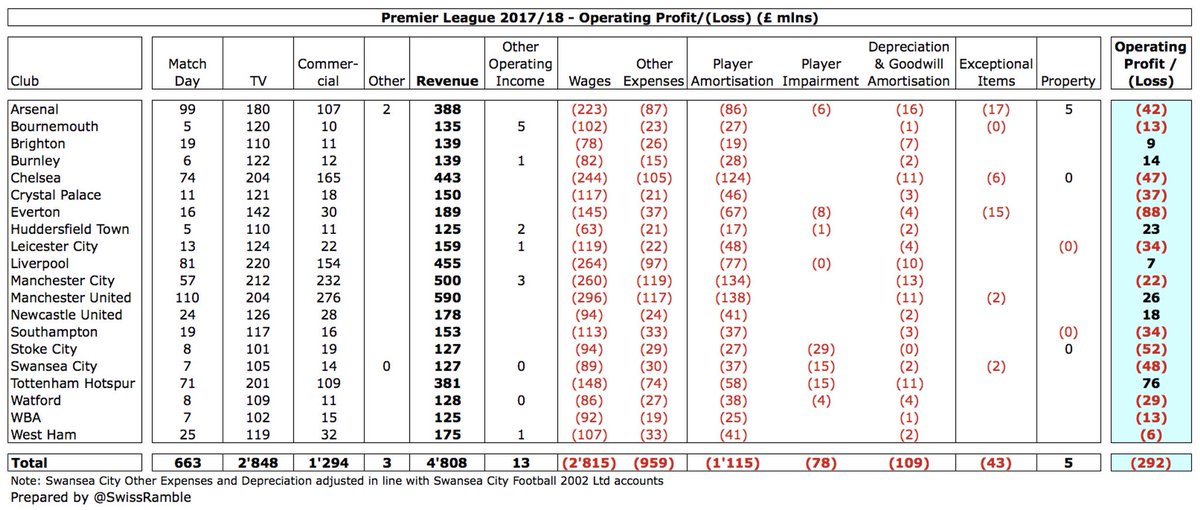
Total 17/18 Premier League revenue was £4.8 bln (TV £2.8 bln, commercial £1.3 bln, match day £0.7 bln), but this still produced £292m operating losses, mainly due to £2.8 bln wages (wages to turnover 59%) plus £1.3 bln player amortisation & depreciation & £1.0 bln other expenses. 


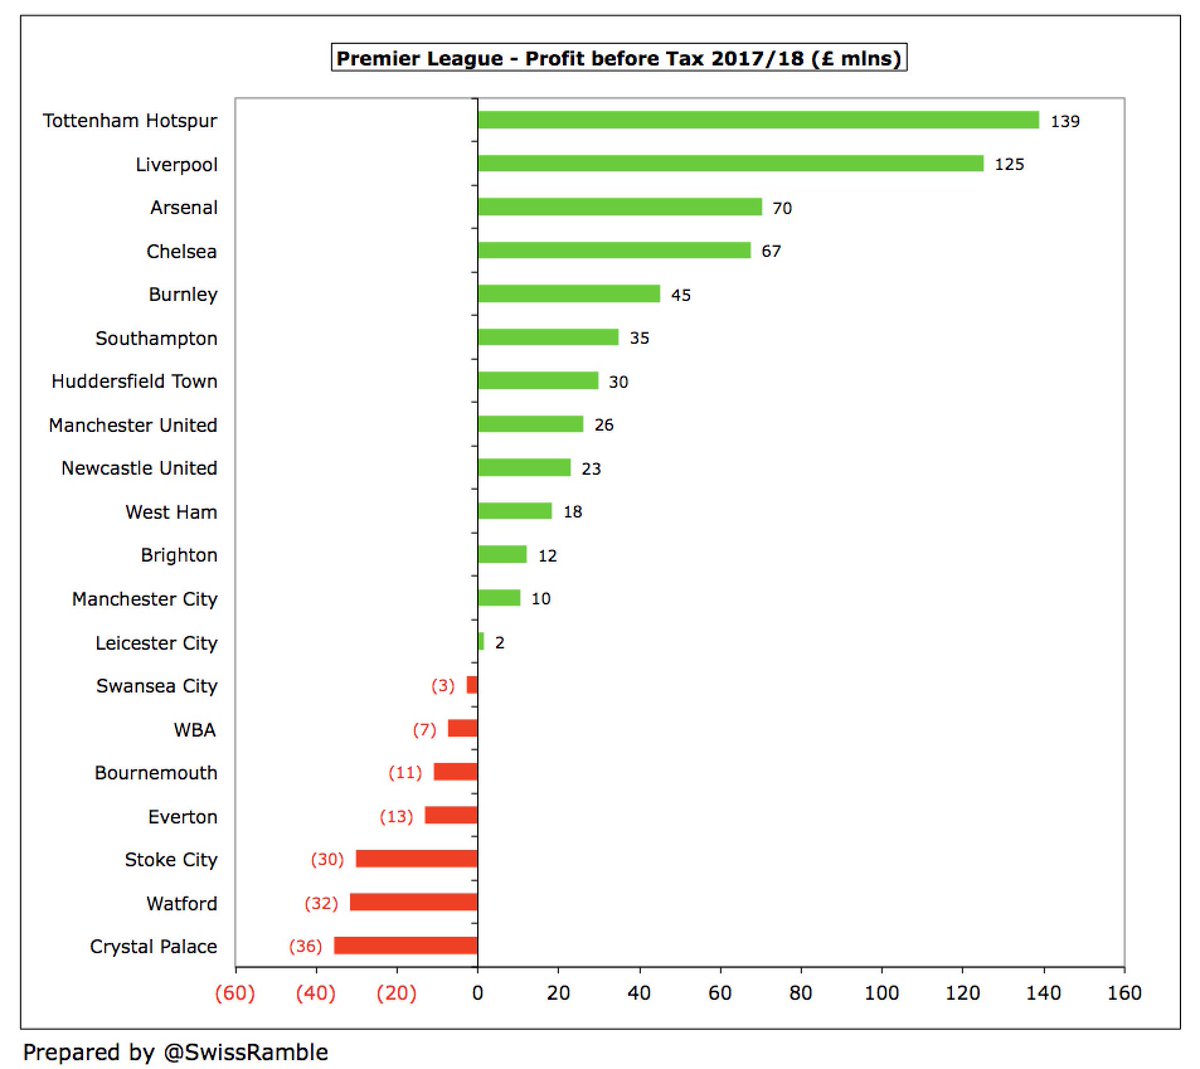
Some clubs made very big profits in 2017/18, e.g. #THFC £139m and #LFC £125m, but no fewer than seven Premier League clubs lost money before tax, led by #CPFC £36m and #WatfordFC £32m. This is significantly worse than the prior season when just one club (#SAFC) lost money.
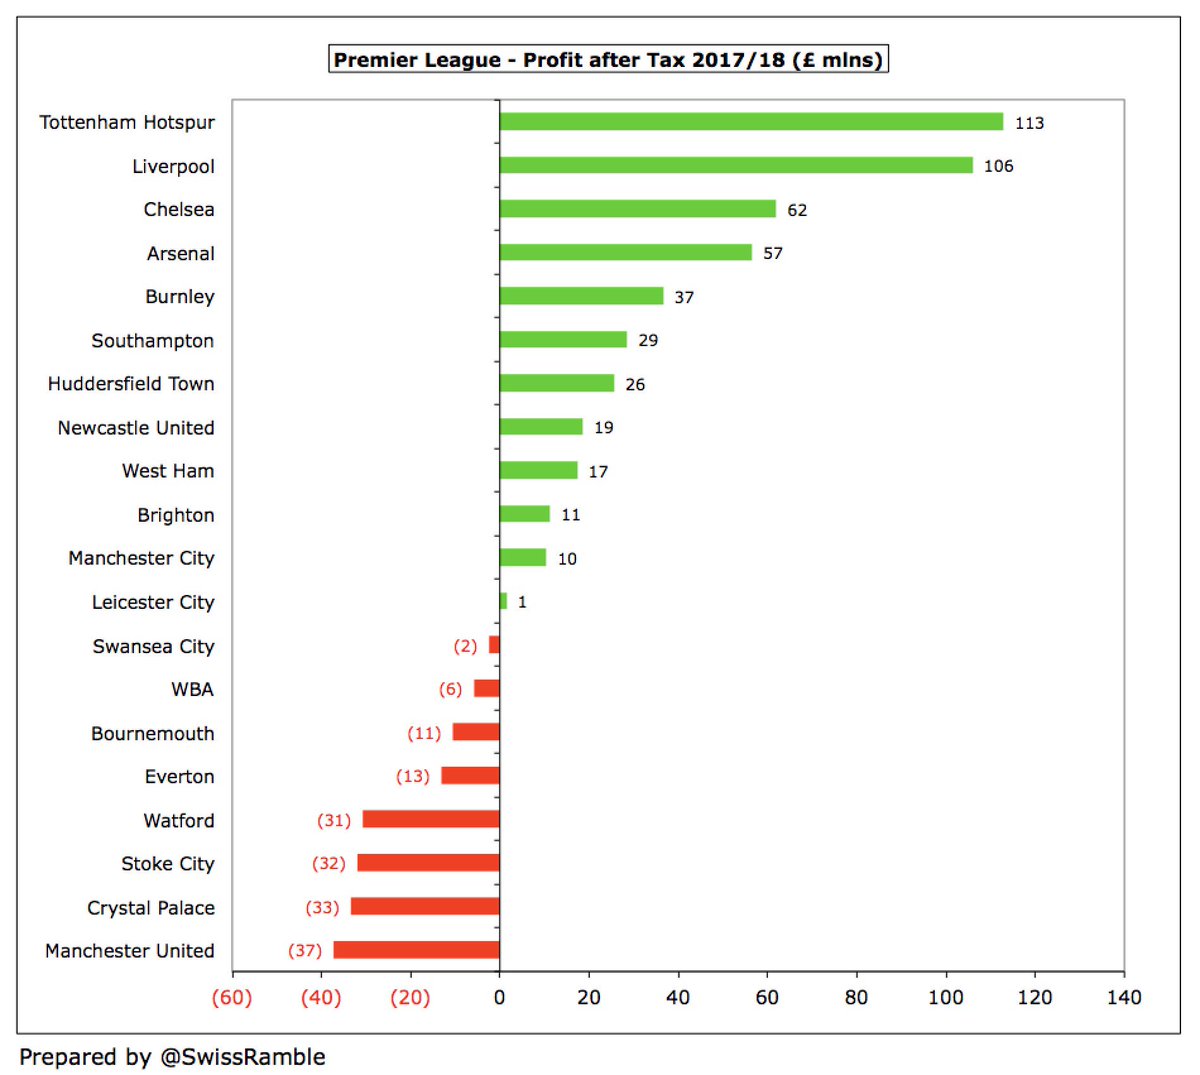
After tax, eight Premier League clubs lost money in 2017/18 with the highest loss reported at #MUFC £37m, as their tax bill increased from £17m to £63m , due to a change in US corporate tax rate that led to a £49m non-cash write-off.
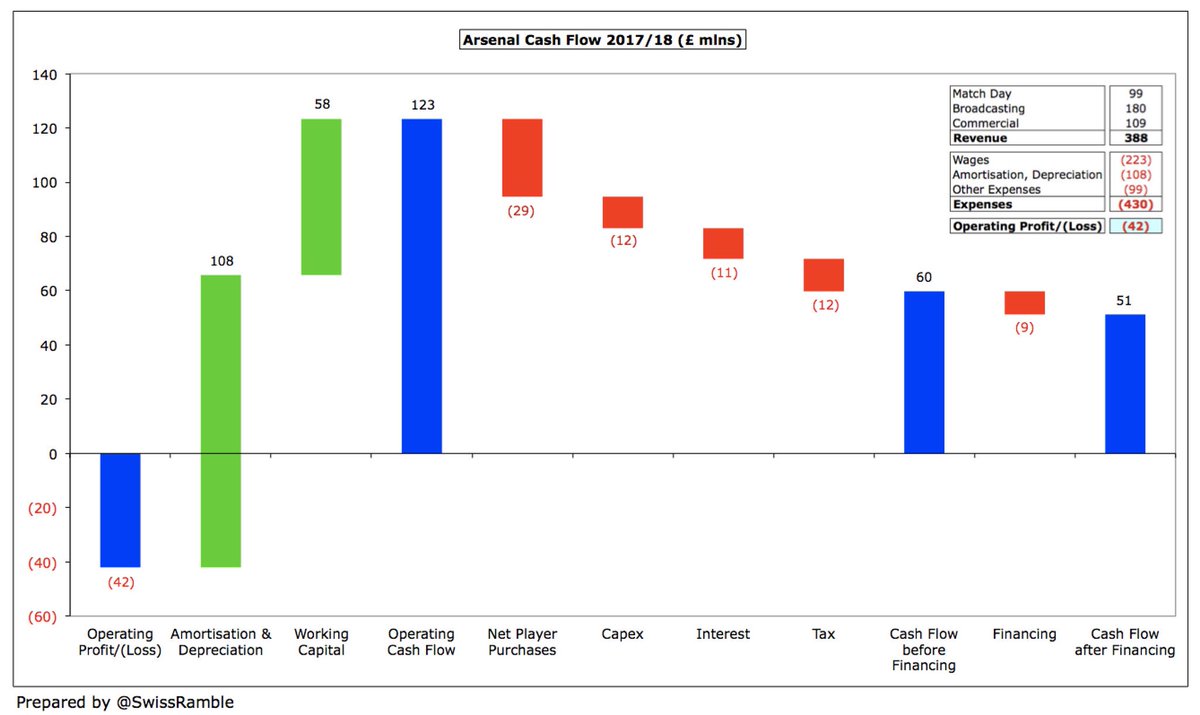
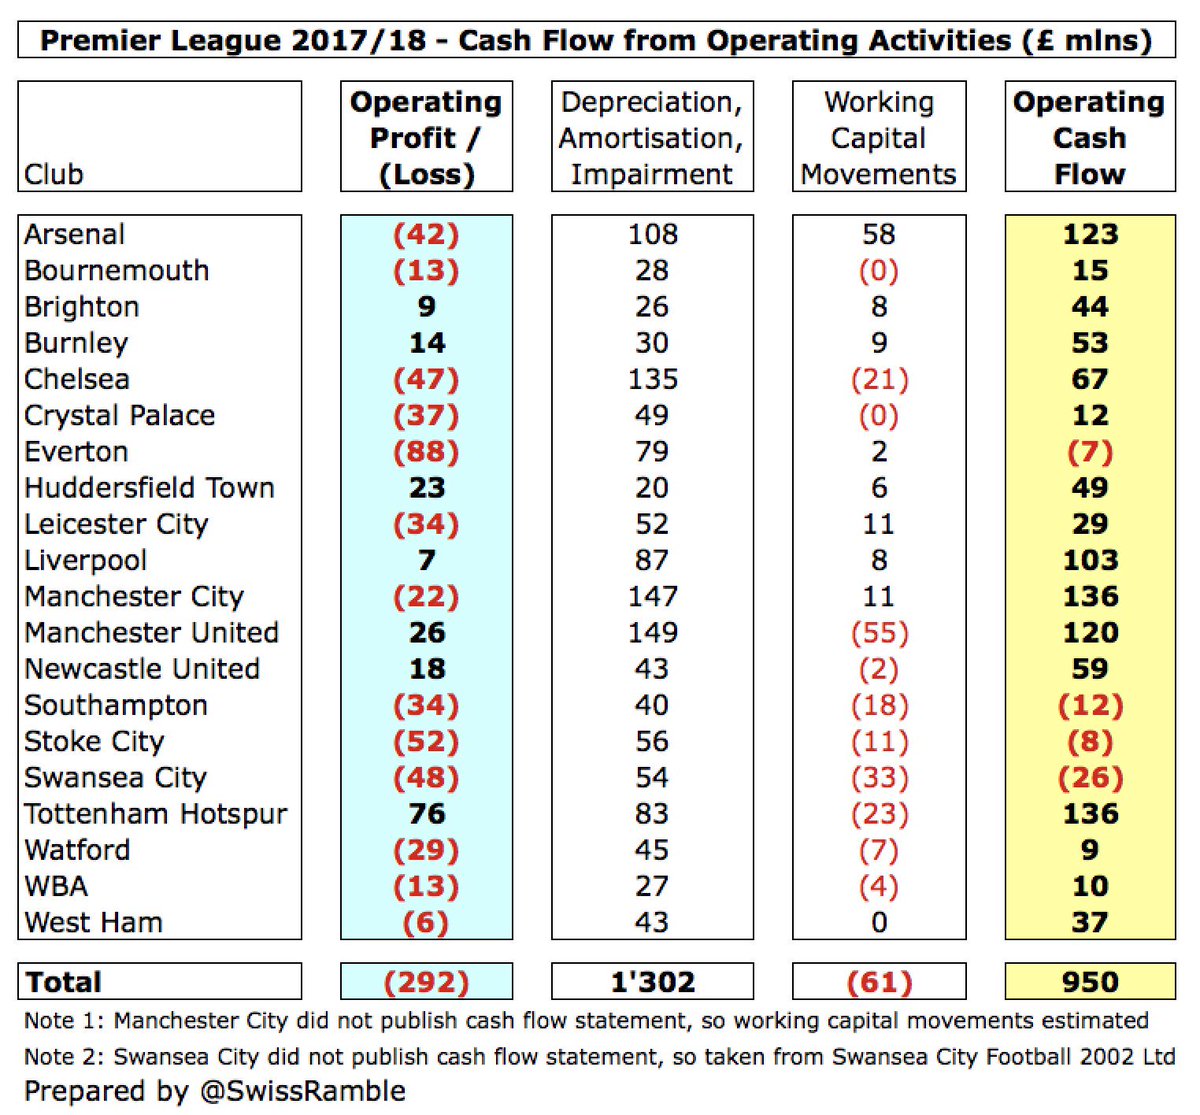
The operating loss of £292m is reconciled to £950m cash flow from operating activities via two adjustments: (a) adding back non-cash items such as player amortisation, depreciation and impairment £1.3 bln; (b) movements in working capital £(61)m.
At this stage we need to understand how football clubs account for player trading, both for purchases and sales, as the accounting treatment in the profit and loss account is very different to the actual cash movements.
Football clubs do not fully expense transfer fees in the year a player is purchased, but instead write-off the cost evenly over the length of the player’s contract via player amortisation, while any profit made from selling players is immediately booked to the accounts.
So if a player is purchased for £30m on a 5-year contract, the annual amortisation in the accounts is £6m, i.e. £30m divided by 5 years. This means that the player’s book value reduces by £6m a year, so after 3 years his value in the accounts would be £12m, i.e. £30m less £18m.
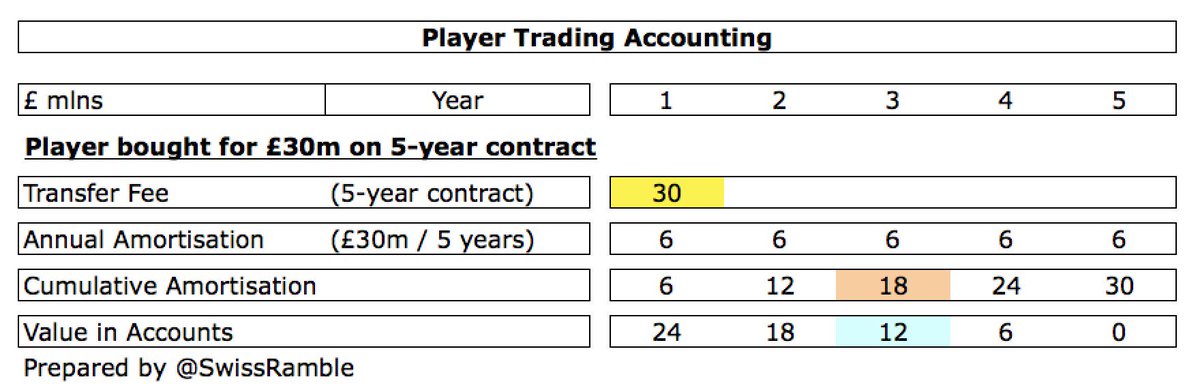
If the player were to be sold at this point for £35m, profit on player sales from an accounting perspective would be £23m, i.e. sales proceeds of £35m less remaining book value of £12m.

Player amortisation is a non-cash expense, so is added back for the cash flow calculation. In the same way, profit on player sales is purely an accounting profit, which is booked in total, regardless of when the club is paid. Instead, cash flow includes cash sales & purchases.
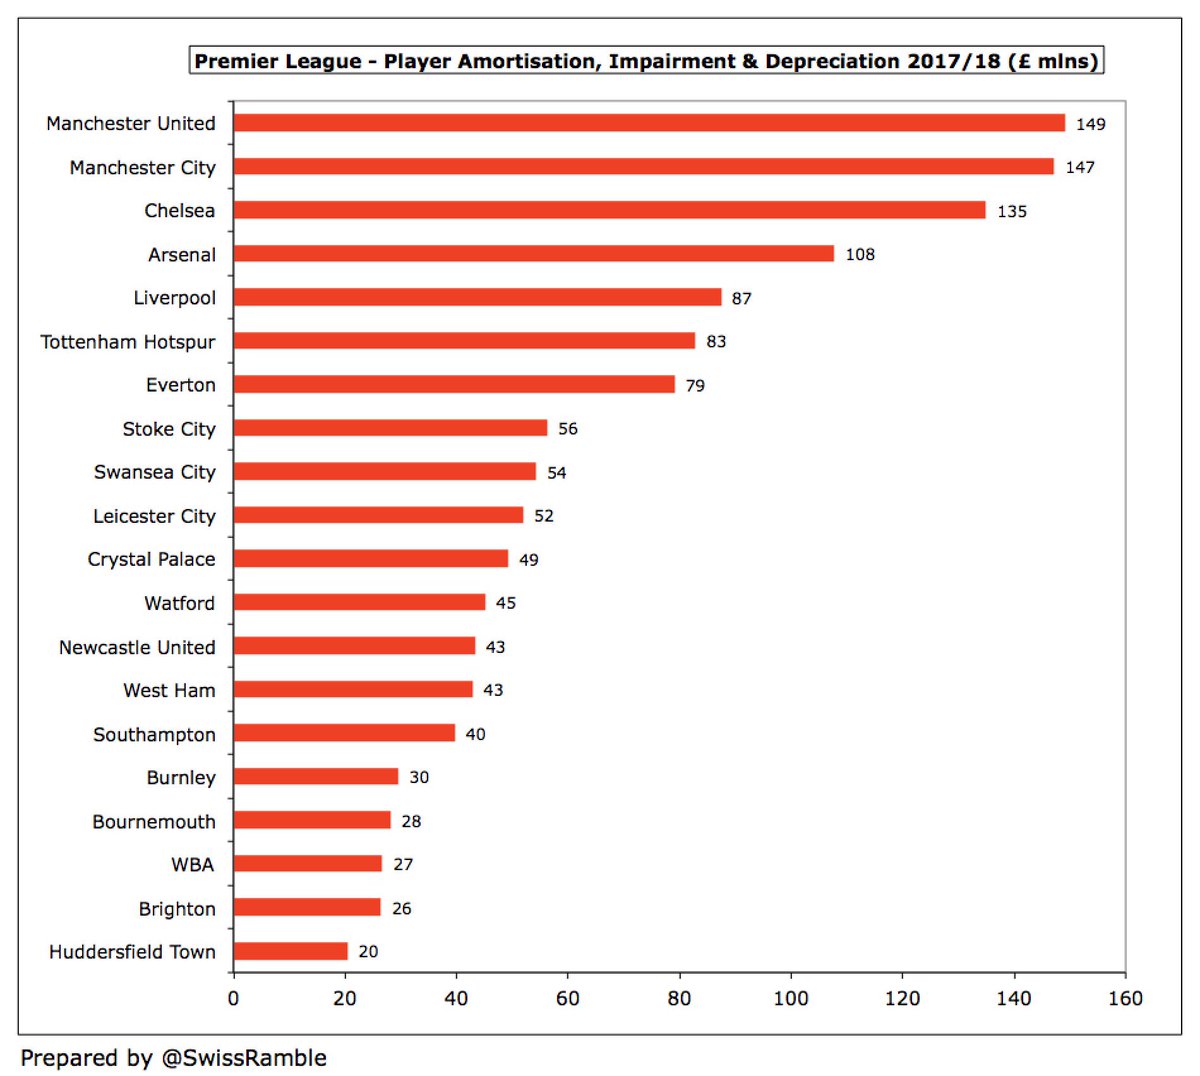
Given the rise in transfer fees, player amortisation has become a major expense in the profit and loss account, e.g. adding back #MCFC £147m amortisation & depreciation moves them from £22m operating loss to £125m cash generated from operations (before working capital movements).
Working capital measures short-term liquidity, defined as current assets less current liabilities. Changes in working capital can cause operating cash flow to differ from net profit, as clubs book revenue and expenses when they occur instead of when cash actually changes hands.
If current liabilities increase, a club is paying its suppliers more slowly, so is holding on to cash (positive for cash flow). On the other hand, if a club’s debtors increase, this means it collected less money from customers than it recorded as revenue (negative for cash flow).

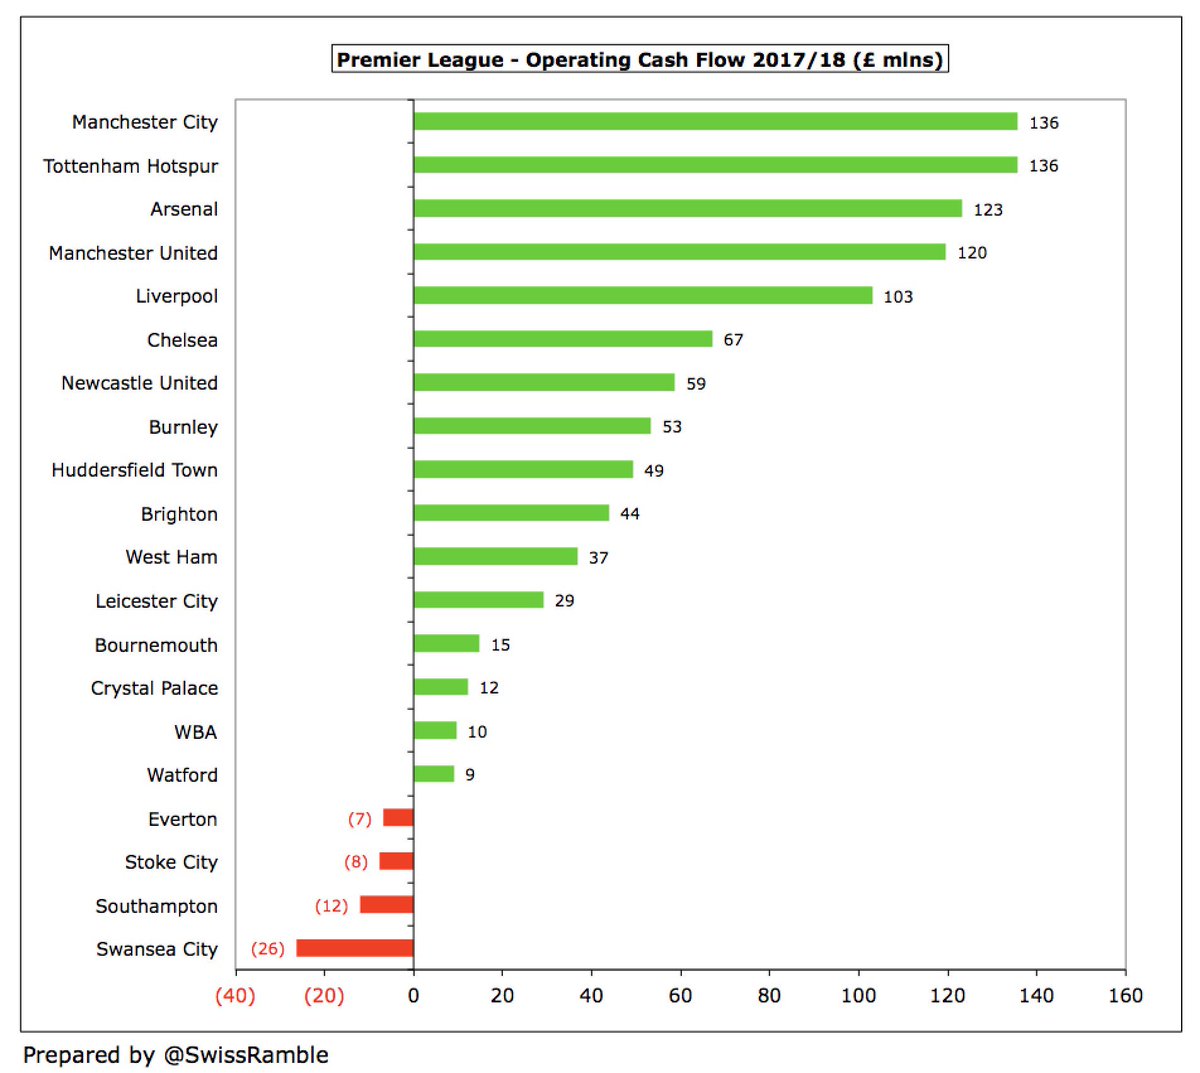
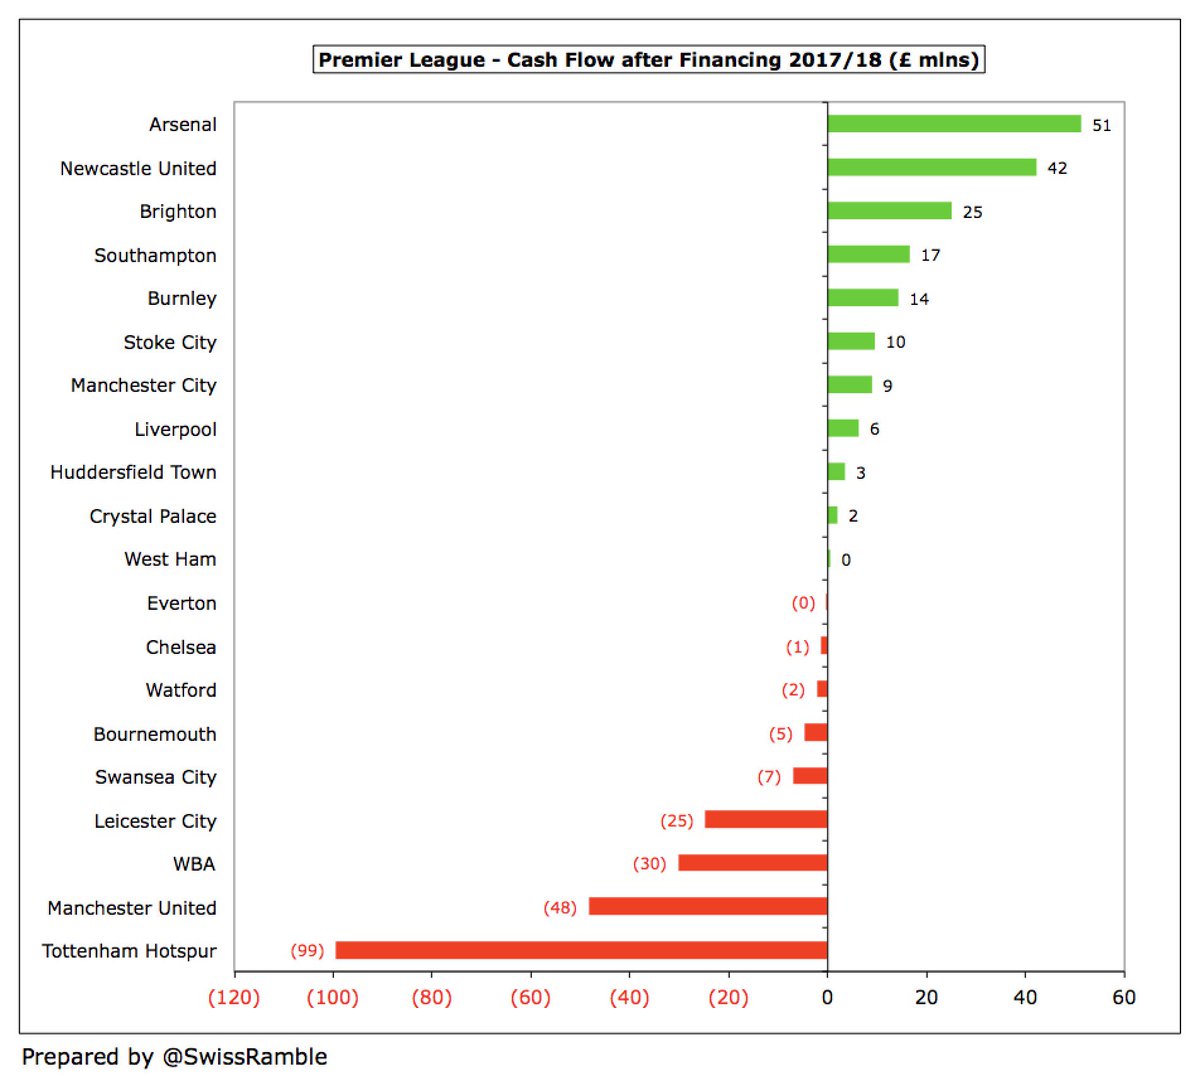
After adjusting for non-cash items and working capital movements, the picture looks better with £950m total operating cash flow, though 4 clubs were still negative. However, some clubs generated significant sums from operations with five of the Big Six above £100m.
This £950m operating cash flow is what is available to the clubs to spend on buying players, investing in infrastructure (stadium or training ground) or paying interest on loans and (occasionally) tax, though additional financing may be required to cover any shortfall.


The cash figure for transfers is the only authentic figure publicly available, but it can also be a bit misleading, as it may not cover the entire fee due to payments made in instalments. Paying transfer fees in stages is increasingly used by some clubs as a source of financing.
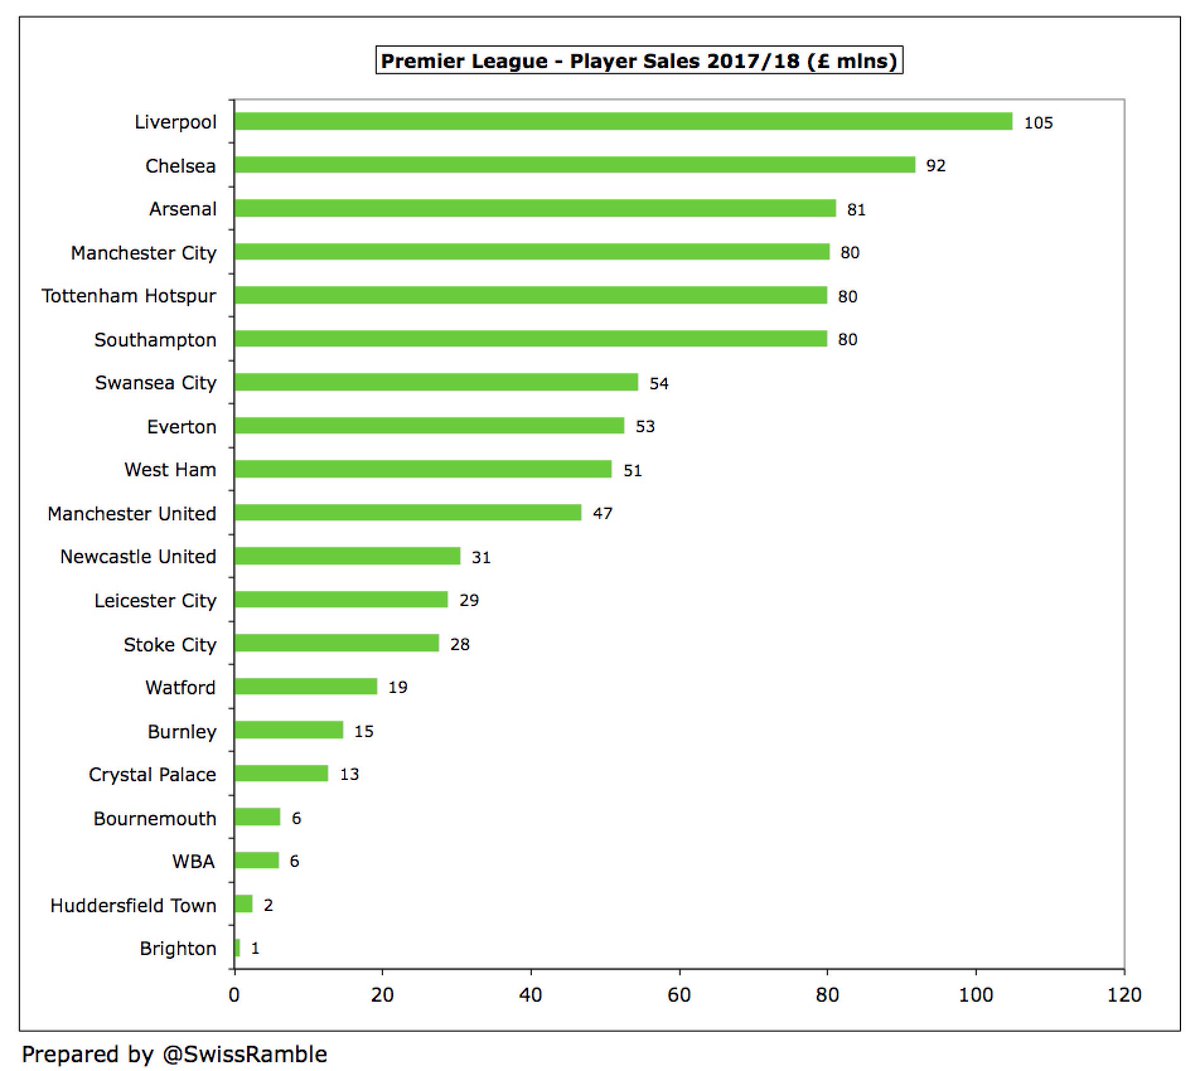

For illustrative purposes, on a cash basis #LFC had £154m player purchases and £105m player sales, giving net player purchases of £49m, which is completely different from the record £124m profit on player sales reported in the profit and loss account.


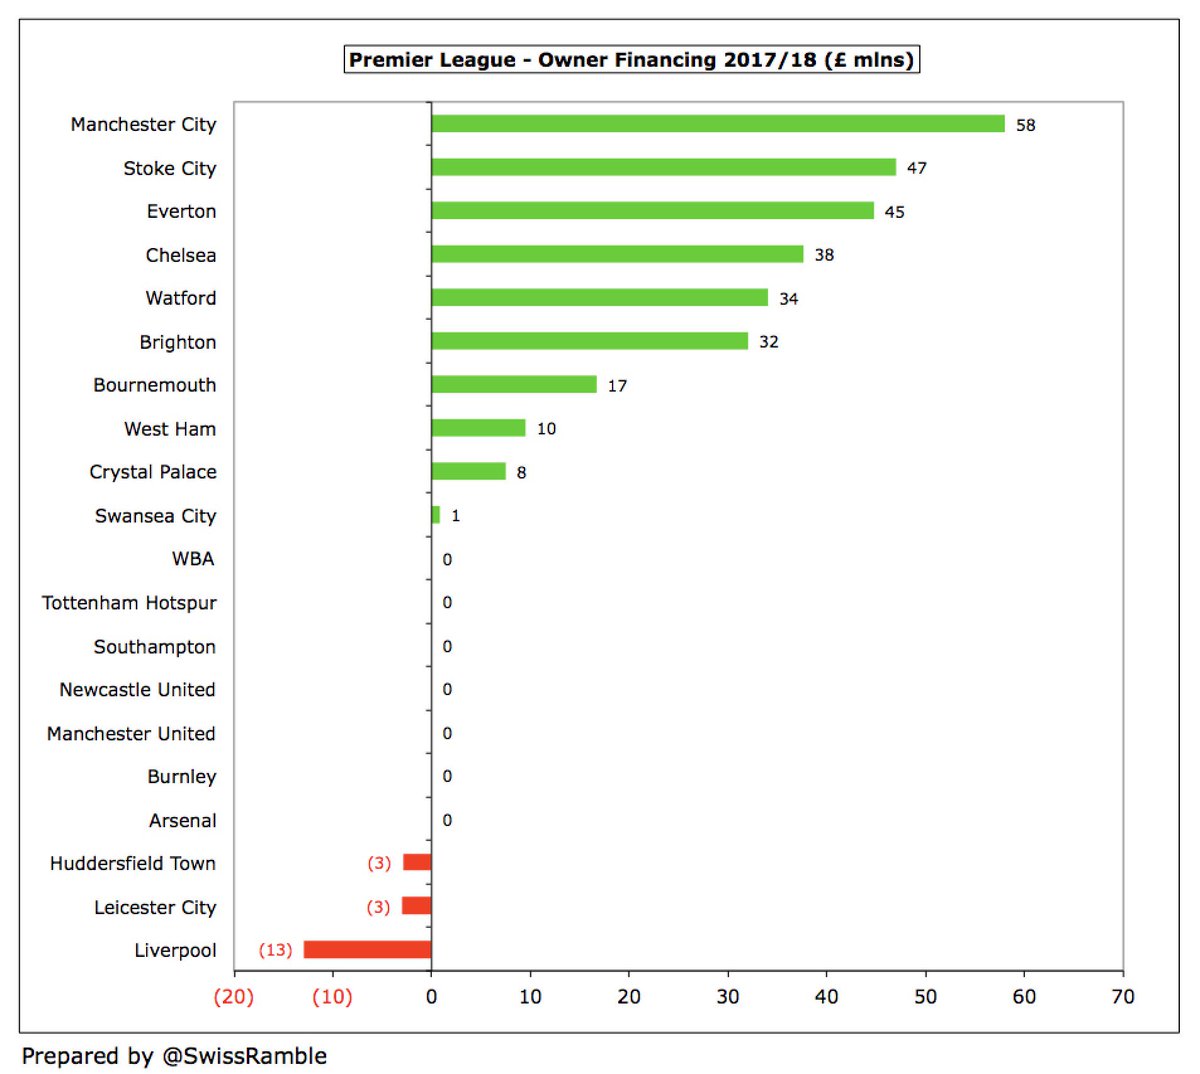
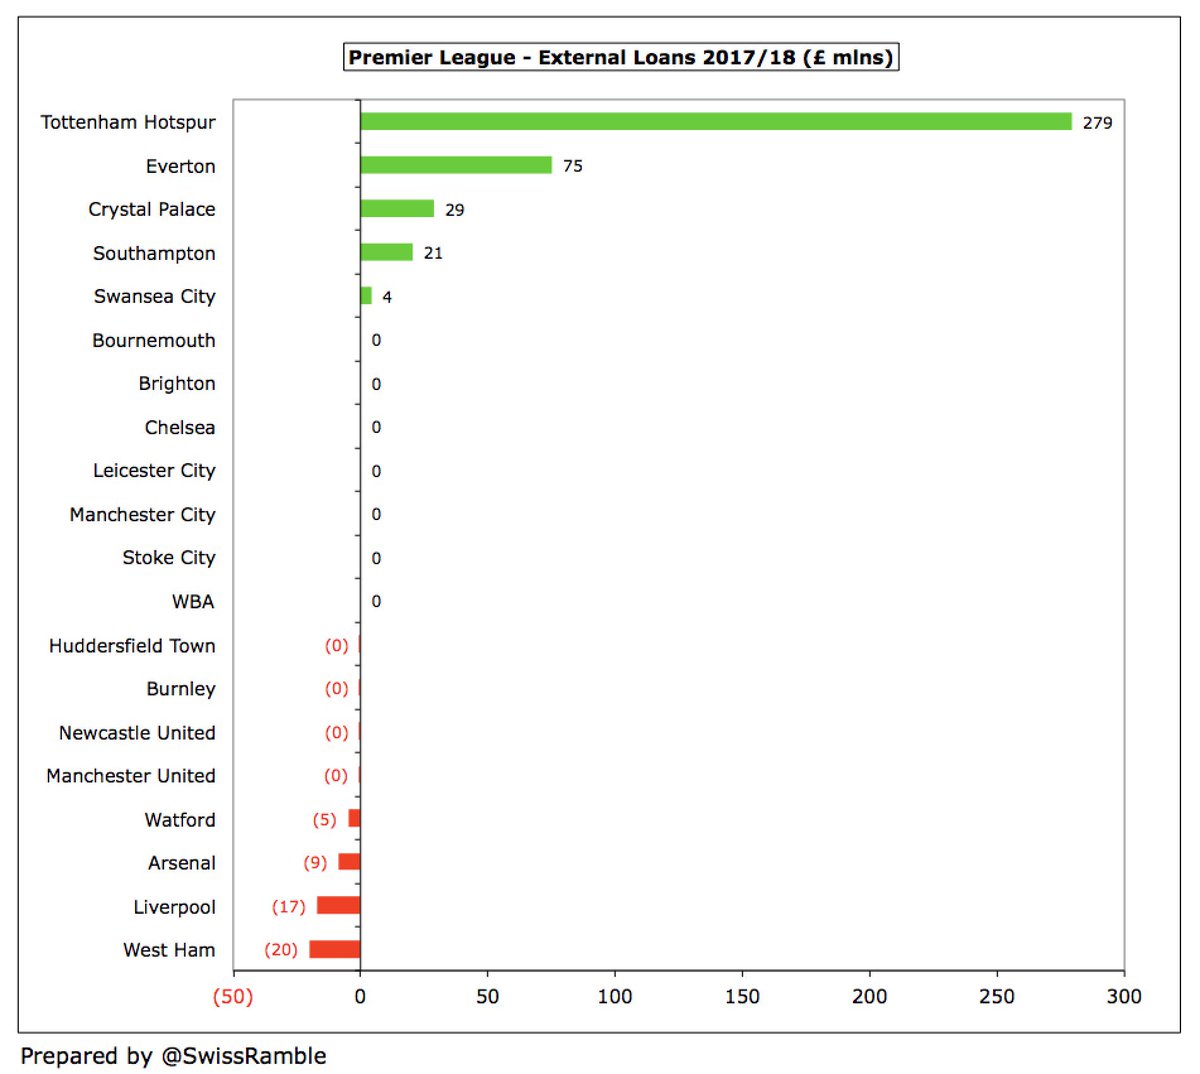
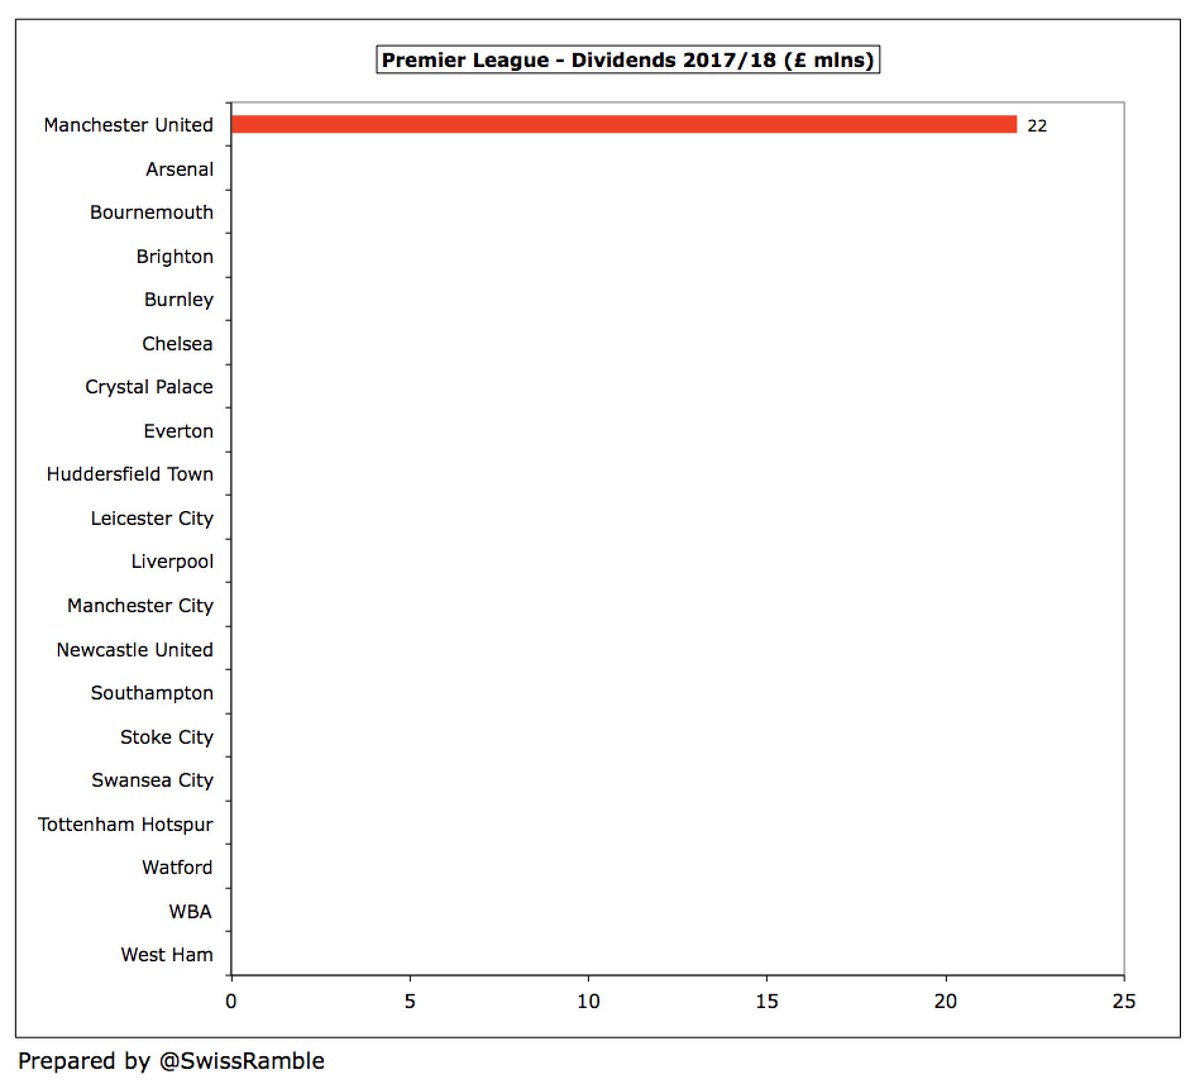
Fortunately (for the clubs), the £642m cash loss is almost entirely covered by £604m financing to give a net cash outflow of only £38m. This funding comprises £269m from owners plus £357m external loans less £22m dividends.

The only club in the Premier League to pay dividends to its owners in 2017/18 was #MUFC, who shelled out £22m to the Glazer family, which makes a hefty £65m over the last three years.
This has been quite technical, but those wishing to understand a football club’s finances and the impact these have on its strategy should, as always, follow the money. That means not just focusing on the P&L, but also looking into the mysterious world of the cash flow statement.
Amongst other things, this analysis has shown that operating profitability deteriorated in the Premier League in 2017/18, partly offset by an improvement in profit on player sales. There was also a significant £0.5 bln increase in the amount of financing required.
As the old saying goes, “Revenue is vanity, profit is sanity, but cash is king.” In other words, the cash flow statement is really important, so a future thread will take a closer look into the cash flow statements of each of the 20 Premier League clubs in 2017/18.